

Question: hello I need a step by step process on how to do this question:) thank you yes u can solve this without a graph but
hello I need a step by step process on how to do this question:) thank you
yes u can solve this without a graph but a graph would be nice
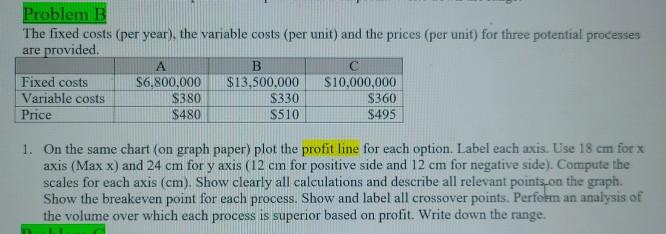
Problem B The fixed costs (per year), the variable costs (per unit) and the prices (per unit) for three potential processes are provided A B C Fixed costs $6.800,000 $13,500,000 $10,000,000 Variable costs $380 $330 $360 Price $480 S510 $495 1. On the same chart (on graph paper) plot the profit line for each option. Label each axis. Use 18 cm for x axis (Max x) and 24 cm for y axis (12 em for positive side and 12 cm for negative side). Compute the scales for each axis (cm). Show clearly all calculations and describe all relevant points on the graph. Show the breakeven point for each process. Show and label all crossover points. Perfoen an analysis of the volume over which each process is superior based on profit. Write down the range
Step by Step Solution
There are 3 Steps involved in it

Get step-by-step solutions from verified subject matter experts