

Question: Hello, I need assisting with this MBA 620 Financial Decision making Assignment dealing with Supply and Demand, Etc ... I've attached the assignment for further

Hello, I need assisting with this MBA 620 Financial Decision making Assignment dealing with Supply and Demand, Etc ...
I've attached the assignment for further review..
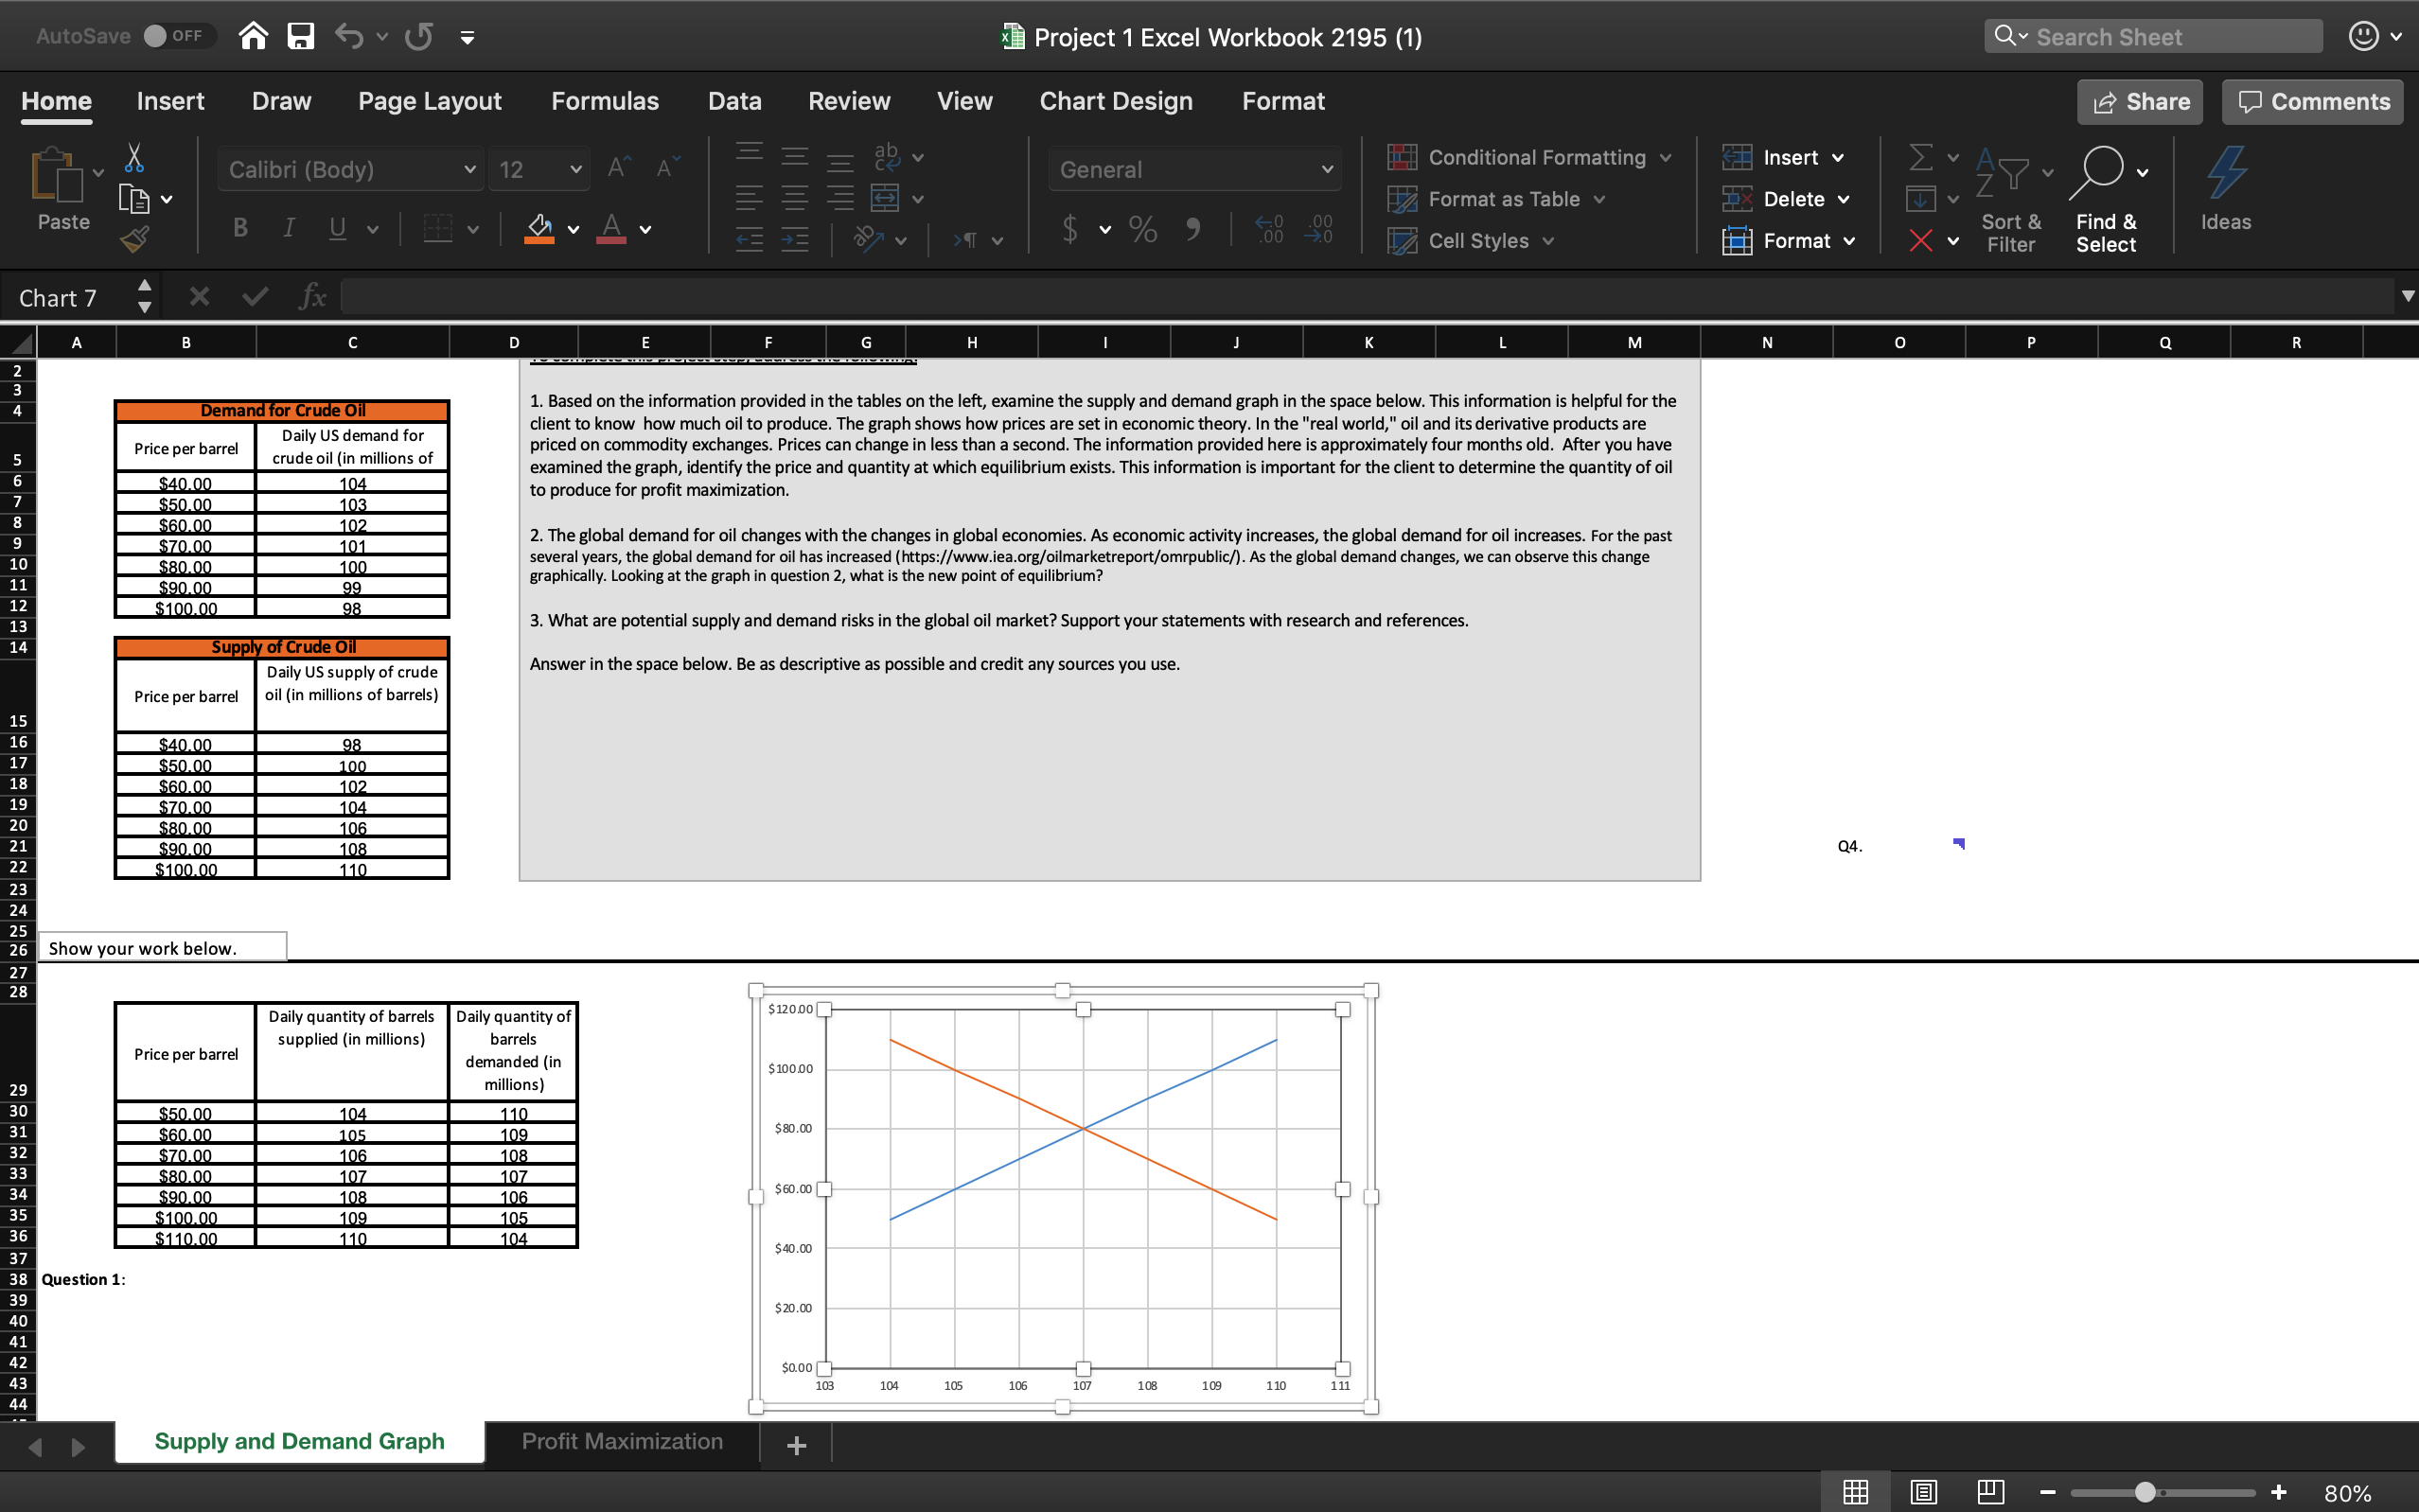
AutoSave OFF 1Project 1 Excel Workbook 2195 (1) Q Search Sheet Home Insert Draw Page Layout Formulas Data Review View Chart Design Format Share Comments Calibri (Body) 12 A General Conditional Formatting Insert Paste B IUV Format as Table Delete v V v % 9 Cell Styles v Format v X Sort & Find & Ideas Filter Select Chart 7 X V fx C D F G H M N 0 Q R Demand for Crude Oil 1. Based on the information provided in the tables on the left, examine the supply and demand graph in the space below. This information is helpful for the Price per barrel Daily US demand for client to know how much oil to produce. The graph shows how prices are set in economic theory. In the "real world," oil and its derivative products are crude oil (in millions of priced on commodity exchanges. Prices can change in less than a second. The information provided here is approximately four months old. After you have $40.00 104 examined the graph, identify the price and quantity at which equilibrium exists. This information is important for the client to determine the quantity of oil $50.00 103 to produce for profit maximization $60.00 102 $70.00 2. The global demand for oil changes with the changes in global economies. As economic activity increases, the global demand for oil increases. For the past $80.00 101 100 several years, the global demand for oil has increased (https://www.iea.org/oilmarketreport/omrpublic/). As the global demand changes, we can observe this change $90.00 $100.00 koka graphically. Looking at the graph in question 2, what is the new point of equilibrium? 3. What are potential supply and demand risks in the global oil market? Support your statements with research and references. Supply of Crude Oil Daily US supply of crude Answer in the space below. Be as descriptive as possible and credit any sources you use. Price per barrel oil (in millions of barrels) $40.00 $50.00 98 100 $60.00 102 $70.00 104 $80.00 106 $90.00 108 $100.00 110 Q4. Show your work below. 28 Daily quantity of barrels Daily quantity of $120.00 Price per barrel supplied (in millions) barrels demanded (in millions) $100.00 $50.00 $60.00 104 110 105 109 $ 80.00 $70.00 106 108 $80.00 107 107 $90.00 108 106 $ 60.00 $100.00 109 105 $110.00 110 104 $40.00 Question 1: $20.00 $0.00 103 104 105 106 107 108 109 1 10 171 Supply and Demand Graph Profit Maximization 80%
Step by Step Solution
There are 3 Steps involved in it

Get step-by-step solutions from verified subject matter experts