

Question: Hello, I need help creating a network chart/sociogram between the character's in the movie The Devil Wears Prada. I need to make one of Andy
Hello, I need help creating a network chart/sociogram between the character's in the movie The Devil Wears Prada. I need to make one of Andy before and Andy after. Can anyone help me with this? At least an example of where to start?
The instructor instructions are as follows:
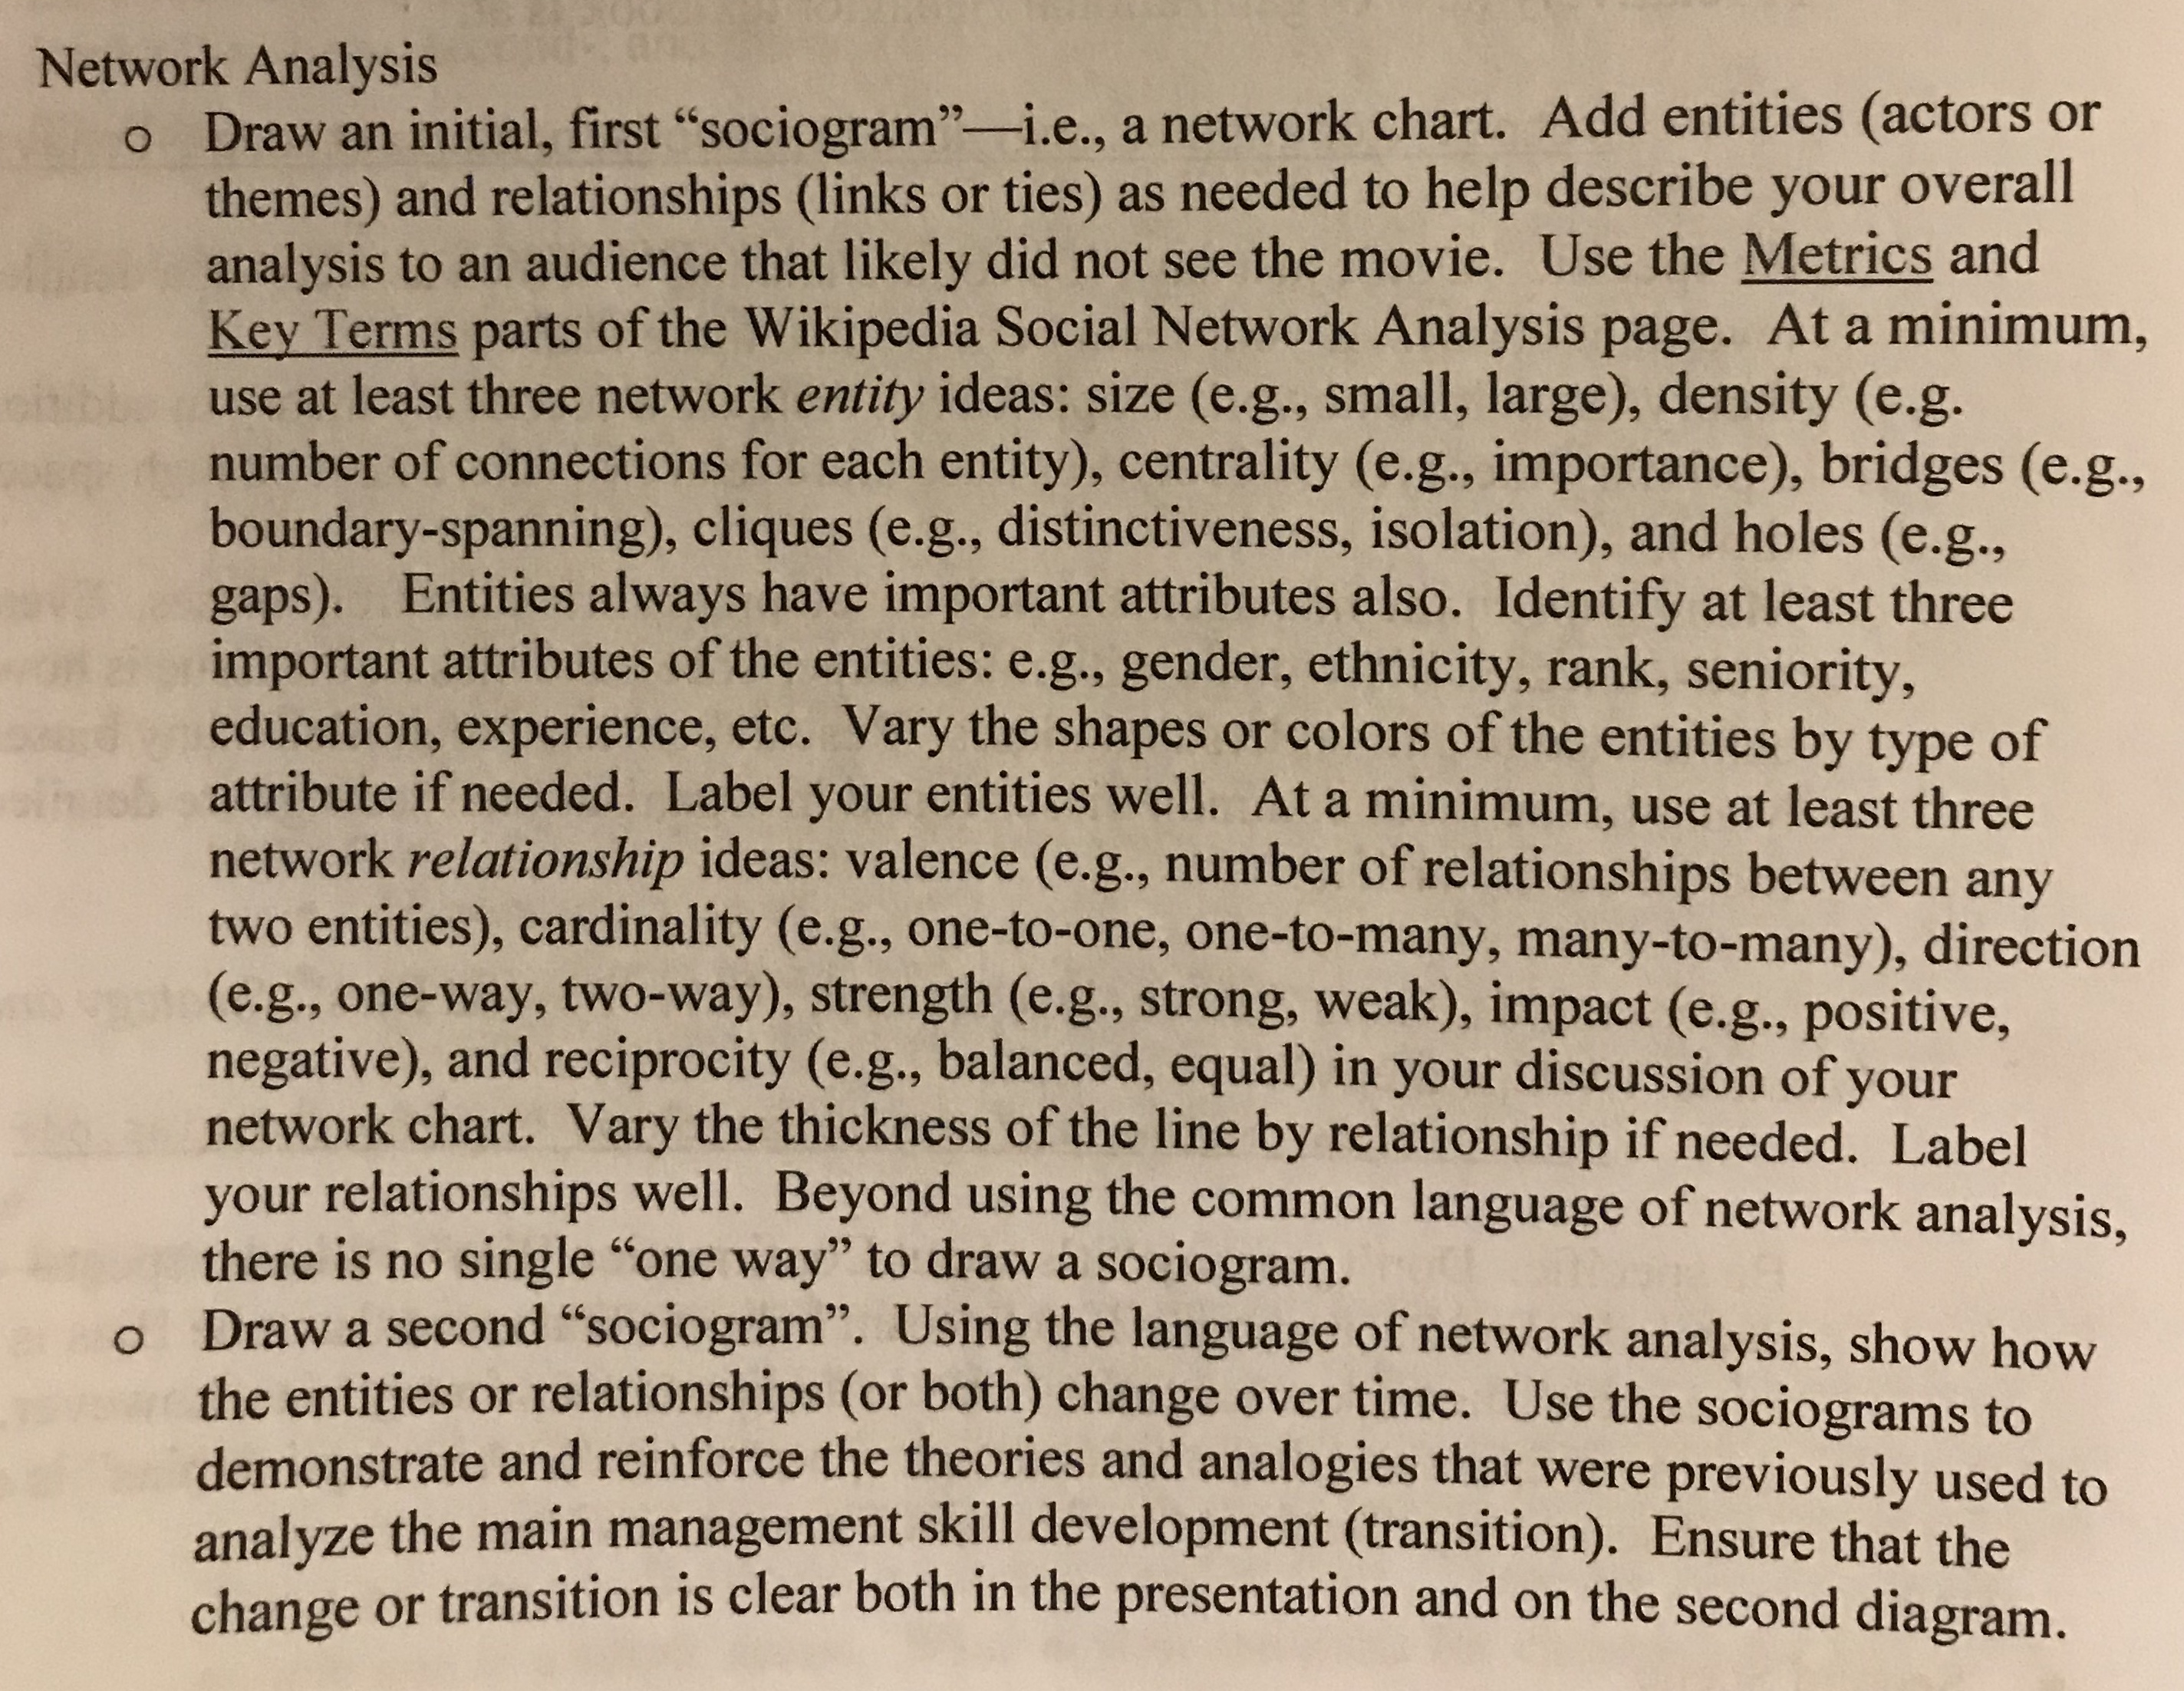
Network Analysis o Draw an initial, first "sociogram"-i.e., a network chart. Add entities (actors or themes) and relationships (links or ties) as needed to help describe your overall analysis to an audience that likely did not see the movie. Use the Metrics and Key Terms parts of the Wikipedia Social Network Analysis page. At a minimum, use at least three network entity ideas: size (e.g., small, large), density (e.g. number of connections for each entity), centrality (e.g., importance), bridges (e.g., boundary-spanning), cliques (e.g., distinctiveness, isolation), and holes (e.g., gaps). Entities always have important attributes also. Identify at least three important attributes of the entities: e.g., gender, ethnicity, rank, seniority, education, experience, etc. Vary the shapes or colors of the entities by type of attribute if needed. Label your entities well. At a minimum, use at least three network relationship ideas: valence (e.g., number of relationships between any two entities), cardinality (e.g., one-to-one, one-to-many, many-to-many), direction (e.g., one-way, two-way), strength (e.g., strong, weak), impact (e.g., positive, negative), and reciprocity (e.g., balanced, equal) in your discussion of your network chart. Vary the thickness of the line by relationship if needed. Label your relationships well. Beyond using the common language of network analysis, there is no single "one way" to draw a sociogram. o Draw a second "sociogram". Using the language of network analysis, show how the entities or relationships (or both) change over time. Use the sociograms to demonstrate and reinforce the theories and analogies that were previously used to analyze the main management skill development (transition). Ensure that the change or transition is clear both in the presentation and on the second diagram
Step by Step Solution
There are 3 Steps involved in it

Get step-by-step solutions from verified subject matter experts