

Question: Hello, I need help creating a Spreadsheet for the Graph portion of this. The full scenario information for the graph sheet is provided in the
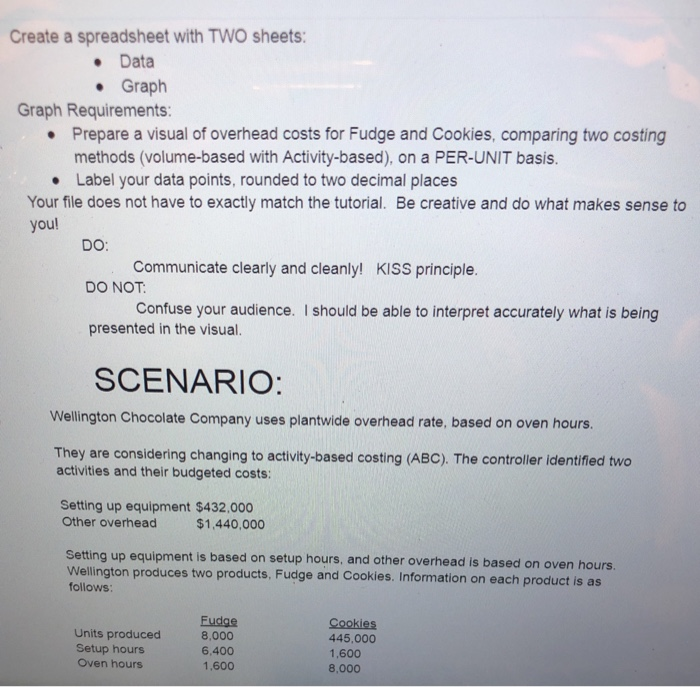
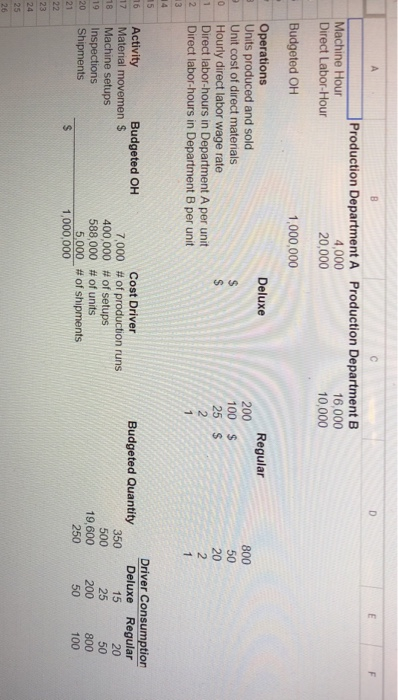
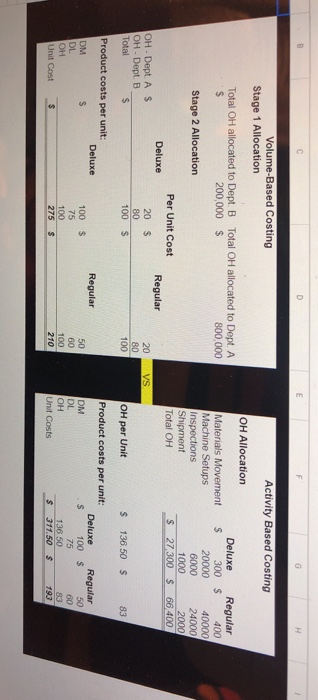
Create a spreadsheet with TWO sheets: Data Graph Graph Requirements: .Prepare a visual of overhead costs for Fudge and Cookies, comparing two costing methods (volume-based with Activity-based), on a PER-UNIT basis. .Label your data points, rounded to two decimal places Your file does not have to exactly match the tutorial. Be creative and do what makes sense to youl DO: DO NOT presented in the visual. SCENARIO: Communicate clearly and cleanly! KISS principle. Confuse your audience. I should be able to interpret accurately what is being Wellington Chocolate Company uses plantwide overhead rate, based on oven hours. They are considering changing to activity-based costing (ABC). The controller identified two activities and their budgeted costs: Setting up equipment $432.000 Other overhead $1,440,000 Setting up equipment is based on setup hours, and other overhead is based on oven hours Wellington produces two products, Fudge and Cookies. Information on each product is as follows Fudge Units produced8,000 6,400 1,600 Cookies 445,000 1,600 8,000 Setup hours Oven hours Machine Hour Direct Labor-Hour Production Department A 4,000 20,000 Production Department B 16,000 10,000 Budgeted OH 1,000,000 Operations Units produced and sold Unit cost of direct materials Hourly direct labor wage rate Direct labor-hours in Department A per unit Direct labor-hours in Department B per unit Deluxe Regular 200 100 S 25 $ 0 2 2 Driver Consumption Deluxe Regular 6 Activity Budgeted OH Cost Driver # of production runs # of setups # of units # of shipments Budgeted Quantity 7,000 400,000 588,000 5,000 1,000,000 17 Material movemen $ 18 Machine setups 15 25 200 9 Inspections 20 Shipments 19,600 800 100 50 Volume-Based Costing Activity Based Costing Stage 1 Allocation OH Allocation Deluxe Regular 400 40000 Total OH allocated to Dept. B Total OH allocated to Dept A 200,000 $ 800,000 Materials Movement S 300 Machine Setups 20000 Inspections Shipment Total OH Stage 2 Allocation 1000 Per Unit Cost S 27.300 66.400 Deluxe Regular OH- Dept A $ OH- Dept. B Total 20 $ 100 $ 100 OH per Unit s 136.50 S 83 Product costs per unit: Product costs per unit. Deluxe Regular Deluxe Regular 100 s DL OH Unit Cost 100 $ 75 100 275 $ DL OH nit Costs 100 210 136 50 $ 311.50193 s
Step by Step Solution
There are 3 Steps involved in it

Get step-by-step solutions from verified subject matter experts