Question: hello i need help for the incorrect answers Critical values of F Critical values of F = (3,)/(s,) at 959% confidence level for two-tailed F
hello i need help for the incorrect answers
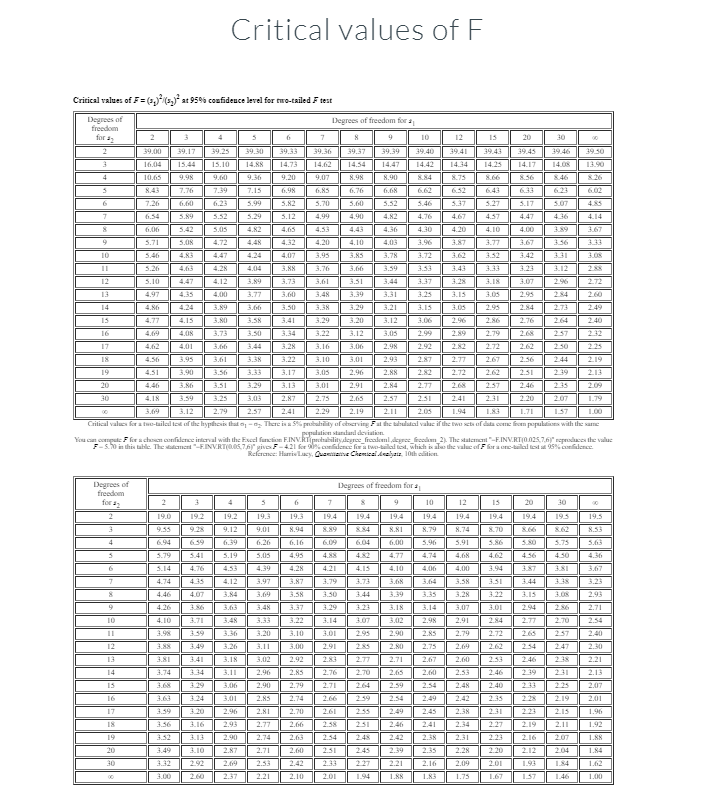
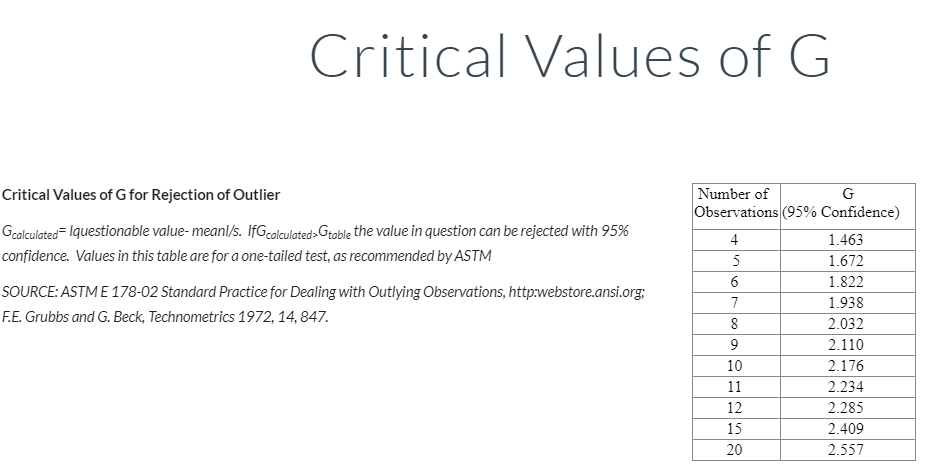
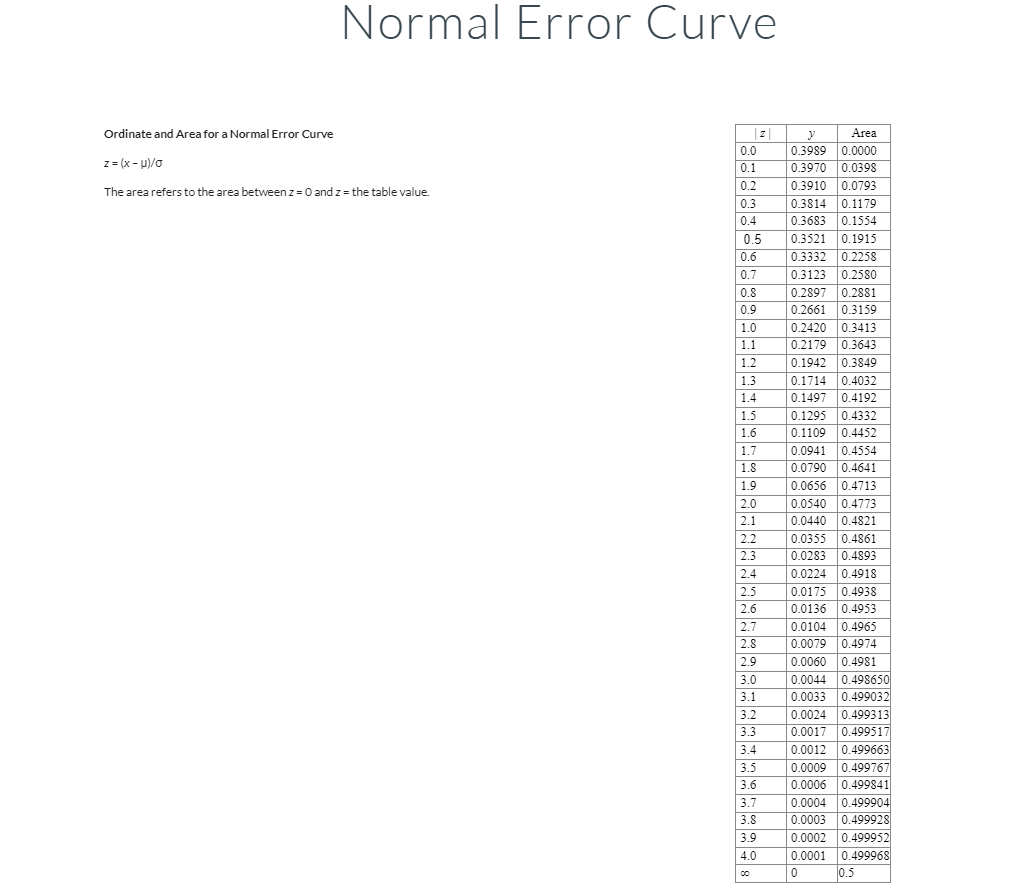
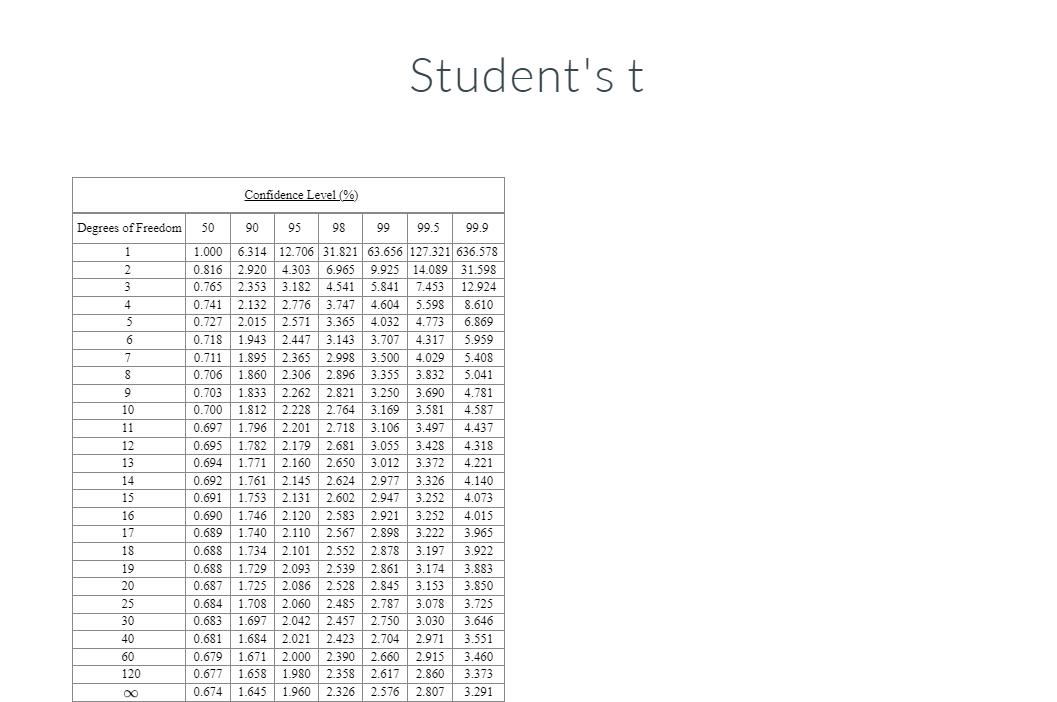
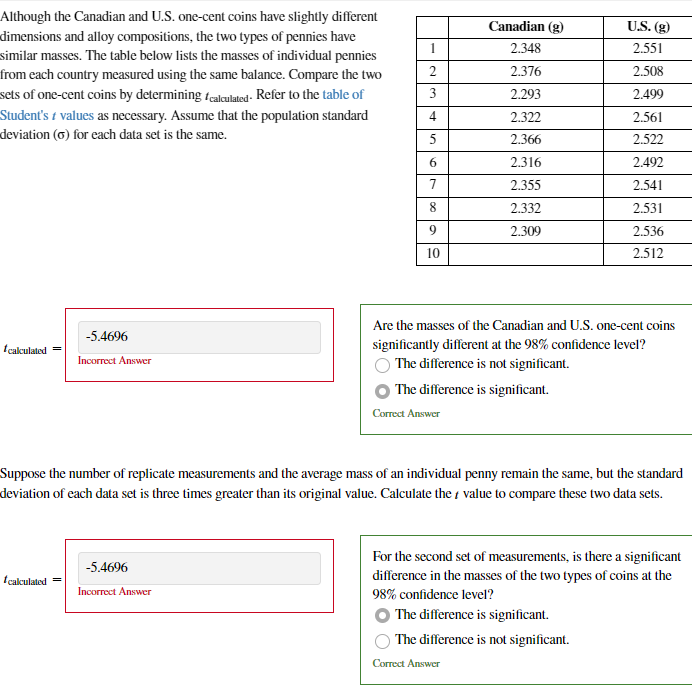
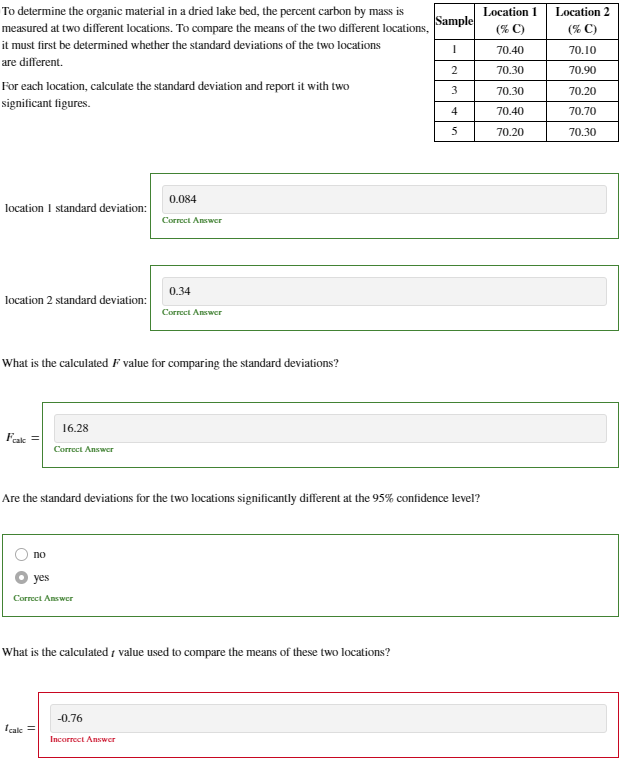
Critical values of F Critical values of F = (3,)"/(s,)" at 959% confidence level for two-tailed F test Degrees of freedom Degrees of freedom for s for 37 39.17 39.25 39.30 39.36 39.39 16.04 15.44 15.10 14.N8 14.62 39.30 10.65 9.98 14 08 13.90 3.89 3.42 20 3.679 Critical values for a tau-bailed load of the hypthesis that a You can compare F for a clown confidence interval with the Excel function F.INV.RTprob F -5.70 in this table. The statement "-FINVRT(0 05,7.6/' gives F - 421 for 20%% cur The statement "-F.INV.RT(0 025, 7.6/ reproduces the value Reference: Harris Lucy, Quermentor Chemical dechair, 10thalition. o-bled ted, which is adon the value of F for a one-bill lead at 95% cur ilent. Degrees of freedom Degrees of freedom for s for s, 10 19.2 19.3 9.12 639 6.39 3.41 3.19 5.05 4.53 4.12 3.84Critical Values of G Critical Values of G for Rejection of Outlier Number of G Observations (95% Confidence) Gcalculated= Iquestionable value- meanl/s. IfGcalculated>Gtable the value in question can be rejected with 95% 4 1.463 confidence. Values in this table are for a one-tailed test, as recommended by ASTM 1.672 6 1.822 SOURCE: ASTM E 178-02 Standard Practice for Dealing with Outlying Observations, http:webstore.ansi.org; 7 1.938 F.E. Grubbs and G. Beck, Technometrics 1972, 14, 847. 8 2.032 2.110 10 2.176 11 2.234 12 2.285 15 2.409 20 2.557Normal Error Curve Ordinate and Area for a Normal Error Curve y Area 0.0 0.3989 0.0000 z = (x - P)/O 0.1 0.3970 0.0398 The area refers to the area between z = 0 and z = the table value. 0.2 0.3910 0.0793 0.3 0.3814 0.1179 0.4 0.3683 0.1554 0.5 0.3521 0.1915 0.6 0.3332 0.2258 0.7 0.3123 0.2580 0.8 0.2881 0.9 0.2661 0.3159 1.0 0.2420 0.3413 1.1 0.2179 0.3643 1.2 0.1942 0.3849 1.3 0.1714 0.4032 1.4 0.1497 0.4192 1.5 0.1295 0.4332 1.6 0.1109 0.4452 1.7 0.0941 0.4554 1.8 0.0790 0.4641 1.9 0.0656 0.4713 2.0 0.0540 0.4773 2.1 0.0440 0.4821 2.2 0.0355 0.4861 2.3 0.0283 0.4893 2.4 0.0224 0 2.5 0.0175 0 2.6 0.0136 0.4953 2.7 0.0104 0.4965 2.8 0.0079 0.4974 2.9 0.0060 0.4981 3.0 0.0044 0.498650 3.1 0.0033 0.499032 3.2 0.0024 0.499313 3.3 0.0017 0.499517 3.4 0.0012 0.499663 3.5 0.0009 0.499767 3.6 0.0006 0.499841 3.7 0.0004 0.499904 3.8 0.0003 0.499928 3.9 0.0002 0.499952 4.0 0.0001 0.499968 10.5\fAlthough the Canadian and U.S. one-cent coins have slightly different Canadian (g) U.S. (2) dimensions and alloy compositions, the two types of pennies have similar masses. The table below lists the masses of individual pennies 2.348 2.551 from each country measured using the same balance. Compare the two 2 2.376 2.508 sets of one-cent coins by determining calculated- Refer to the table of 3 2.293 2.499 Student's / values as necessary. Assume that the population standard 4 2.322 2.561 deviation (6) for each data set is the same. 5 2.366 2.522 6 2.316 2.492 7 2.355 2.541 8 2.332 2.531 2.309 2.536 10 2.512 Are the masses of the Canadian and U.S. one-cent coins -5.4696 I calculated = significantly different at the 98% confidence level? Incorrect Answer The difference is not significant. The difference is significant. Correct Answer Suppose the number of replicate measurements and the average mass of an individual penny remain the same, but the standard deviation of each data set is three times greater than its original value. Calculate the / value to compare these two data sets. For the second set of measurements, is there a significant -5.4696 I calculated = difference in the masses of the two types of coins at the Incorrect Answer 98% confidence level? The difference is significant. The difference is not significant. Correct AnswerTo determine the organic material in a dried lake bed, the percent carbon by mass is Location 1 Location 2 Sample measured at two different locations. To compare the means of the two different locations, (% C) it must first be determined whether the standard deviations of the two locations 70.40 70.10 are different. 2 70.30 70.90 For each location, calculate the standard deviation and report it with two 70.30 70.20 significant figures. 4 70.40 70.70 5 70.20 70.30 0.084 location I standard deviation: Correct Answer 0.34 location 2 standard deviation: Correct Answer What is the calculated F value for comparing the standard deviations? 16.28 Fak = Correct Answer Are the standard deviations for the two locations significantly different at the 95% confidence level? O no yes Correct Answer What is the calculated / value used to compare the means of these two locations? -0.76 calc = Incorrect
Step by Step Solution
There are 3 Steps involved in it
1 Expert Approved Answer
Step: 1 Unlock
Question Has Been Solved by an Expert!
Get step-by-step solutions from verified subject matter experts
Step: 2 Unlock
Step: 3 Unlock
Students Have Also Explored These Related Mathematics Questions!