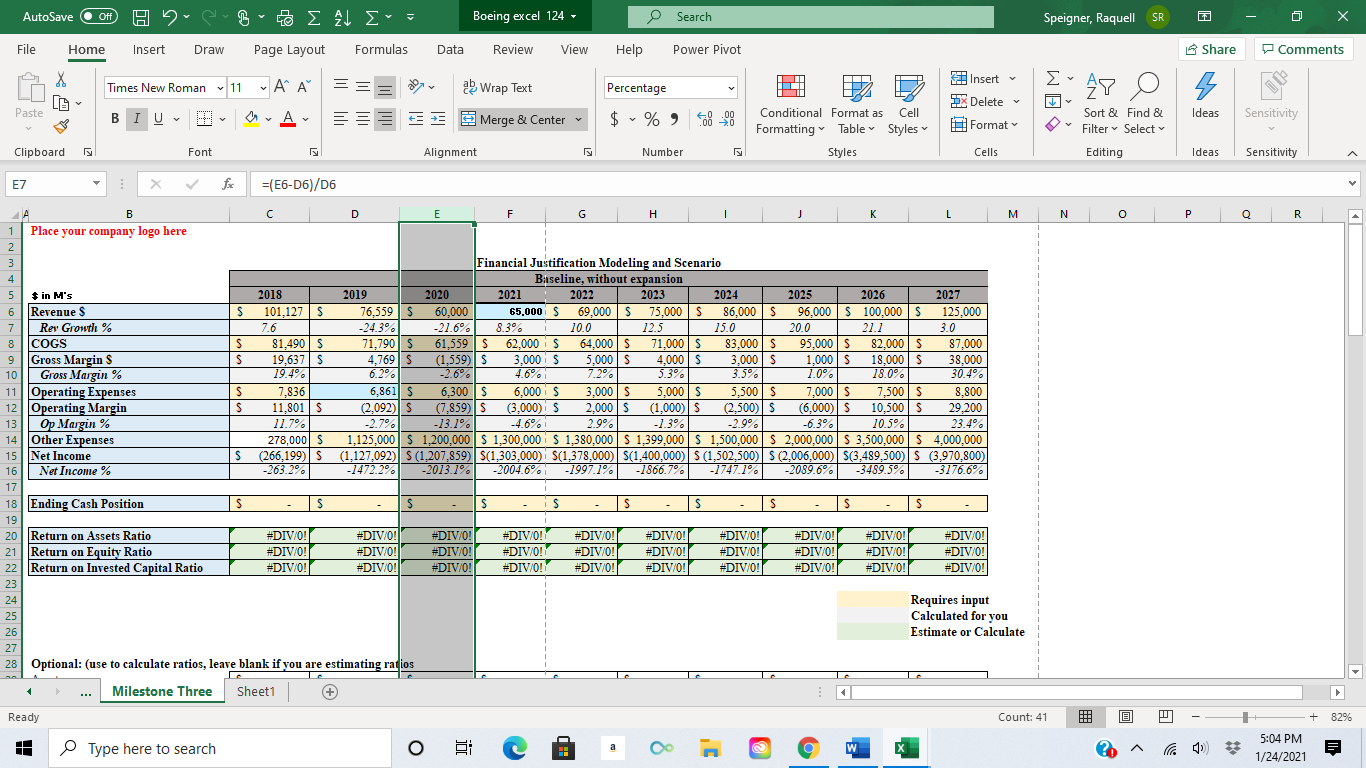
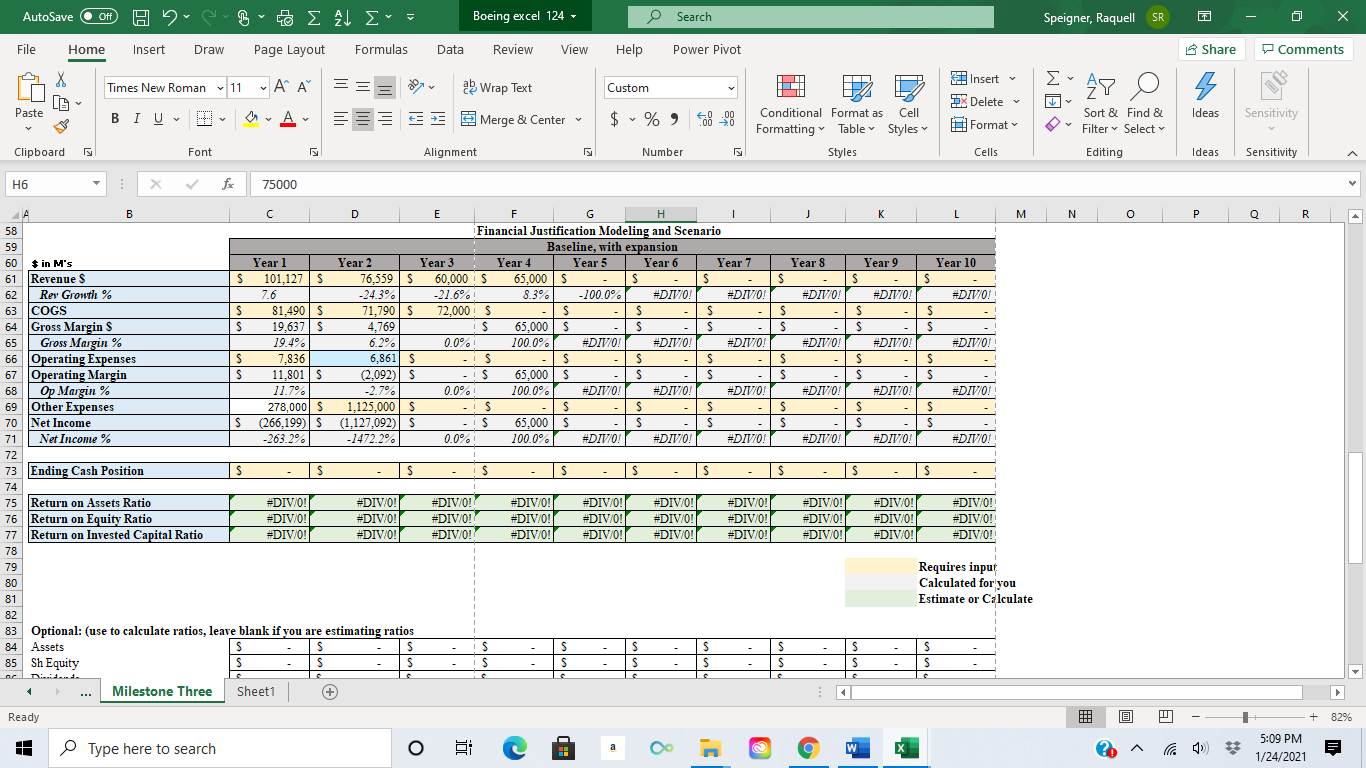
Question: Hello, I need help on the second excel sheet, its a10-year baseline projection. I started but I'm not sure if I'm on the right track
Hello, I need help on the second excel sheet, its a10-year baseline projection. I started but I'm not sure if I'm on the right track or not. Please advise, thanks in advance.
AutoSave O Off) Boeing excel 124 - O Search Speigner, Raquell SR X File Home Insert Draw Page Layout Formulas Data Review View Help Power Pivot Share Comments Times New Roman * 11 AA ag Wrap Text Percentage Insert Ex AY O Paste Delete ~ BIU - Merge & Center $ ~ % " 00 20 Conditional Format as Cell Sort & Find & Ideas Formatting Format Sensitivity Table Styles Filter * Select v Clipboard Font Alignment Number Styles Cells Editing Ideas Sensitivity E7 X V fic =(E6-D6)/D6 B C D E F G H I J K L M N O P Q R Place your company logo here Financial Justification Modeling and Scenario Baseline, without expansion $ in M's 2018 2019 2020 2021 2022 2023 2024 2025 2026 2027 Revenue S S 101,127 5 16,559 5 60,000 5.000 69,000 5 75,000 86,000 S 96,000 5 100,000 5 125,000 Rev Growth % 24.3% -21.6% 8.3% 10 0 12.5 15.0 20.0 21.1 3.0 Co COGS S 31,490 S 71,790 5 61,559 5 62,000 i s 64,000 S 71,000 S 83,000 S 95,000 S 82,000 5 37,000 Gross Margin S 9,637 5 4, 769 5 (1,559) $ 3,000 i s 5,000 5 1,000 $ 3,000 S 1,000 5 18,000 5 $8.000 Gross Margin % 19.4% 5.2% -2.6% 4.6% 7.2% 5.3% 3.5% 1.0% 18.0% 30.4% 11 Operating Expenses S 1.836 6,861 5 6,300 5 5,000 i s 3,000 $ 5,000 S 5,500 5 ,000 S 7,500 5 8.800 12 Operating Margin 11,801 S 2.092) (7,859) S (3,000) i S 2,000 5 (1,000) S (2,500) S 6,000) S 10,500 5 29,200 13 Op Margin % 11.7% 2.7% -13.1% 4.6% 2.9% 1.3% -2.9% 6.3% 10.5% 23.4% 14 Other Expenses 278,000 S 1,125,000 $ 1,200,000 | $ 1,300,000 | $ 1,380,000 | $ 1,399,000 | $ 1,500,000 $ 2,000,000 5 3,500,000 5 4,000,000 15 Net Income S 266,199) S (1,127,092) 5 (1,207,859) S(1,303,000) / S(1,378,000) | $(1,400,000) | $ (1,502,500) | $ (2,006,000) | S(3,489,500) | $ (3,970,800) 16 Net Income % 263.2% -1472.2% -2013.19% -2004.6% -1997.19% -1866.7% -1747.1% -2089.6% -3489.5% -3176.6% 17 18 Ending Cash Position S S S S 19 20 Return on Assets Ratio #DIV/O! #DIV/O! #DIV/O! #DIV/O! #DIV/O! #DIV/O! #DIV/O! #DIV/O! #DIV/O! #DIV/O! Return on Equity Ratio #DIV/O! #DIV/O! #DIV/O! #DIV/O! #DIV/O! #DIV/O! #DIV/O! #DIV/0 #DIV/O! #DIV/O! 22 Return on Invested Capital Ratio #DIV/O! #DIV/O! #DIV/O! #DIV/O! #DIV/O! #DIV/O! #DIV/O! #DIV/O! #DIV/O! #DIV/O! 23 24 Requires input 25 Calculated for you 26 Estimate or Calculate 27 28 Optional: (use to calculate ratios, leave blank if you are estimating ratios . .. Milestone Three Sheet1 + Ready Count: 41 + 82% Type here to search O Com W 5:04 PM 1/24/2021AutoSave O Off) Boeing excel 124 - O Search Speigner, Raquell SR X File Home Insert Draw Page Layout Formulas Data Review View Help Power Pivot Share Comments LO Times New Roman * 11 AA ab Wrap Text Custom Insert Ex AY O Paste BIU~ Delete ~ CEE Merge & Center $ ~ % " Conditional Format as Cell Sort & Find & Format Ideas Sensitivity Formatting Table Styles ~ Filter * Selectv Clipboard Font Alignment Number Styles Cells Editing Ideas Sensitivity HE X V fc 75000 C D E F G H 58 J K L M N O P Q R Financial Justification Modeling and Scenario 59 60 Baseline, with expansion $ in M's Year 1 Year 2 Year 3 Year 4 Year 5 61 Revenue $ Year 6 Year 7 Year 8 S Year 9 101,127 S 6,559 5 Year 10 60,000 i s 65,000 S S Rev Growth % S S S 76 24.3% -21.6% 8.3% -100.0% #DIVOr #DIVO! COGS #DIVON #DIVOr S 81,490 S 71,790 5 72,000 / S S S 64 |Gross Margin S 19,637 5 S 4,769 S 65,000 65 Gross Margin % 19.4%% 6.2% 20% 100.0% DIV70! #DIVOr 66 Operating Expenses DIVOr S 7,836 6,861 5 DIZOr IS 67 Operating Margin S S 11,801 S (2,092) S S - is 65,000 68 Op Margin % 11.7% 2.79% 20% 1 100.0% DIV70! #DIVOr #DIVO! 69 Other Expenses #DIVON 278,000 S DIVOr 1,125,000 S is S S 70 Net Income S (266,199) S (1,127,092) S - is 65,000 S 71 S S Net Income % 263.2% -1472.2% 20% i 100.0% #DIVO! #DIVIO! #DIVO! 72 #DIVO! #DIV/O! #DIVOF 73 Ending Cash Position S S is 74 S - s S 75 Return on Assets Ratio #DIV/O! #DIV/O! #DIV/O! #DIV/O! #DIV/O! #DIV/O! 76 #DIV/O! Return on Equity Ratio #DIV/O! #DIV/O! #DIV/O! #DIV/O! #DIV/O! #DIV/O! #DIV/O! #DIV/O! #DIV/O! #DIV/O! Return on Invested Capital Ratio DIV/O! #DIV/O! #DIV/O! #DIV/O! #DIV/O! #DIV/O! DIV/O! #DIV/O! 78 #DIV/O! #DIV/O! #DIV/O! #DIV/O! #DIV/O! 79 80 Requires input 81 Calculated for you 82 Estimate or Calculate 83 Optional: (use to calculate ratios, leave blank if you are estimating ratios 84 Asset Sh Equity S 85 S S Milestone Three Sheet1 (+) Ready + 82% Type here to search O a Com W X 5:09 PM 1/24/2021