

Question: Hello, I need help. These are the numbers for spreadsheet 1 ... 3.09 2.73 2.58 2.68 2.84 2.68 2.64 2.62 2.35 2.72 2.63 2.77 2.72
Hello, I need help.
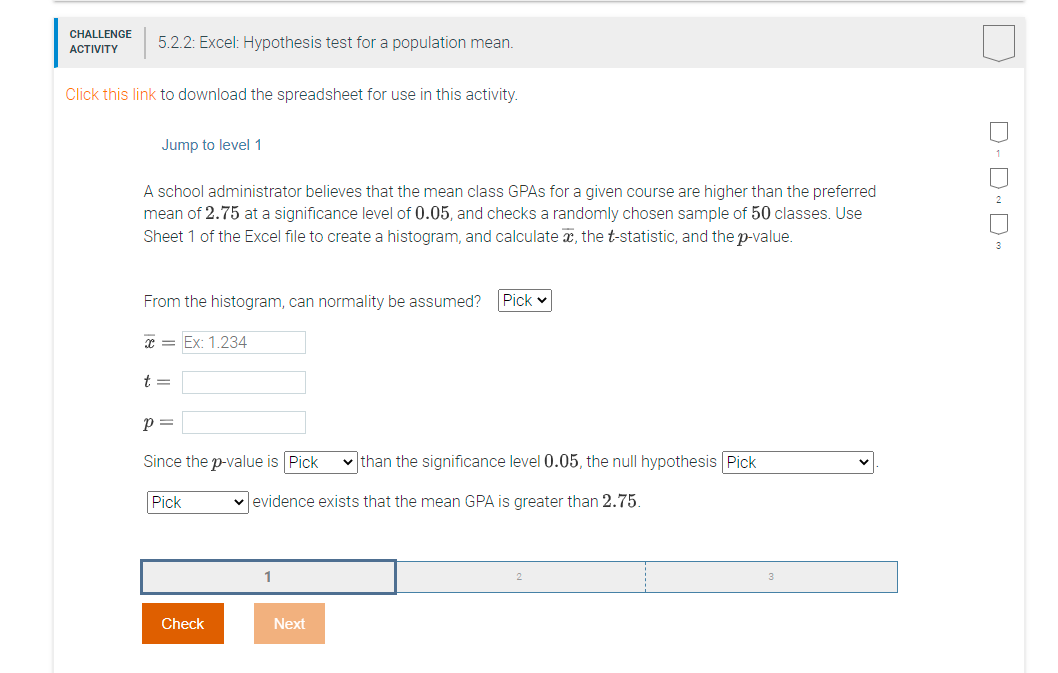
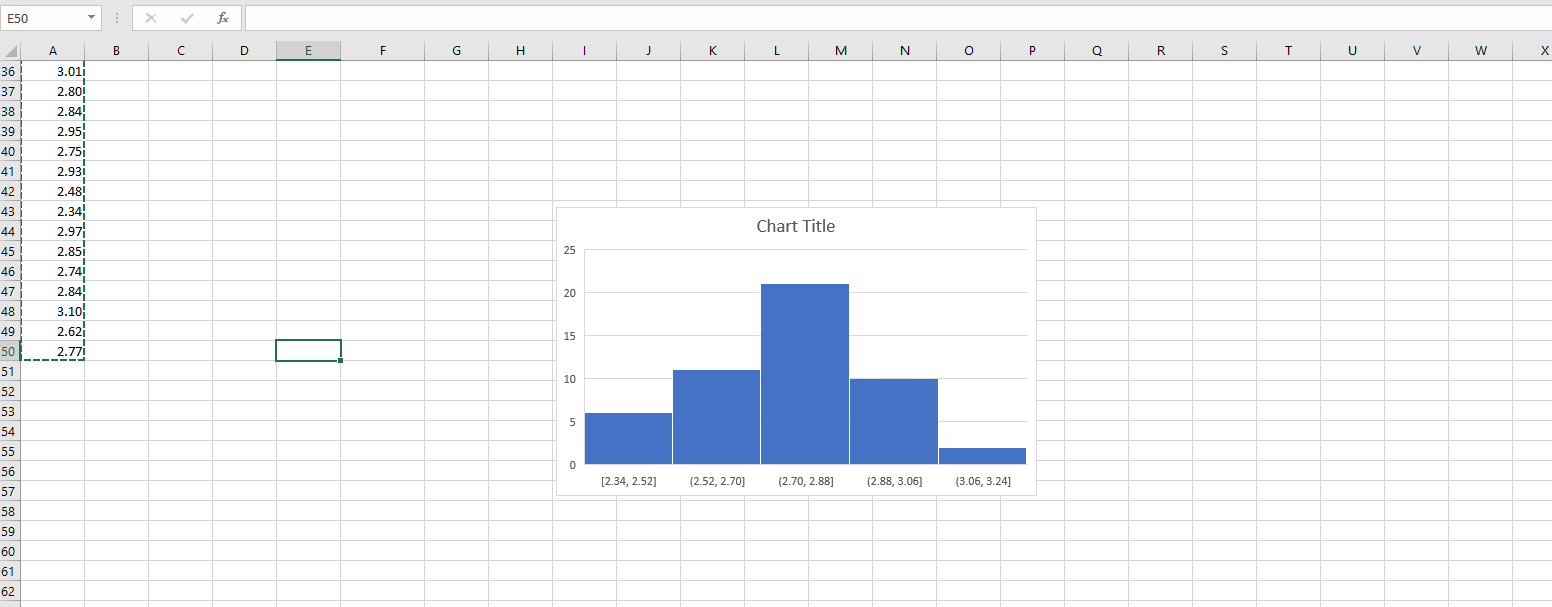
These are the numbers for spreadsheet 1 ... 3.09 2.73 2.58 2.68 2.84 2.68 2.64 2.62 2.35 2.72 2.63 2.77 2.72 3.03 2.71 2.96 2.74 3.01 2.88 2.68 2.83 3.02 2.83 2.71 2.67 2.79 2.65 2.56 2.78 2.89 2.40 2.38 2.41 2.83 2.86 3.01 2.80 2.84 2.95 2.75 2.93 2.48 2.34 2.97 2.85 2.74 2.84 3.10 2.62 2.77 .. I made into histogram attached.
The drop down options are From the histogram, can normality be assumed? yes or no
p value greater or less
hypothesis fails to be rejected or is rejected
and sufficient or insufficient
\f\f
Step by Step Solution
There are 3 Steps involved in it
1 Expert Approved Answer
Step: 1 Unlock

Question Has Been Solved by an Expert!
Get step-by-step solutions from verified subject matter experts
Step: 2 Unlock
Step: 3 Unlock