

Question: Hello I need help with putting this data think the graph. f1. 900 800 700 600 500 Mean RT (ms) 400 300 200 100 Baseline
Hello I need help with putting this data think the graph.
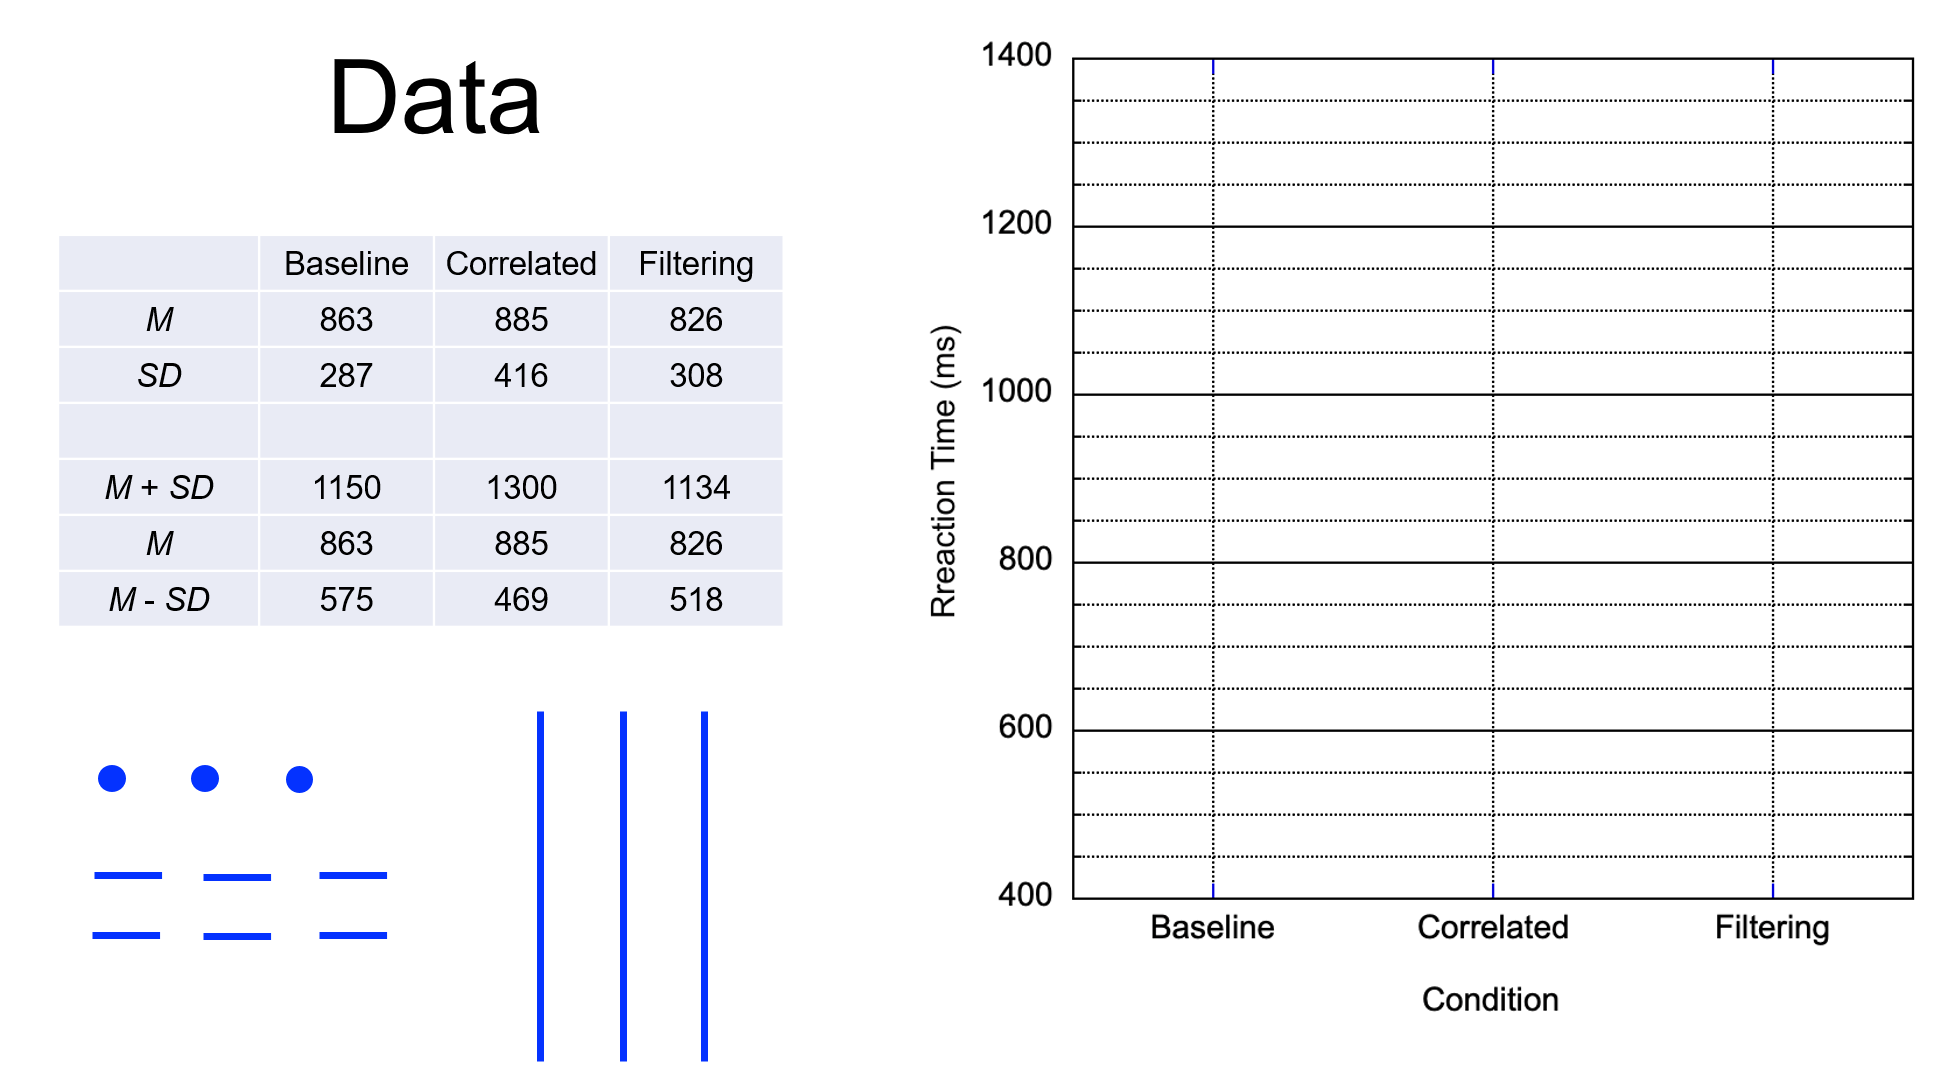
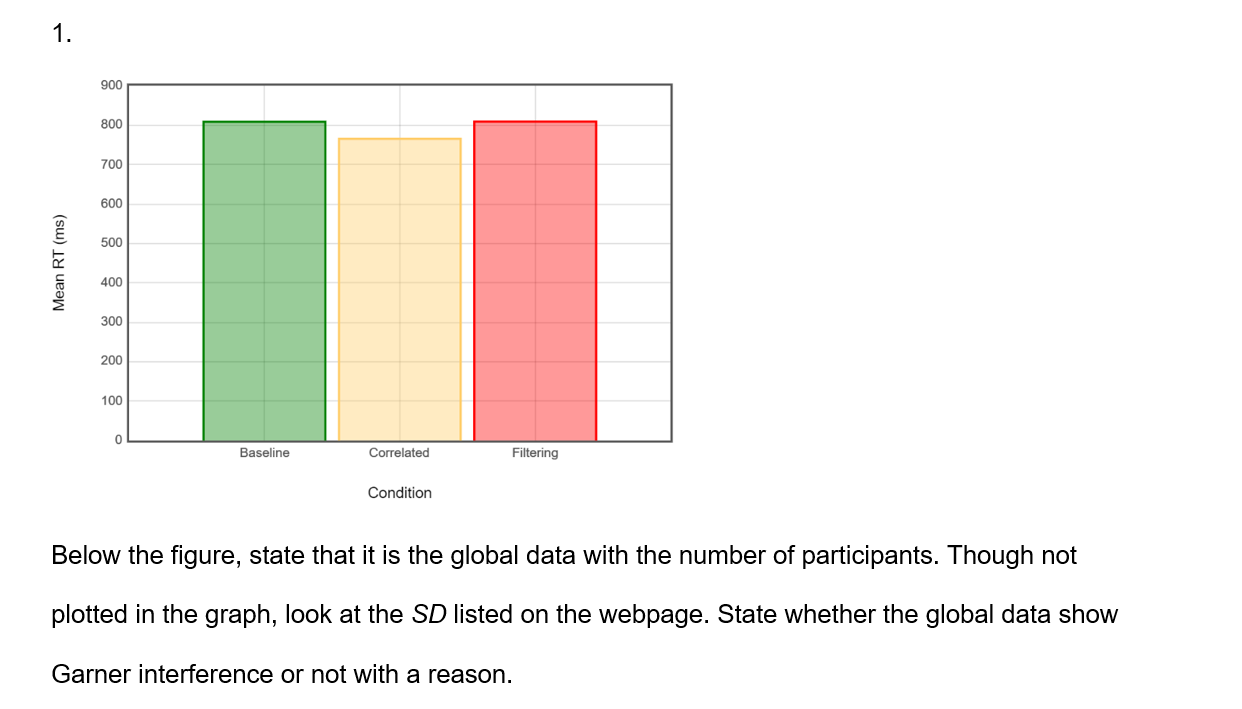
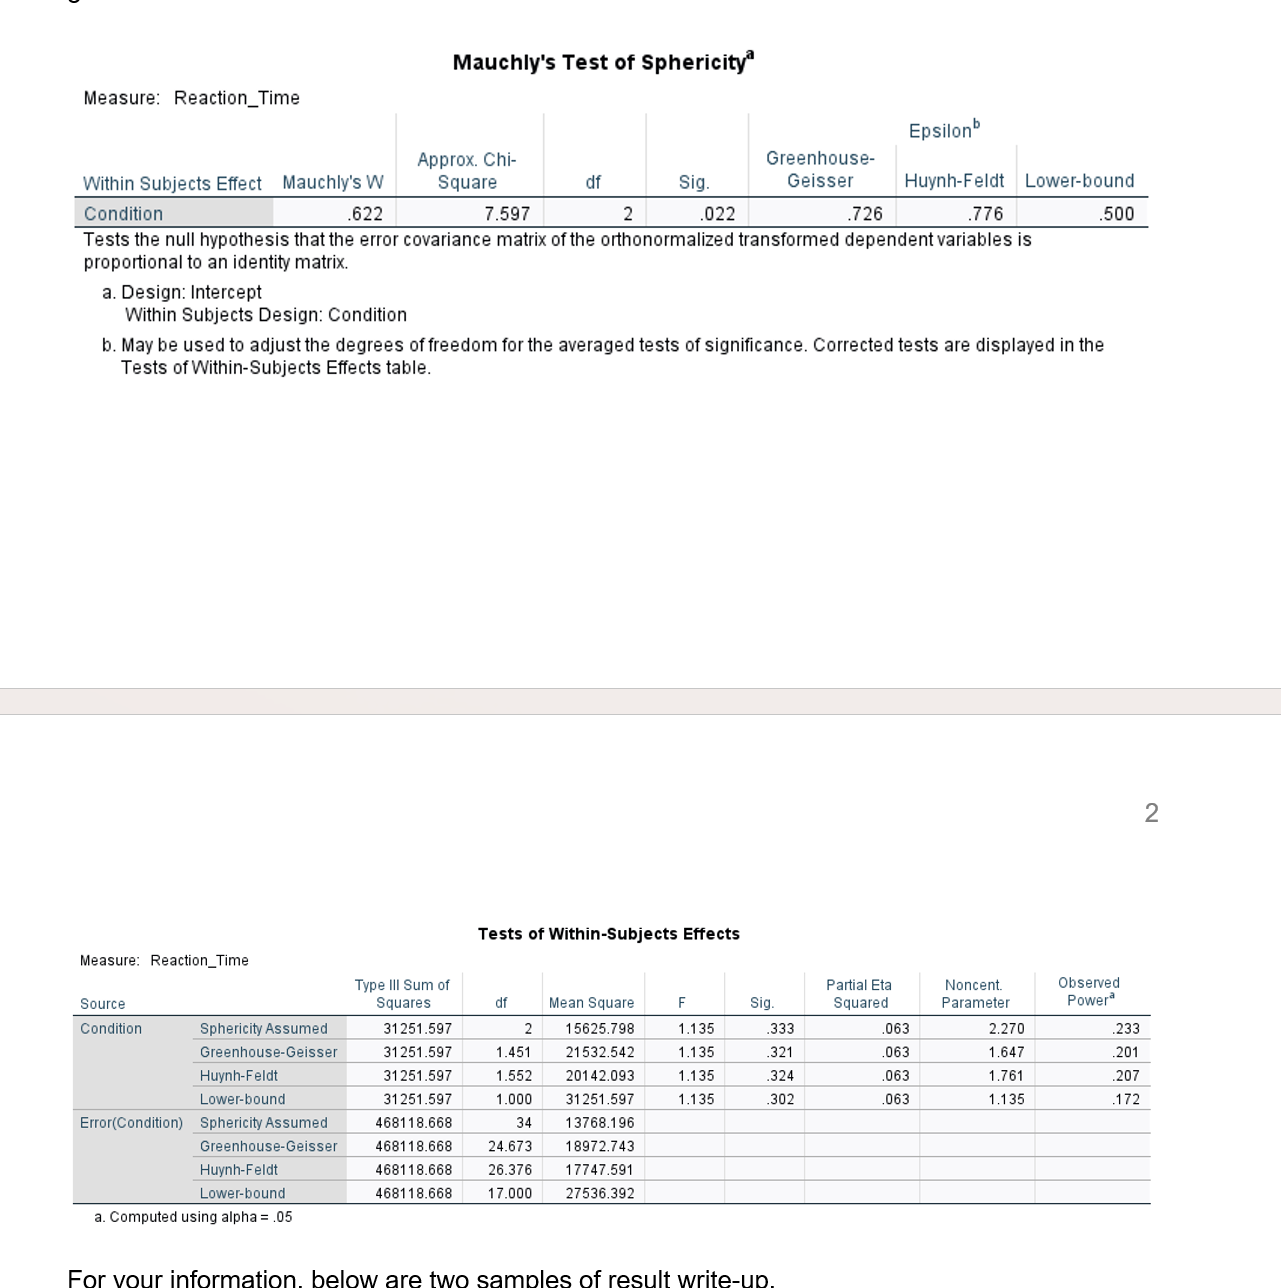
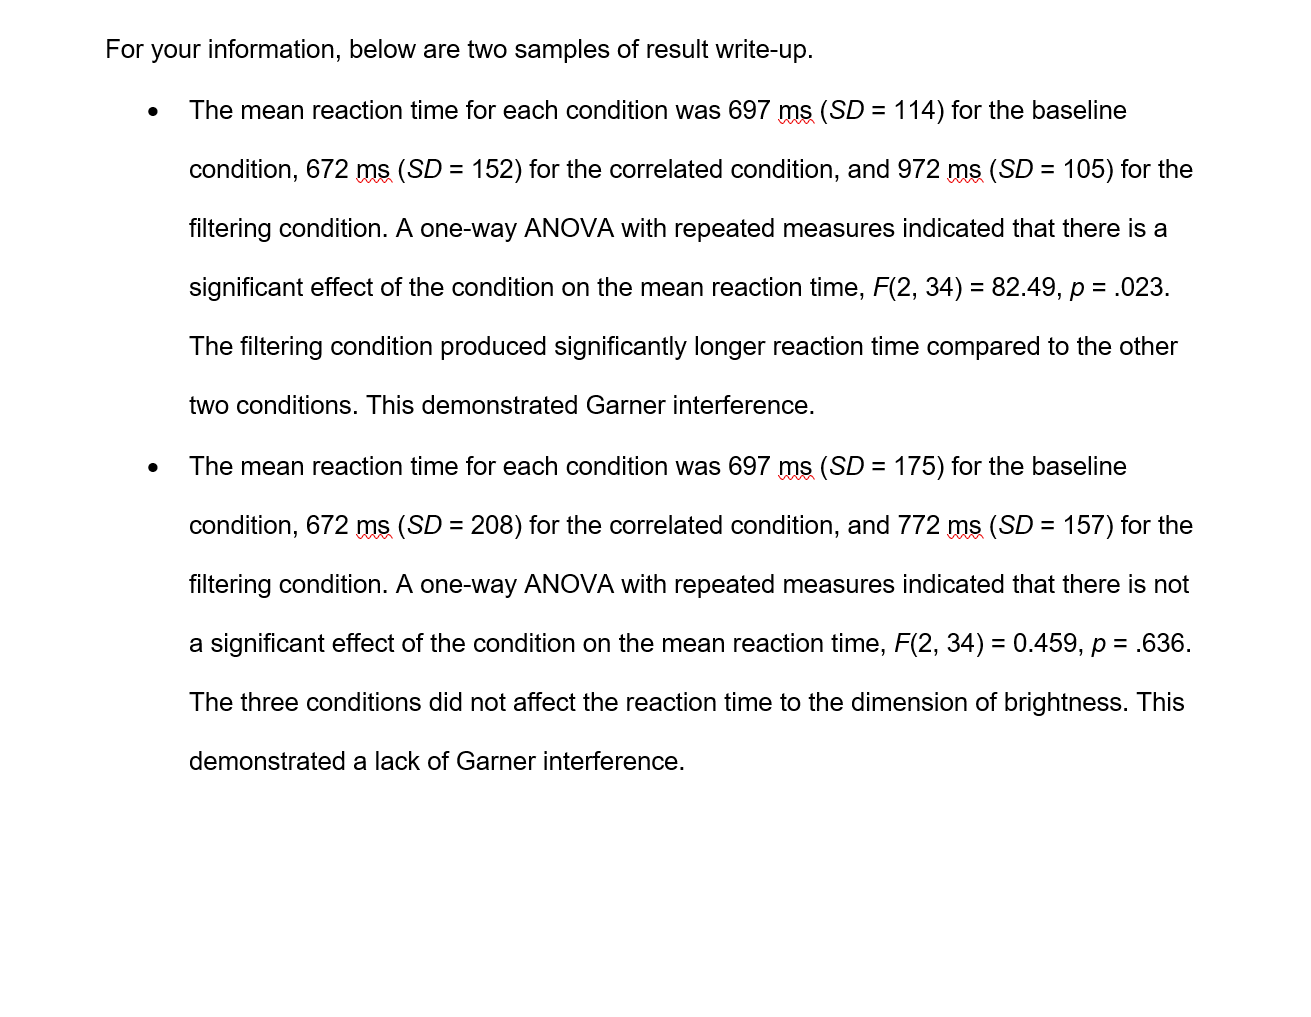
\f1. 900 800 700 600 500 Mean RT (ms) 400 300 200 100 Baseline Correlated Filtering Condition Below the figure, state that it is the global data with the number of participants. Though not plotted in the graph, look at the SD listed on the webpage. State whether the global data show Garner interference or not with a reason.Mauchly's Test of Sphericity" Measure: Reaction_Time Epsilon Approx. Chi- Greenhouse- Within Subjects Effect Mauchly's W Square df Sig. Geisser Huynh-Feldt Lower-bound Condition 622 7.597 2 022 .726 776 500 Tests the null hypothesis that the error covariance matrix of the orthonormalized transformed dependent variables is proportional to an identity matrix a. Design: Intercept Within Subjects Design: Condition b. May be used to adjust the degrees of freedom for the averaged tests of significance. Corrected tests are displayed in the ubjects Ef 2 Tests of Within-Subjects Effects Measure: Reaction_Time Type Ill Sum of Partial Eta Noncent. Observed Source Squares df Mean Square Sig. Squared Parameter Powera Condition Sphericity Assumed 31251.597 5625.798 1.135 .333 063 2.270 .233 Greenhouse-Geisser 31251.597 1.451 21532.542 .135 321 063 1.647 201 Huynh-Feld 31251.597 1.552 20142.093 .135 .324 063 1.761 207 Lower-bound 31251.597 1.000 31251.597 1.135 302 063 1.135 172 Error(Condition) Sphericity Assumed 468118.668 34 13768.196 Greenhouse-Geisser 468118.668 24.673 18972.743 Huynh-Feld 468118.668 26.376 17747.59 Lower-bound 468118.668 17.000 27536.392 a. Computed using alpha = .05 FoFor your information, below are two samples of result write-up. The mean reaction time for each condition was 697 ms (SD = 114) for the baseline condition, 672 ms (SD = 152) for the correlated condition, and 972 ms, (SD = 105) for the filtering condition. A one-way ANOVA with repeated measures indicated that there is a significant effect of the condition on the mean reaction time, F(2, 34) = 82.49, p = .023. The filtering condition produced significantly longer reaction time compared to the other two conditions. This demonstrated Garner interference. The mean reaction time for each condition was 697 ms (SD = 175) for the baseline condition, 672 ms (SD = 208) for the correlated condition, and 772 ms, (SD = 157) for the filtering condition. A one-way ANOVA with repeated measures indicated that there is not a significant effect of the condition on the mean reaction time, F(2, 34) = 0.459, p = .636. The three conditions did not affect the reaction time to the dimension of brightness. This demonstrated a lack of Garner interference
Step by Step Solution
There are 3 Steps involved in it

Get step-by-step solutions from verified subject matter experts