Question: Hello i need help with Q4 please and thank you i need to get this filled out, but i am confused. Attached below is the
Hello i need help with Q4 please and thank you i need to get this filled out, but i am confused. Attached below is the relevant information needed thank you
Instructions needed
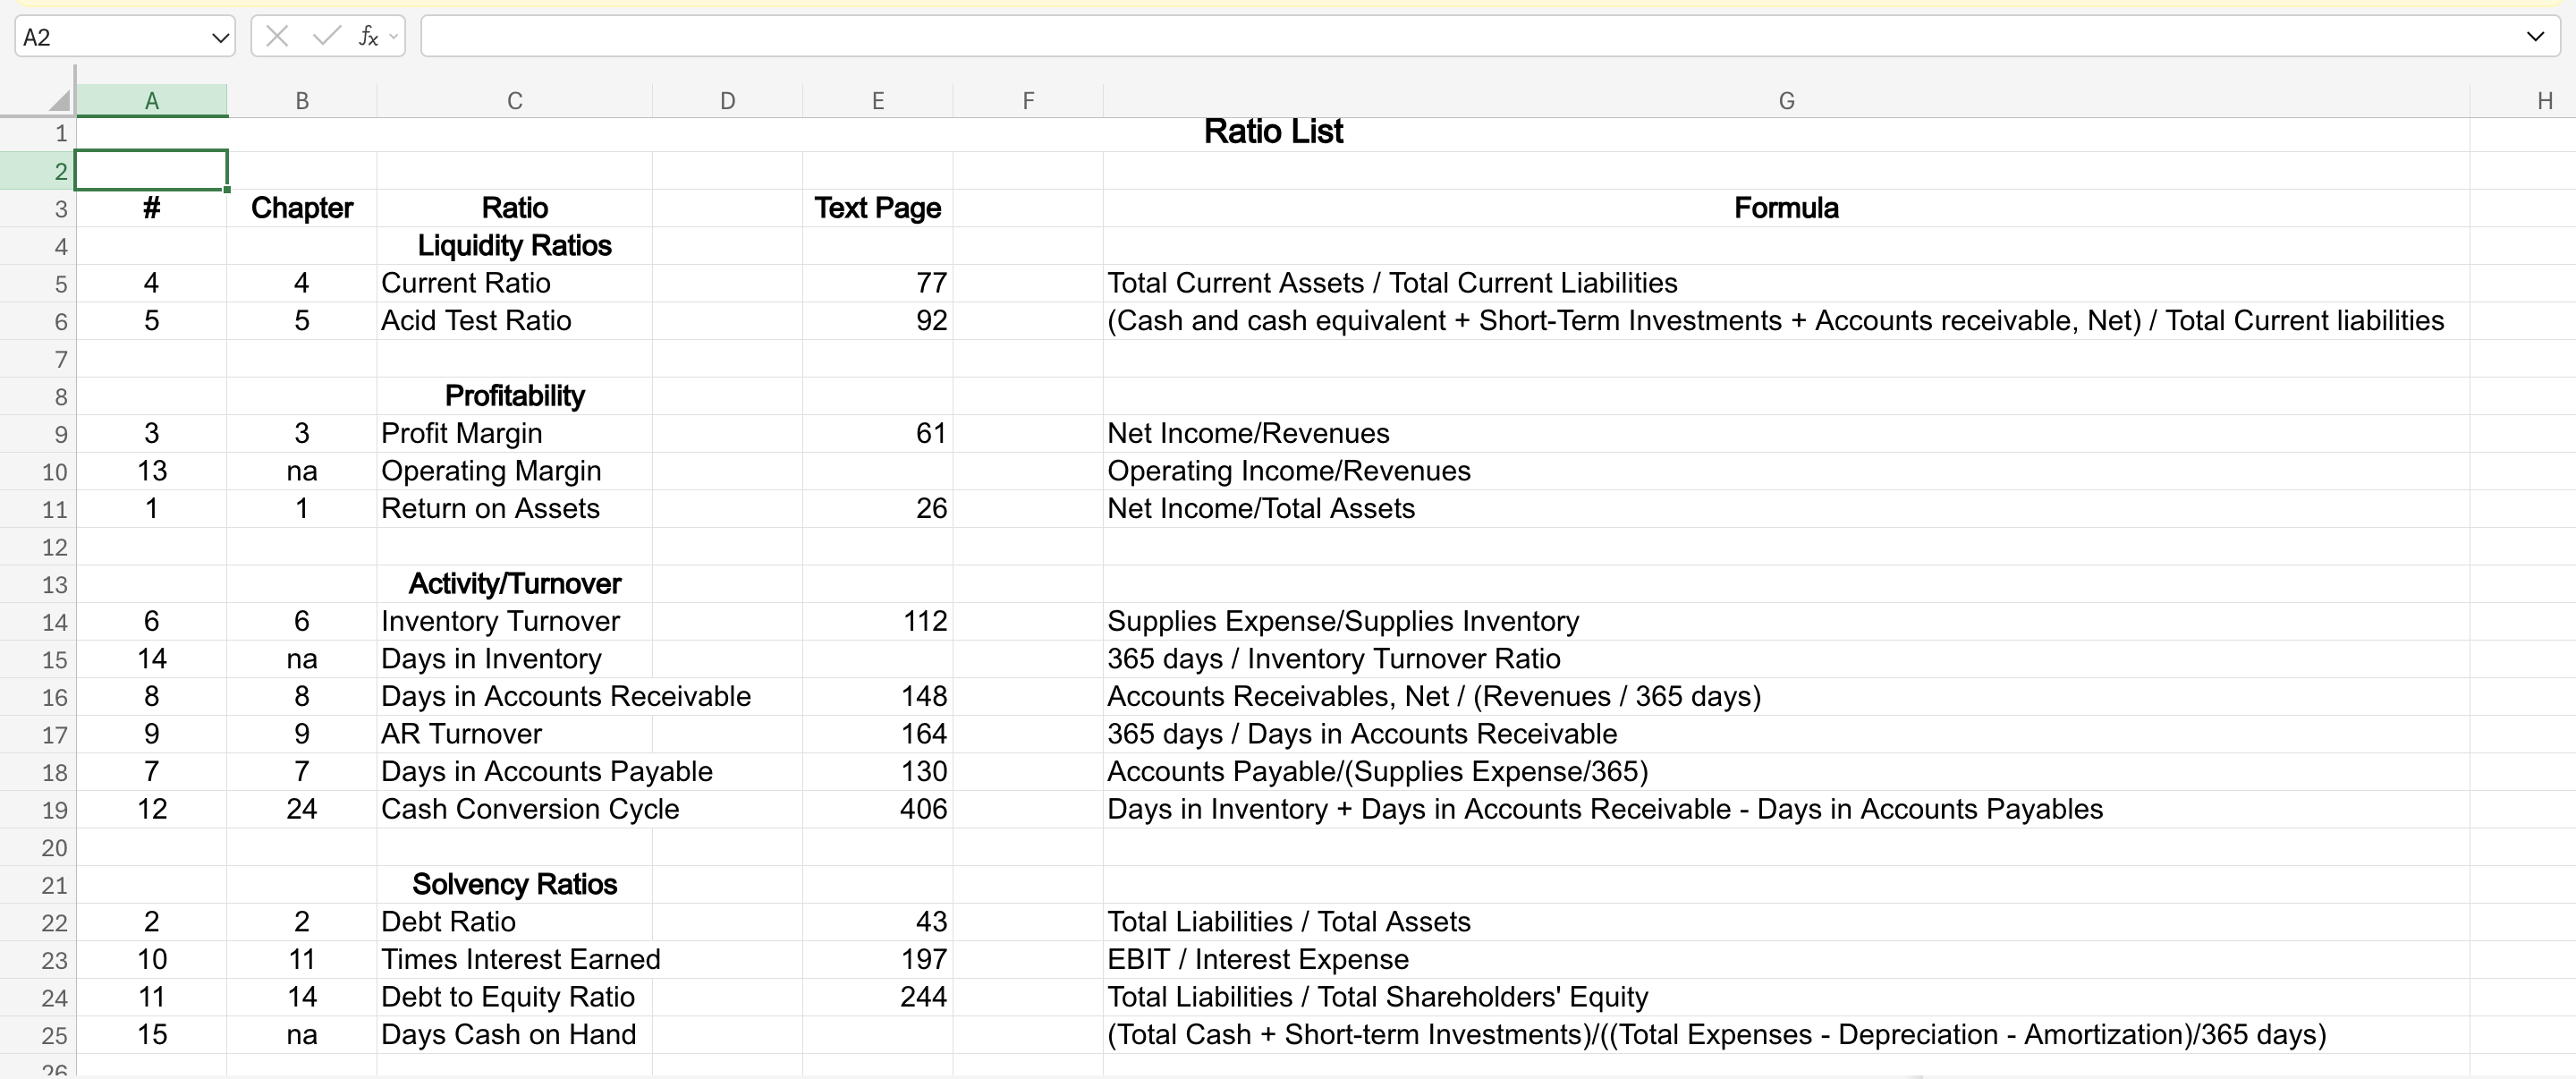
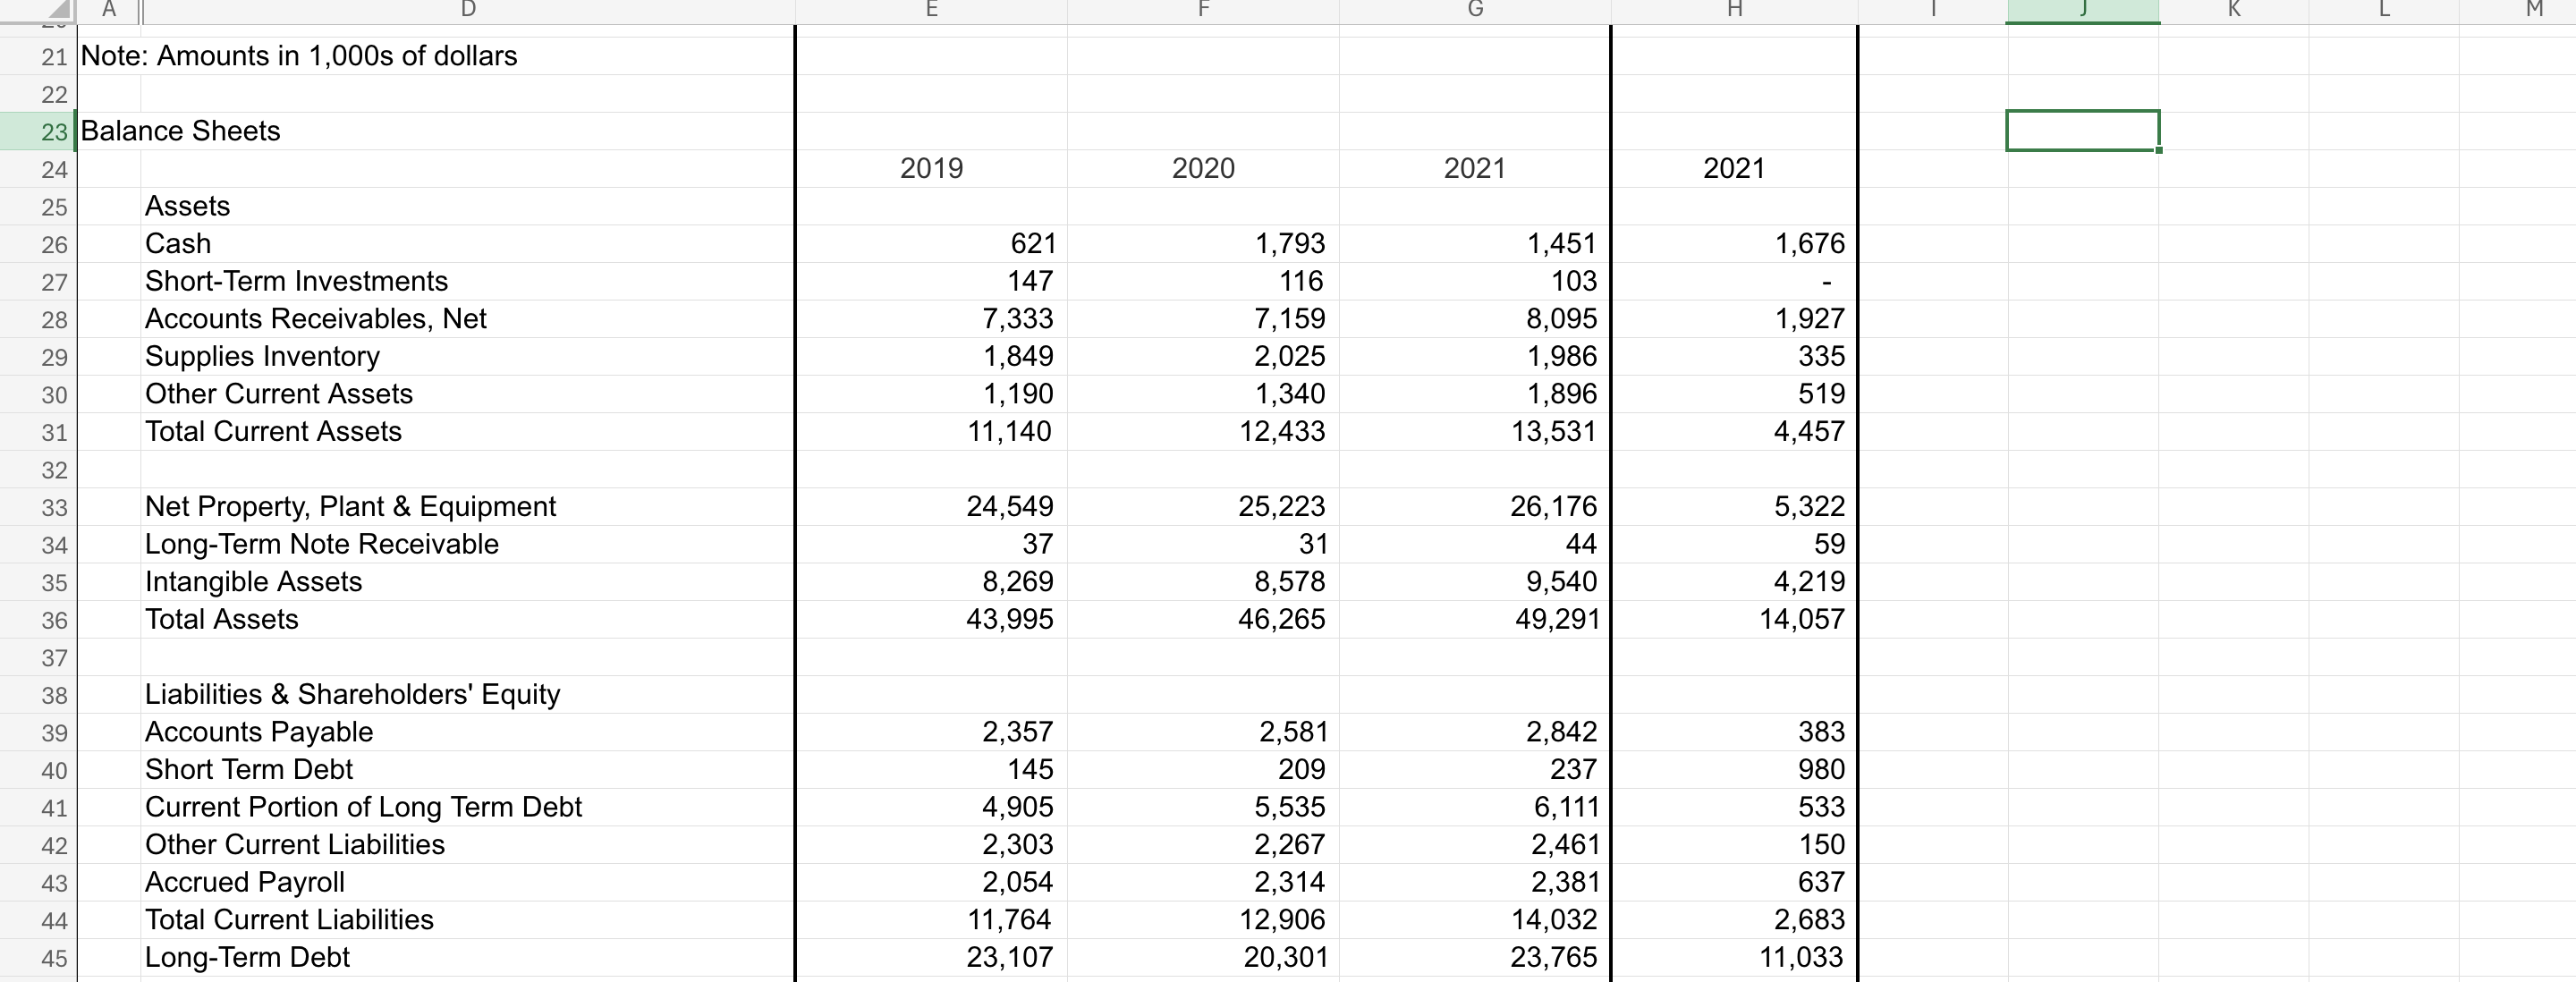
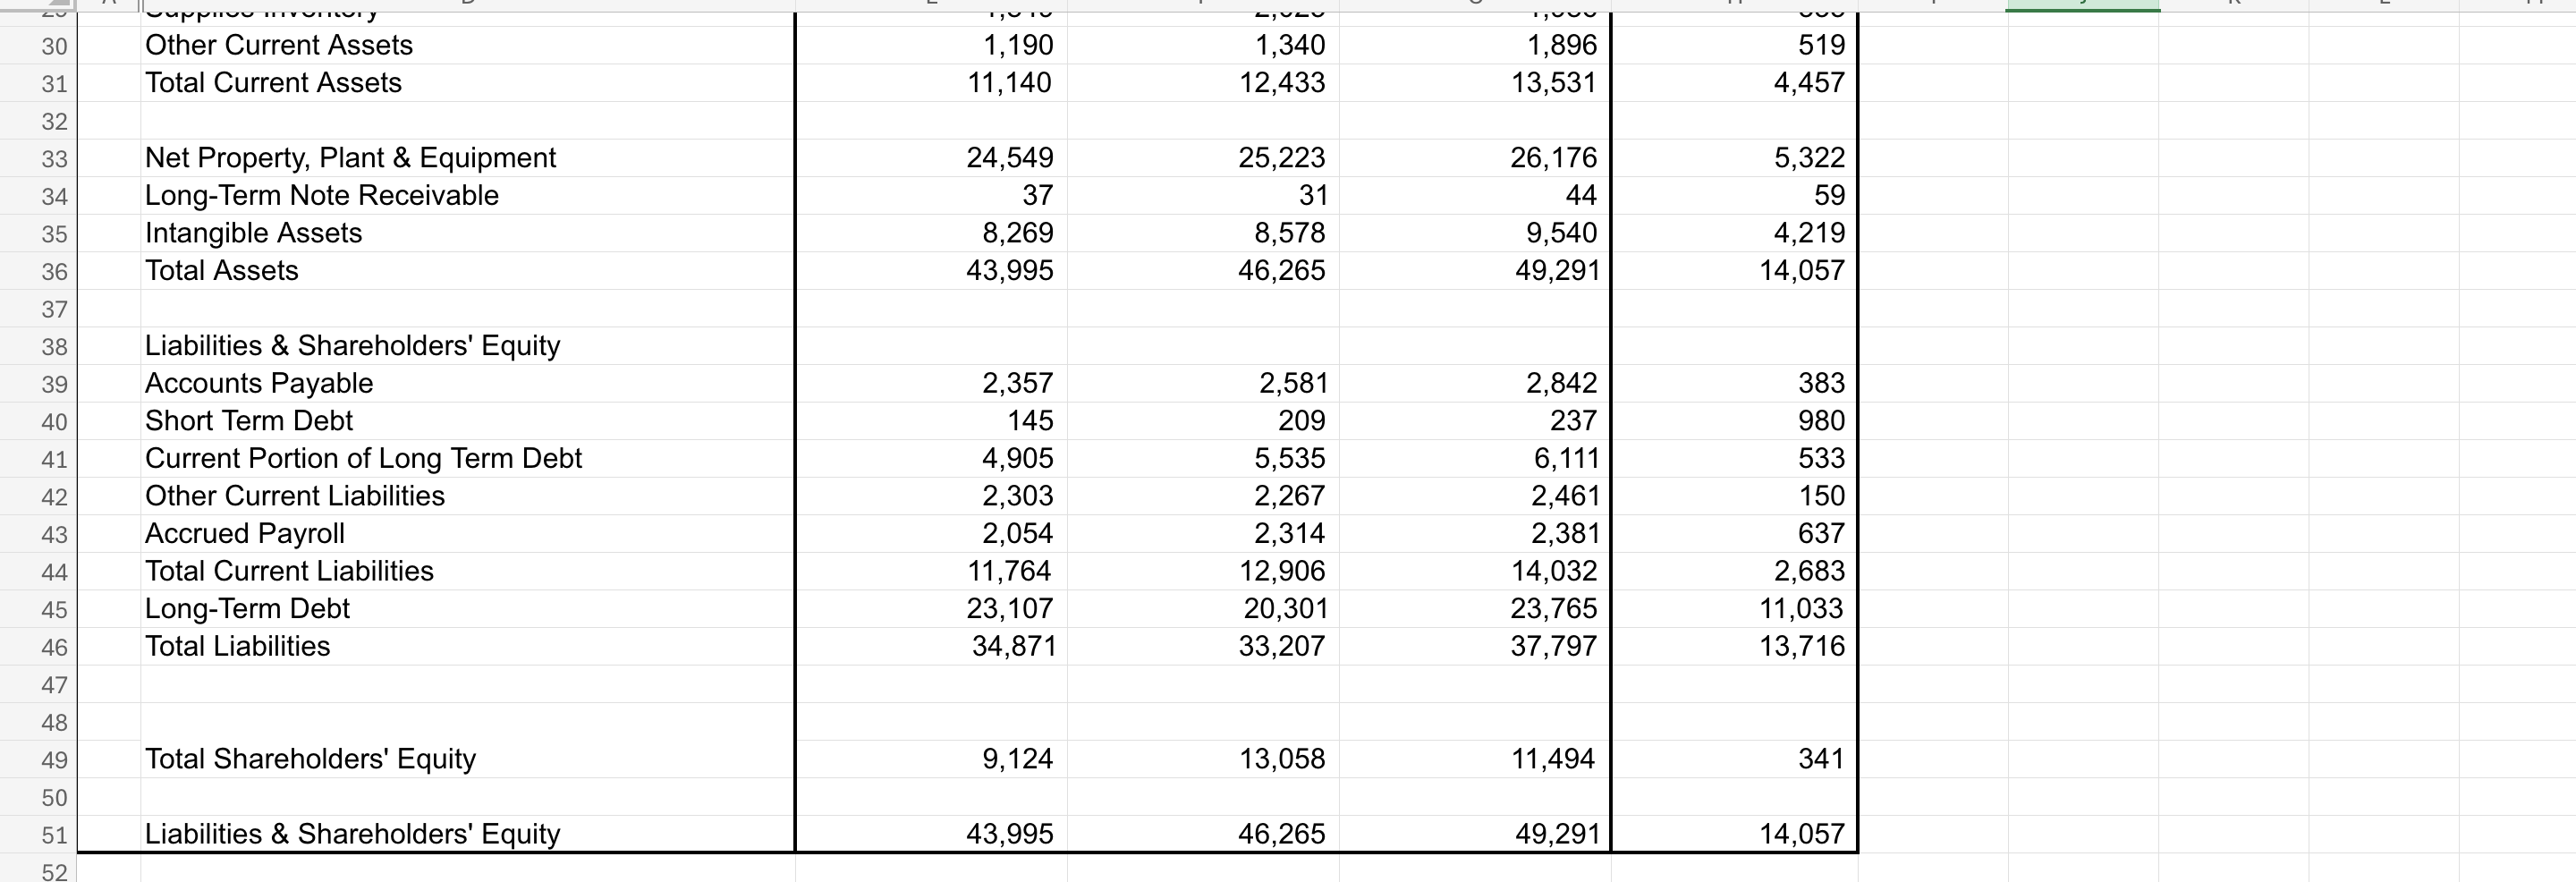
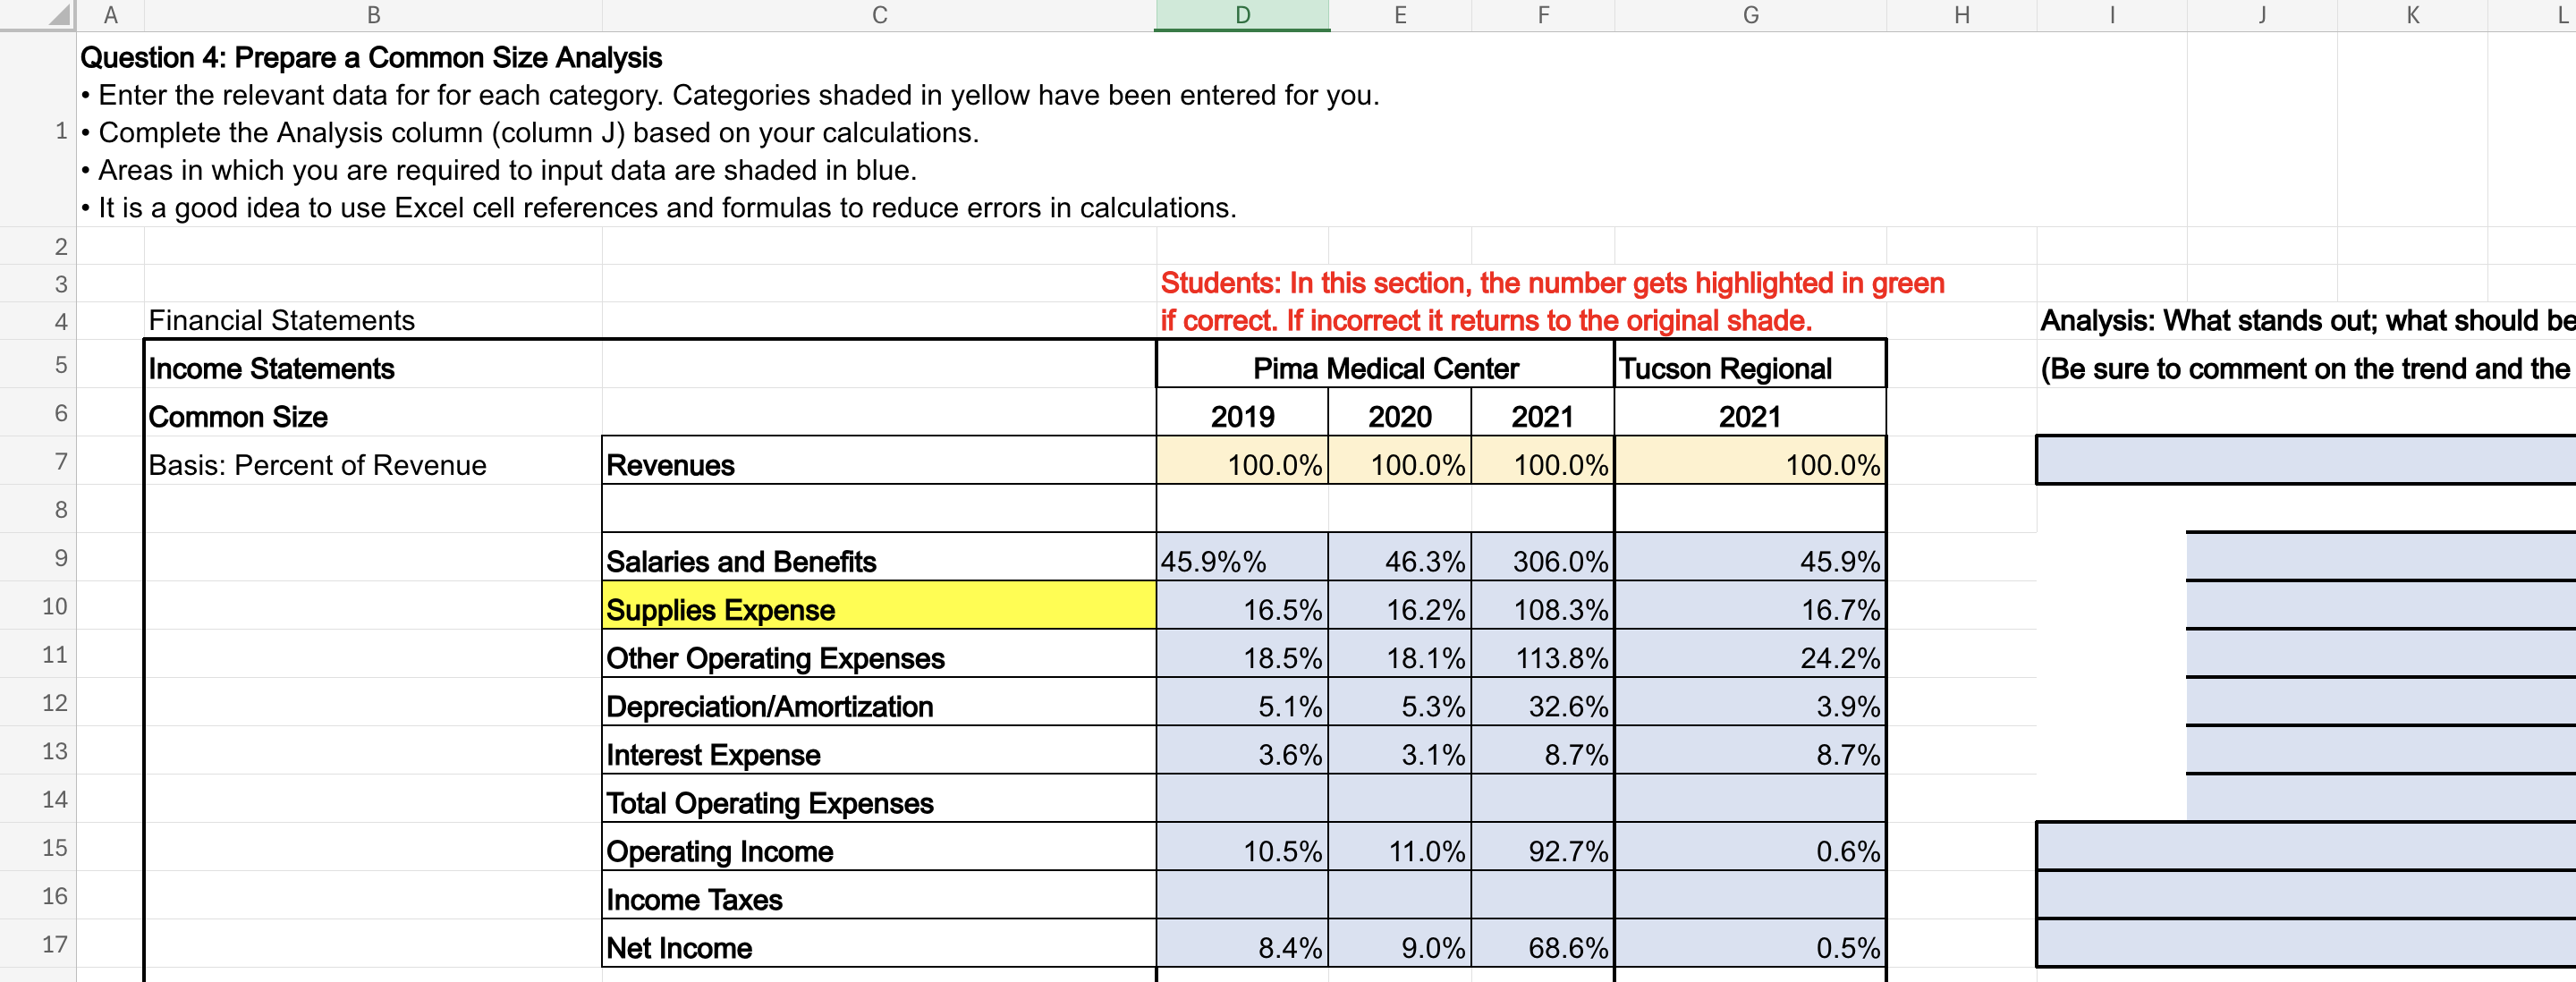
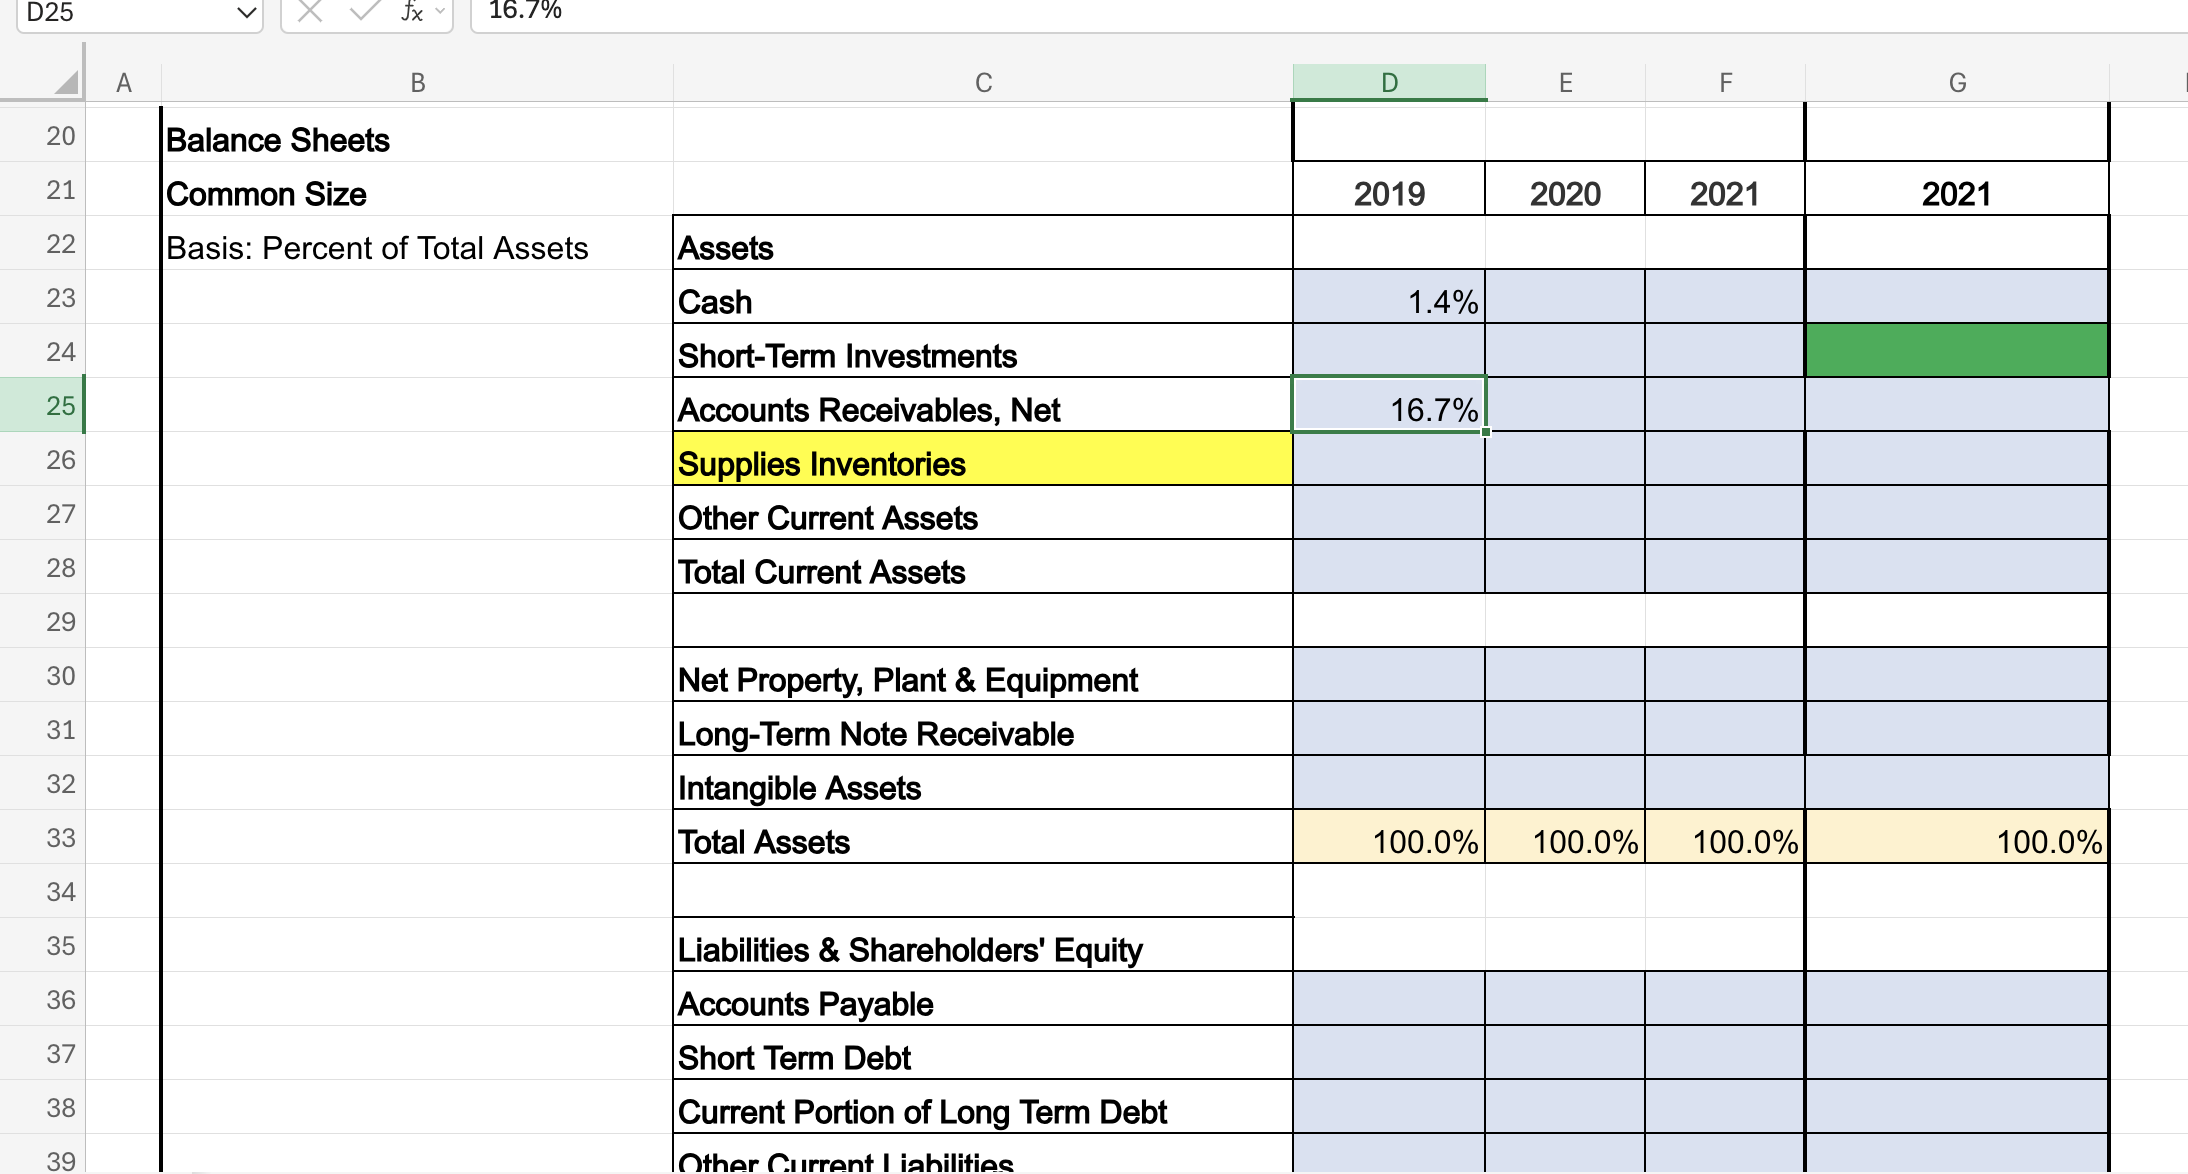
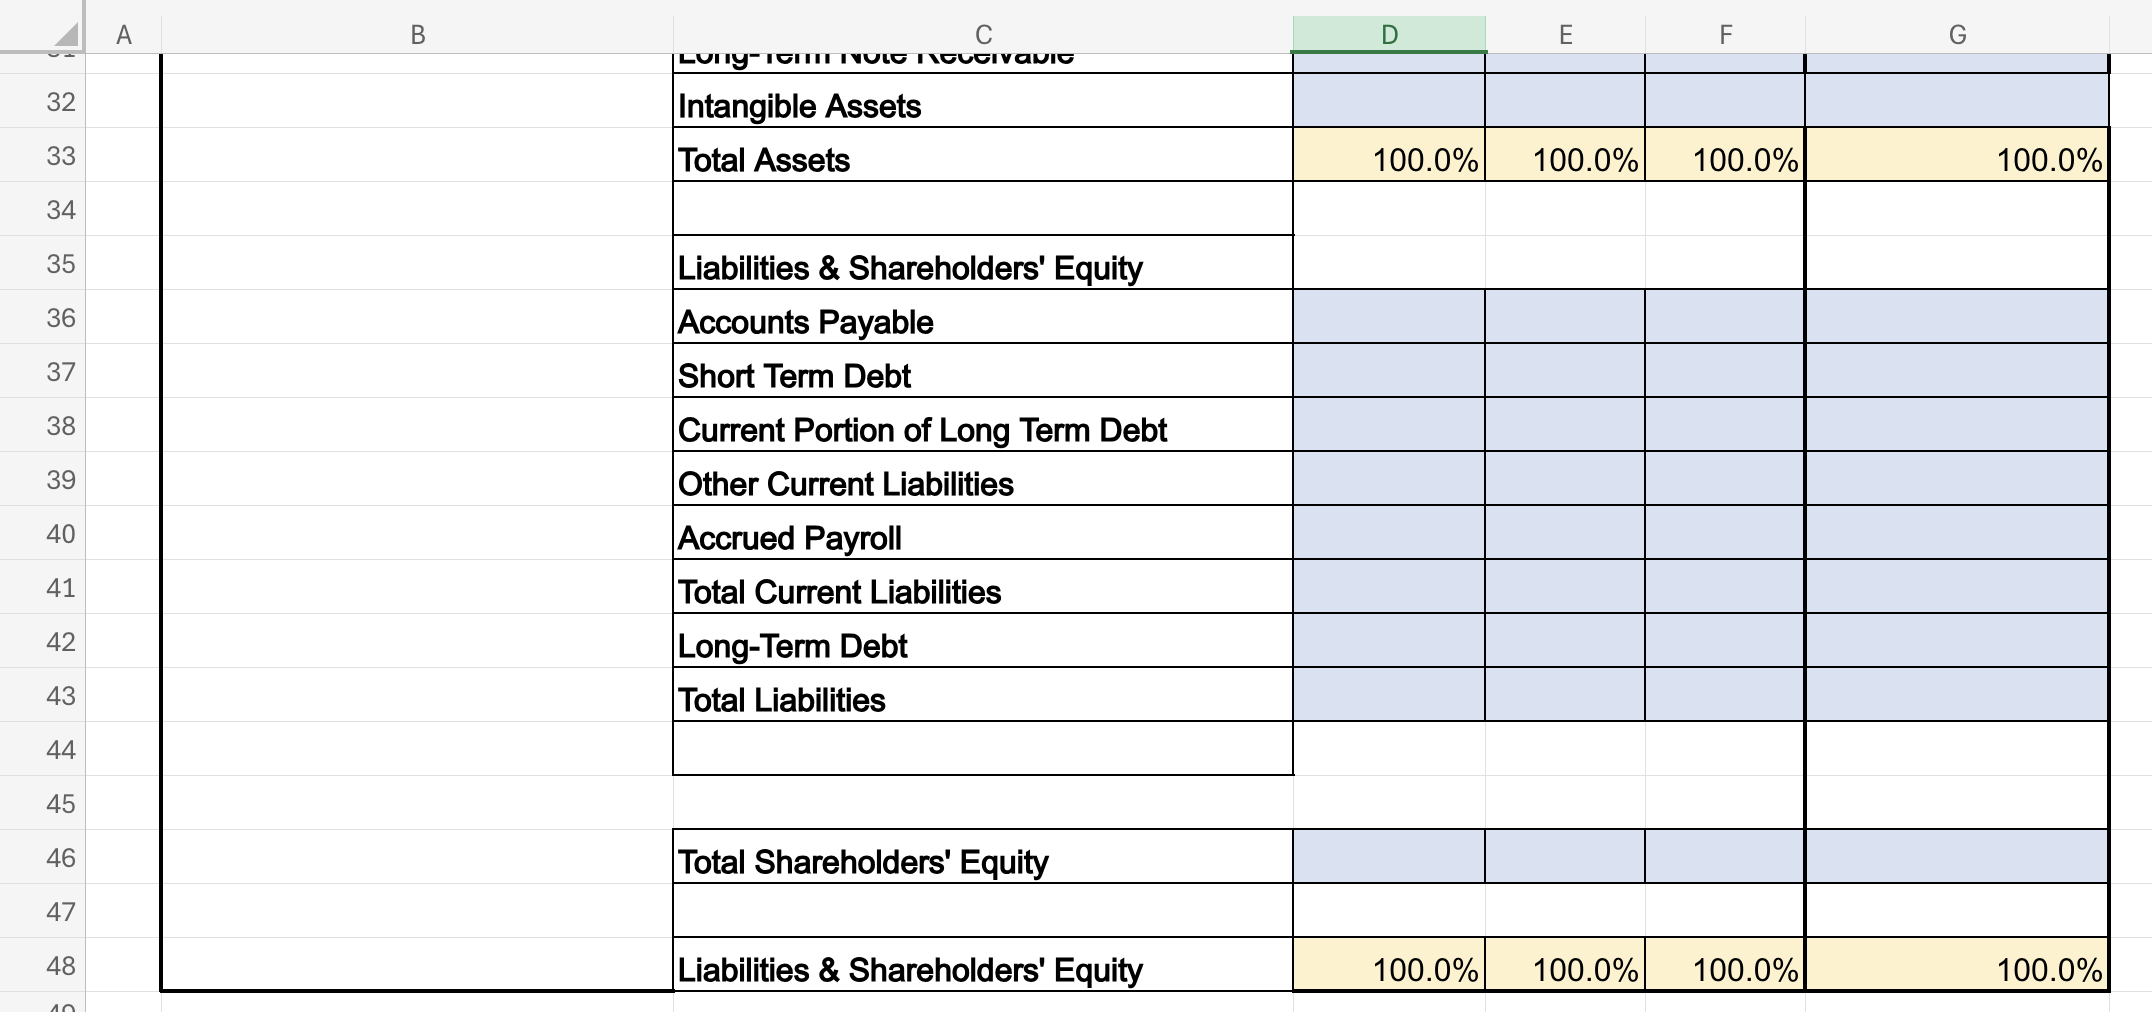
A2 OONRARWON HB 10 di 12 13 14 15 16 17, 18 19 20 2) 22) 23 24 25 8 # 10 11 15 1 Chapter na @ 24 11 14 na i Ratio Liquidity Ratios Current Ratio Acid Test Ratio Profitability Profit Margin Operating Margin Return on Assets Activity/Turnover Inventory Turnover Days in Inventory Days in Accounts Receivable AR Turnover Days in Accounts Payable Cash Conversion Cycle Solvency Ratios Debt Ratio Times Interest Earned Debt to Equity Ratio Days Cash on Hand Text Page 77 92 61 26 112 148 164 130 406 43 197 244 Ratio List Formula Total Current Assets / Total Current Liabilities (Cash and cash equivalent + Short-Term Investments + Accounts receivable, Net) / Total Current liabilities Net Income/Revenues Operating Income/Revenues Net Income/Total Assets Supplies Expense/Supplies Inventory 365 days / Inventory Turnover Ratio Accounts Receivables, Net / (Revenues / 365 days) 365 days / Days in Accounts Receivable Accounts Payable/(Supplies Expense/365) Days in Inventory + Days in Accounts Receivable - Days in Accounts Payables Total Liabilities / Total Assets EBIT / Interest Expense Total Liabilities / Total Shareholders' Equity (Total Cash + Short-term Investments)/((Total Expenses - Depreciation - Amortization)/365 days) 21) 22: 23 24 25 26 27 28 29 30 31 32 33 34 35 36 37 38 39 40 41 42 43 44 45 A |i D Note: Amounts in 1,000s of dollars Balance Sheets Assets Cash Short-Term Investments Accounts Receivables, Net Supplies Inventory Other Current Assets Total Current Assets Net Property, Plant & Equipment Long-Term Note Receivable Intangible Assets Total Assets Liabilities & Shareholders' Equity Accounts Payable Short Term Debt Current Portion of Long Term Debt Other Current Liabilities Accrued Payroll Total Current Liabilities Long-Term Debt 2019 621 147 7,333 1,849 1,190 11,140 24,549 37 8,269 43,995 2,357 145 4,905 2,303 2,054 11,764 23,107 2020 1,793 116 7,159 2,025 1,340 12,433 25,223 31 8,578 46,265 2,581 209 5,535 2,267 2,314 12,906 20,301 2021 1,451 103 8,095 1,986 1,896 13,531 26,176 44 9,540 49,291 2,842 237 6,111 2,461 2,381 14,032 23,765 2021 1,676 1,927 335 519 4,457 5,322 59 4,219 14,057 383 980 533 150 637 2,683 11,033 30 31 32 33 34 35 36 37 38 39 40 41 42 43 44 45 46 47 48 49 50 51 eppree nurnery Other Current Assets Total Current Assets Net Property, Plant & Equipment Long-Term Note Receivable Intangible Assets Total Assets Liabilities & Shareholders' Equity Accounts Payable Short Term Debt Current Portion of Long Term Debt Other Current Liabilities Accrued Payroll Total Current Liabilities Long-Term Debt Total Liabilities Total Shareholders' Equity Liabilities & Shareholders' Equity 1,190 11,140 24,549 37 8,269 43,995 2,357 145 4,905 2,303 2,054 11,764 23,107 34,871 9,124 43,995 1,340 12,433 25,223 31 8,578 46,265 2,581 209 5,535 2,267 2,314 12,906 20,301 33,207 13,058 46,265 1,896 13,531 26,176 44 9,540 49,291 2,842 237 6,111 2,461 2,381 14,032 23,765 37,797 11,494 49,291 519 4,457 5,322 59 4,219 14,057 383 980 533 150 637 2,683 11,033 13,716 341 14,057 A B C D E F G H K Question 4: Prepare a Common Size Analysis . Enter the relevant data for for each category. Categories shaded in yellow have been entered for you. 1 . Complete the Analysis column (column J) based on your calculations. . Areas in which you are required to input data are shaded in blue. . It is a good idea to use Excel cell references and formulas to reduce errors in calculations. W N Students: In this section, the number gets highlighted in green 4 Financial Statements if correct. If incorrect it returns to the original shade. Analysis: What stands out; what should be 5 Income Statements Pima Medical Center Tucson Regional (Be sure to comment on the trend and the 6 Common Size 2019 2020 2021 2021 7 Basis: Percent of Revenue Revenues 100.0% 100.0% 100.0% 100.0% 8 9 Salaries and Benefits 45.9%% 46.3% 306.0% 45.9% 10 Supplies Expense 16.5% 16.2% 108.3% 16.7% 11 Other Operating Expenses 18.5% 18.1% 113.8% 24.2% 12 Depreciation/Amortization 5.1% 5.3% 32.6% 3.9% 13 Interest Expense 3.6% 3.1% 8.7% 8.7% 14 Total Operating Expenses 15 Operating Income 10.5% 11.0% 92.7% 0.6% 16 Income Taxes 17 Net Income 8.4% 9.0% 68.6% 0.5%D25 20 21 22 23 24 25 26 27 28 29 30 31 32 33 34 35 36 37 38 39 v Je 16.7% B Balance Sheets Common Size Basis: Percent of Total Assets Assets Cash Short-Term Investments Accounts Receivables, Net Supplies Inventories Other Current Assets Total Current Assets Net Property, Plant & Equipment Long-Term Note Receivable Intangible Assets Total Assets Liabilities & Shareholders' Equity Accounts Payable Short Term Debt Current Portion of Long Term Debt Other Currant | iahilitias A B C D E F G Long-ICHIVULG ACUCIVAVIC 32 Intangible Assets 33 Total Assets 100.0% 100.0% 100.0% 100.0% 34 35 Liabilities & Shareholders' Equity 36 Accounts Payable 37 Short Term Debt 38 Current Portion of Long Term Debt 39 Other Current Liabilities 40 Accrued Payroll 41 Total Current Liabilities 42 Long-Term Debt 43 Total Liabilities 44 45 46 Total Shareholders' Equity 47 48 Liabilities & Shareholders' Equity 100.0% 100.0% 100.0% 100.0%
Step by Step Solution
There are 3 Steps involved in it
1 Expert Approved Answer
Step: 1 Unlock
Question Has Been Solved by an Expert!
Get step-by-step solutions from verified subject matter experts
Step: 2 Unlock
Step: 3 Unlock
Students Have Also Explored These Related Accounting Questions!