

Question: hello i need help with these questions please based on statistics question 2- E) Complete parts (a) through (e) for the population data below. 3,
hello i need help with these questions please based on statistics
question 2- E)
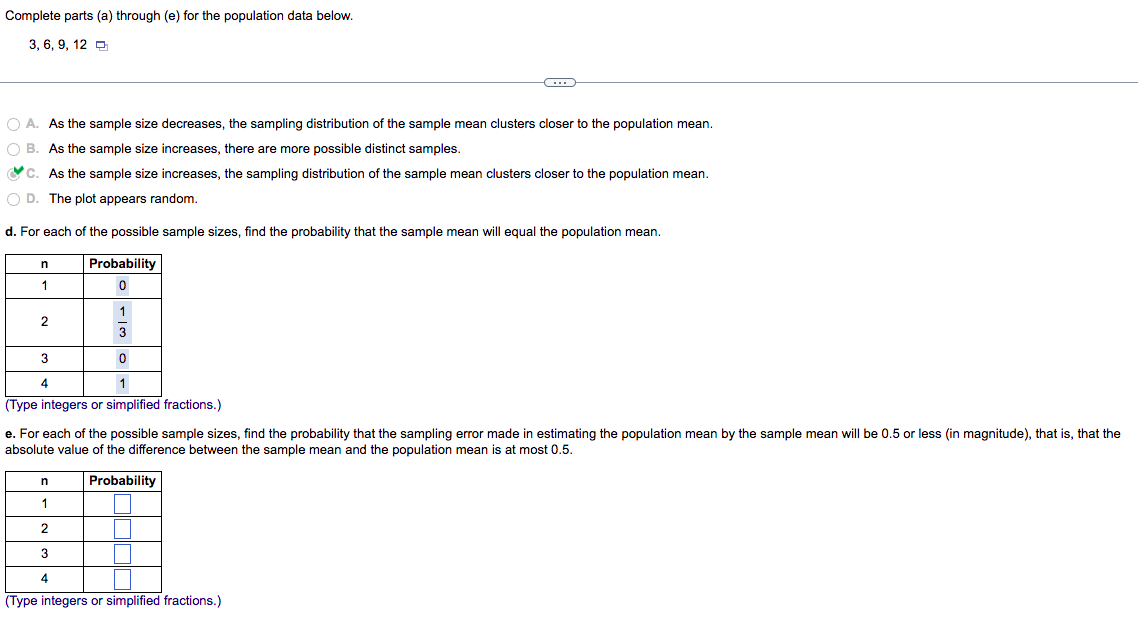
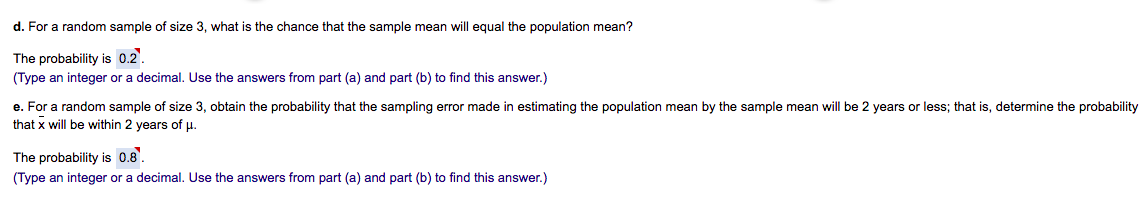
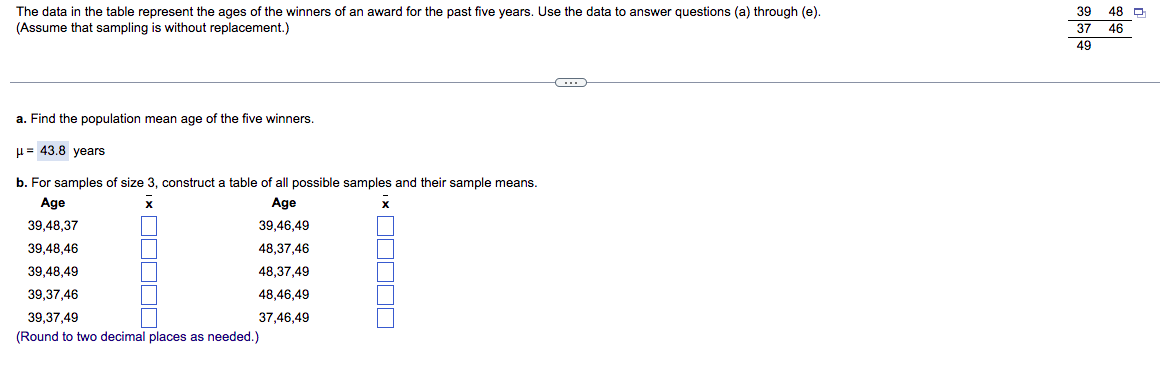
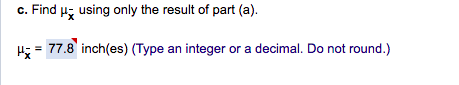
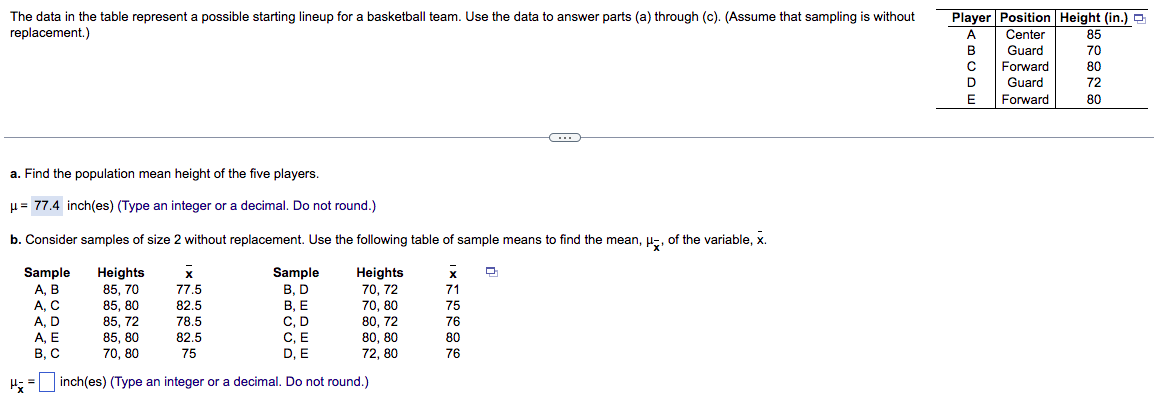
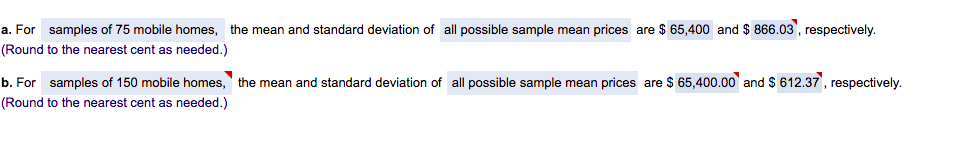

Complete parts (a) through (e) for the population data below. 3, 6. 9, 12 :I As the sample size decreases. the sampling distribution of the sample mean clusters closer to the population mean. As the sample size increases, there are more possible distinct samples. V As the sample size increases, the sampling distribution of the sample mean clusters closer to the population mean. The p ot appears random. cl. For each of the possible sample sizes. nd the probability that the sample mean will equal the population mean. n Probability 'l 0 1 2 _ 3 3- 0 4 '1 (Type integers or simplified fractions.) e. For each of the possible sample sizes, nd the probability that the sampling error made in estimating the population mean by the sample mean will be 0.5 or less (in magnitude), that is, that the absolute value of the difference between the sample mean and the population mean is at most 0.5. Probability n 1 2 3- 4 (Type integers or simplified fractions.) cl. For a random sample of size 3. what is the chance that the sample mean will equal the population mean? The probability is 0.2'. (Type an integer or a decimal. Use the answers from part (a) and part (b) to find this answer.) 9. Fora random sample of size 3, obtain the probability that the sampling error made in estimating the population mean by the sample mean will be 2 years or less; that is. determine the probability that x will be within 2 years of p. The probability is 0.3'. (Type an integer or a decimal. Use the answers from part (a) and part (b) to find this answer.) The data in the table represent the ages of the winners of an award for the past five years. Use the data to answer questions (a) through (e). 39 48 0 (Assume that sampling is without replacement.) 37 46 49 . . . a. Find the population mean age of the five winners. H = 43.8 years b. For samples of size 3, construct a table of all possible samples and their sample means. Age Age 39,48,37 39,46,49 39,48,46 48,37,46 39,48,49 48,37,49 39,37,46 48,46,49 39,37,49 37,46,49 (Round to two decimal places as needed.)c. Find us using only the result of part (a). 77.8 inch(es) (Type an integer or a decimal. Do not round.)The data in the table represent a possible starting lineup for a basketball team. Use the data to answer parts (a) through (c). (Assume that sampling is without Player | Position| Height (in.) replacement.) Center 85 Guard 70 moons Forward 80 Guard 72 Forward 80 a. Find the population mean height of the five players. H= 77.4 inch(es) (Type an integer or a decimal. Do not round.) b. Consider samples of size 2 without replacement. Use the following table of sample means to find the mean, H-, of the variable, x. Sample Heights X Sample Heights x A, B 85, 70 77.5 B, D 70, 72 71 A, C 85, 80 82.5 B, E 70, 80 75 A, D 85, 72 78.5 C, D 80, 72 76 A, E 85, 80 82.5 C, E 80, 80 80 B. C 70, 80 75 D. E 72, 80 76 H= = \\inch(es) (Type an integer or a decimal. Do not round.)a. For samples of 75 mobile homes. the mean and standard deviation of all possible sample mean prices are 3; 65.400 and $ 366.03'. respectively. (Round to the nearest cent as needed.) b. For samples of 150 mobile homes,' the mean and standard deviation of all possible sample mean prices are S 65.400.00' and S 612.37}. respectively. (Round to the nearest cent as needed.) According to a recent publication. the mean price of new mobile homes is $63300. Assume a standard deviation of HOBO. Let ; denote the mean price of a sample of new mobile homes. a. For samples of size 75, find the mean and standard deviation of i. Interpret your results in words. b. Repeat part (a) with n =150
Step by Step Solution
There are 3 Steps involved in it

Get step-by-step solutions from verified subject matter experts