

Question: hello i need help with these statistic questions please and thank you all information is below in order thank you question 1 Banking fees have
hello i need help with these statistic questions please and thank you all information is below in order thank you
question 1
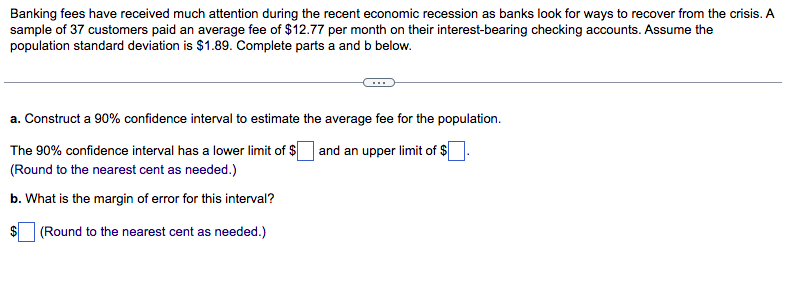
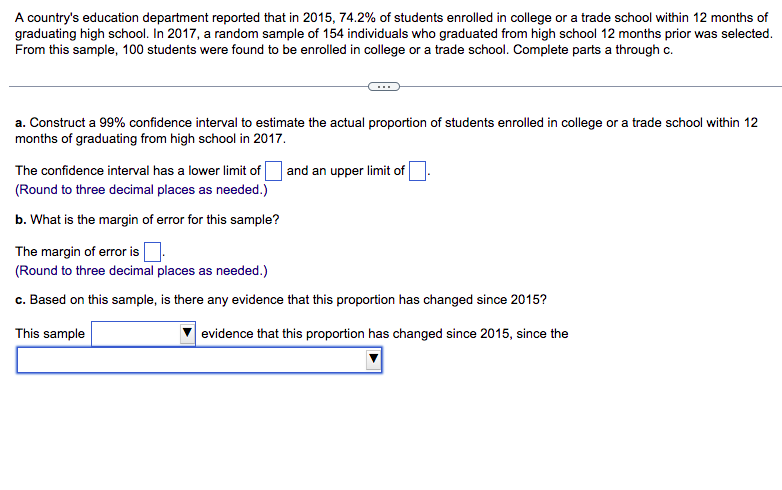
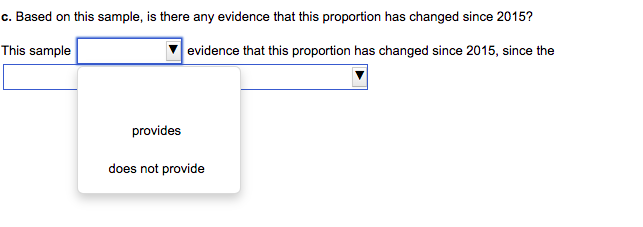
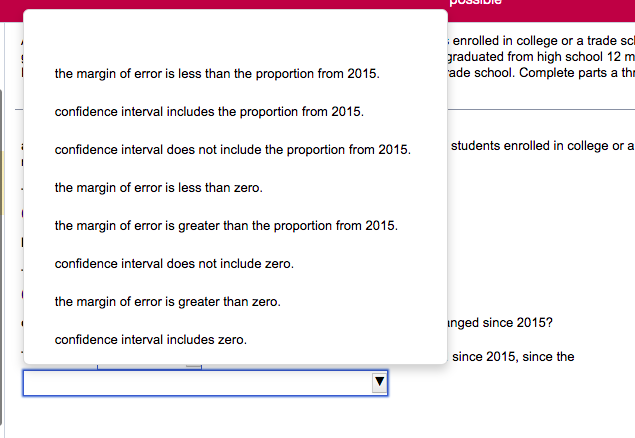
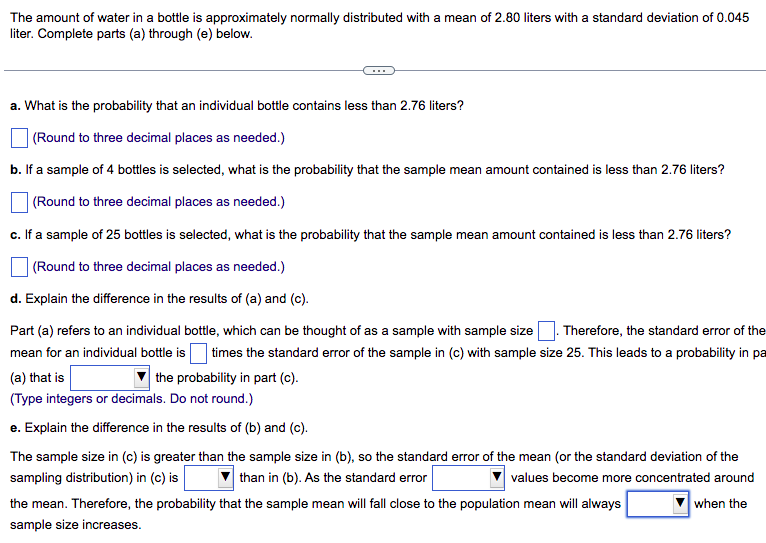
Banking fees have received much attention during the recent economic recession as banks look for ways to recover from the crisis. A sample of 3? customers paid an average fee of 1512?? per month on their interest-bearing checking accounts. Assume the population standard deviation is $1.89. Complete parts a and is below. a. Construct a 90% confidence interval to estimate the average fee for the population. The 90% condence interval has a lower limit of $|:| and an upper limit of HE. [Round to the nearest cent as needed .}| b. |il'li'hat is the margin of error for this interval? $l:| [Round to the nearest cent as needed} A country's education department reported that in 2015, 114.2% of students enrolled in college or a trade school within 12 months of graduating high school. In 201?. a random sample of 154 individuals who graduated from high school 12 months prior was selected. From this sample. 100 students were found to be enrolled in college or a trade school. Complete parts a through c. a. Construct a 99% confidence interval to estimate the actual proportion of students enrolled in college or a trade school within 12 months of graduating from high school in 2131?. The condence interval has a lower limit of D and an upper limit of D. [Round to three decimal places as needed.) b. lll'lr'hat is the margin of error for this sample? The margin of error is D. {Round to three decimal places as needed.) c. Based on this sample. is there any evidence that this proportion has changed since 2215'?I This sample evidence that this proportion has changed since 2015, since the c. Based on this sample, is there any evidence that this proportion has changed since 2015? This sample evidence that this proportion has changed since 2015, since the provides does not provideenrolled in college or a trade sc graduated from high school 12 m the margin of error is less than the proportion from 2015. ade school. Complete parts a th confidence interval includes the proportion from 2015. confidence interval does not include the proportion from 2015. students enrolled in college or a the margin of error is less than zero. the margin of error is greater than the proportion from 2015. confidence interval does not include zero. the margin of error is greater than zero. inged since 2015? confidence interval includes zero. since 2015, since theThe amount of water in a bottle is approximately norm ally distributed with a mean of RED liters with a standard deviation of H.045 liter. Complete parts {a} through {e) below. a. I|.|"I.I'hat is the probability that an individual bottle contains less than 2.?6 liters? |:| {Round to three decimal places as needed.) b. If a sample of 4 bottles is selected, what is the probability that the sample mean amount contained is less than 2.?6 liters? |:| {Round to three decimal places as needed.) o. If a sample of 25 bottles is selected. what is the probability that the sample mean amount contained is less than 2.?6 liters? |:| {Round to three decimal places as needed.) d. Explain the difference in the results of (a) and (c). Part {a) refers to an individual bottle, which can be thought of as a sample with sample size |:|. Therefore, the standard error of the mean for an individual bottle is D times the standard error of the sample in [c] with sample size 25. This leads to a probability in pa [3) that is |:| the probability in part is). [Type integers or decimals. Do not round.) e. Explain the difference in the results of Eb) and {o). The sample size in {c} is greater than the sample size in {b}, so the standard error of the mean [or the standard deviation of the sampling distribution) in (c) is El than in {b}. As the standard error |:| values become more concentrated around the mean. Therefore. the probability that the sample mean will fall close to the population mean will always El when the sample size increases
Step by Step Solution
There are 3 Steps involved in it

Get step-by-step solutions from verified subject matter experts