

Question: Hello, I need help with this dataset and being able to complete the problems I am having a hard time understanding and my code for
Hello, I need help with this dataset and being able to complete the problems I am having a hard time understanding and my code for R studio keeps crashing, can anyone help? It is due tomorrow afternoon.
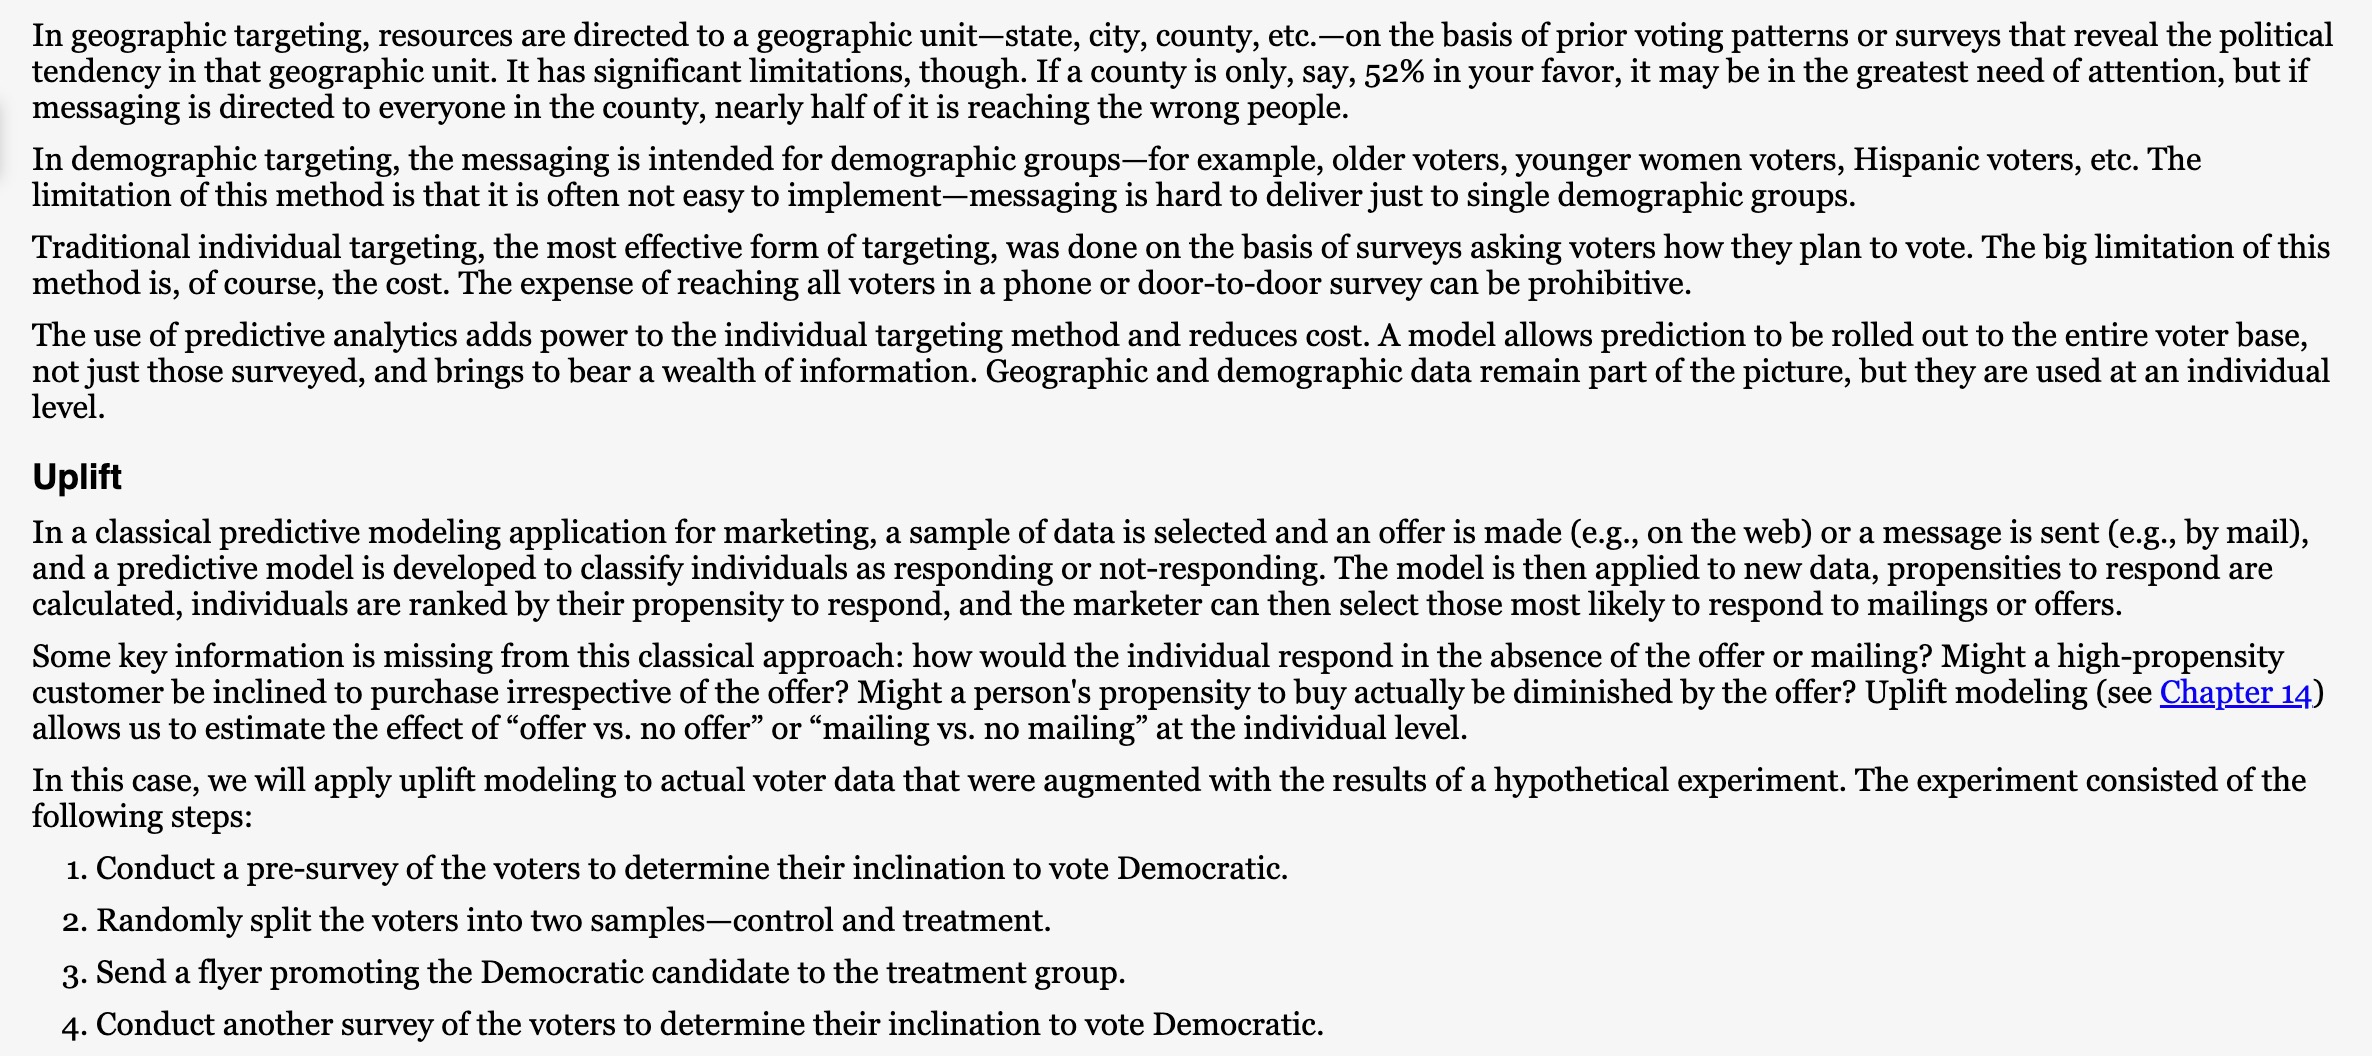
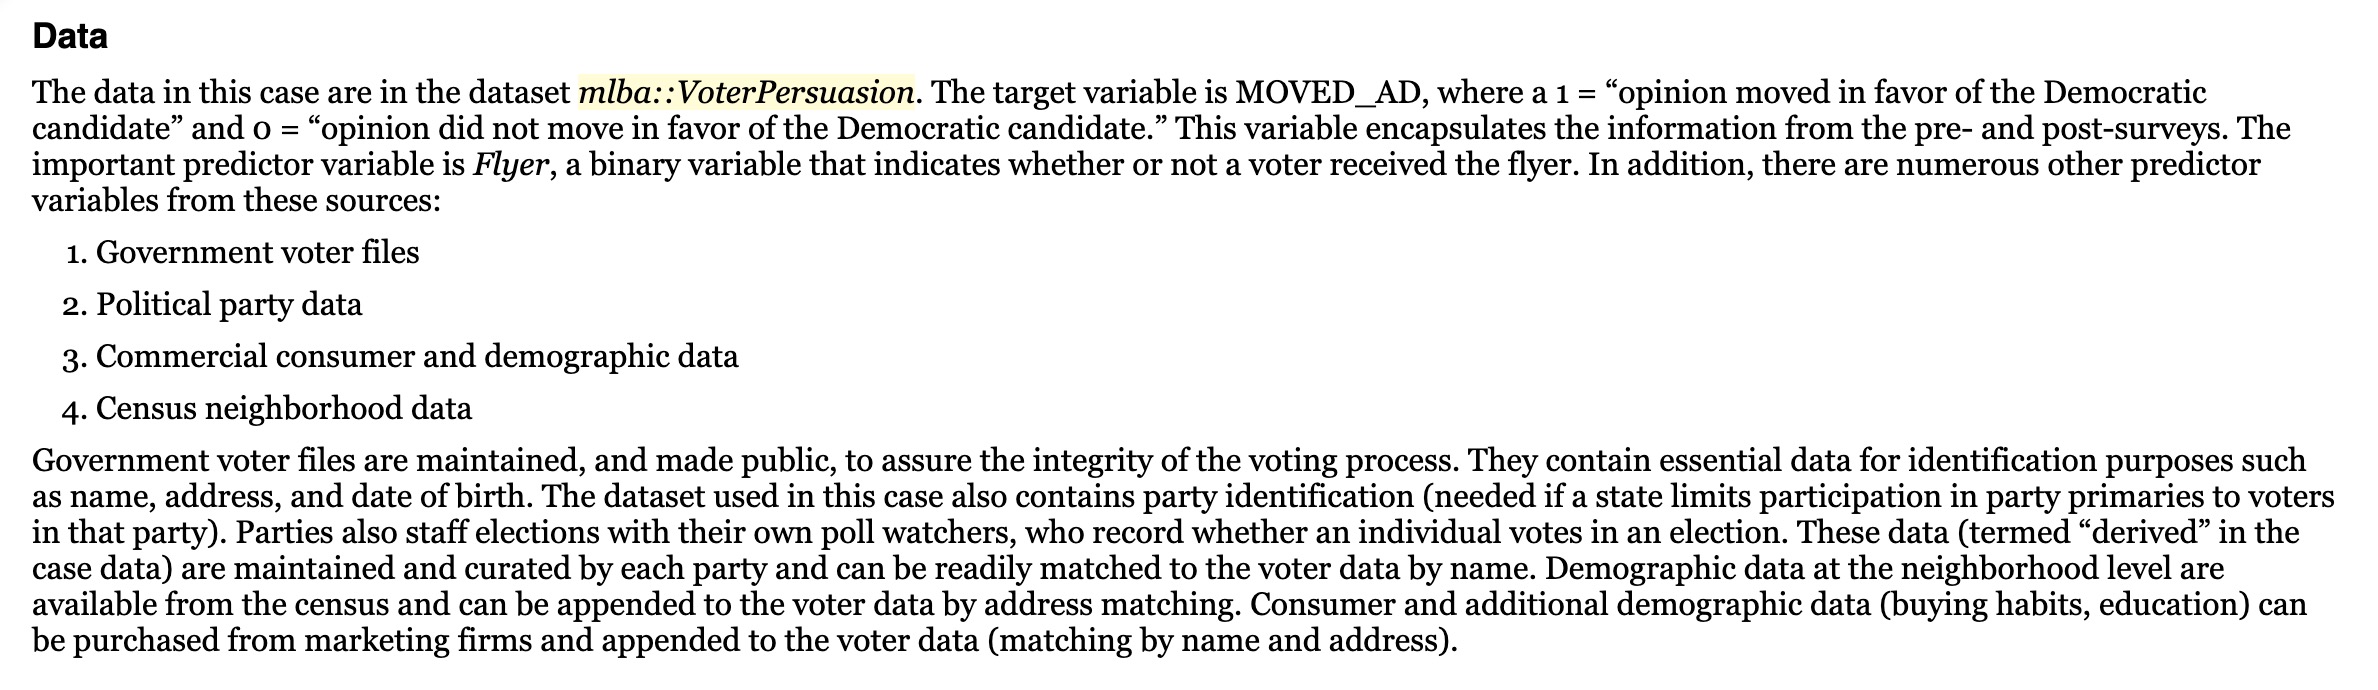
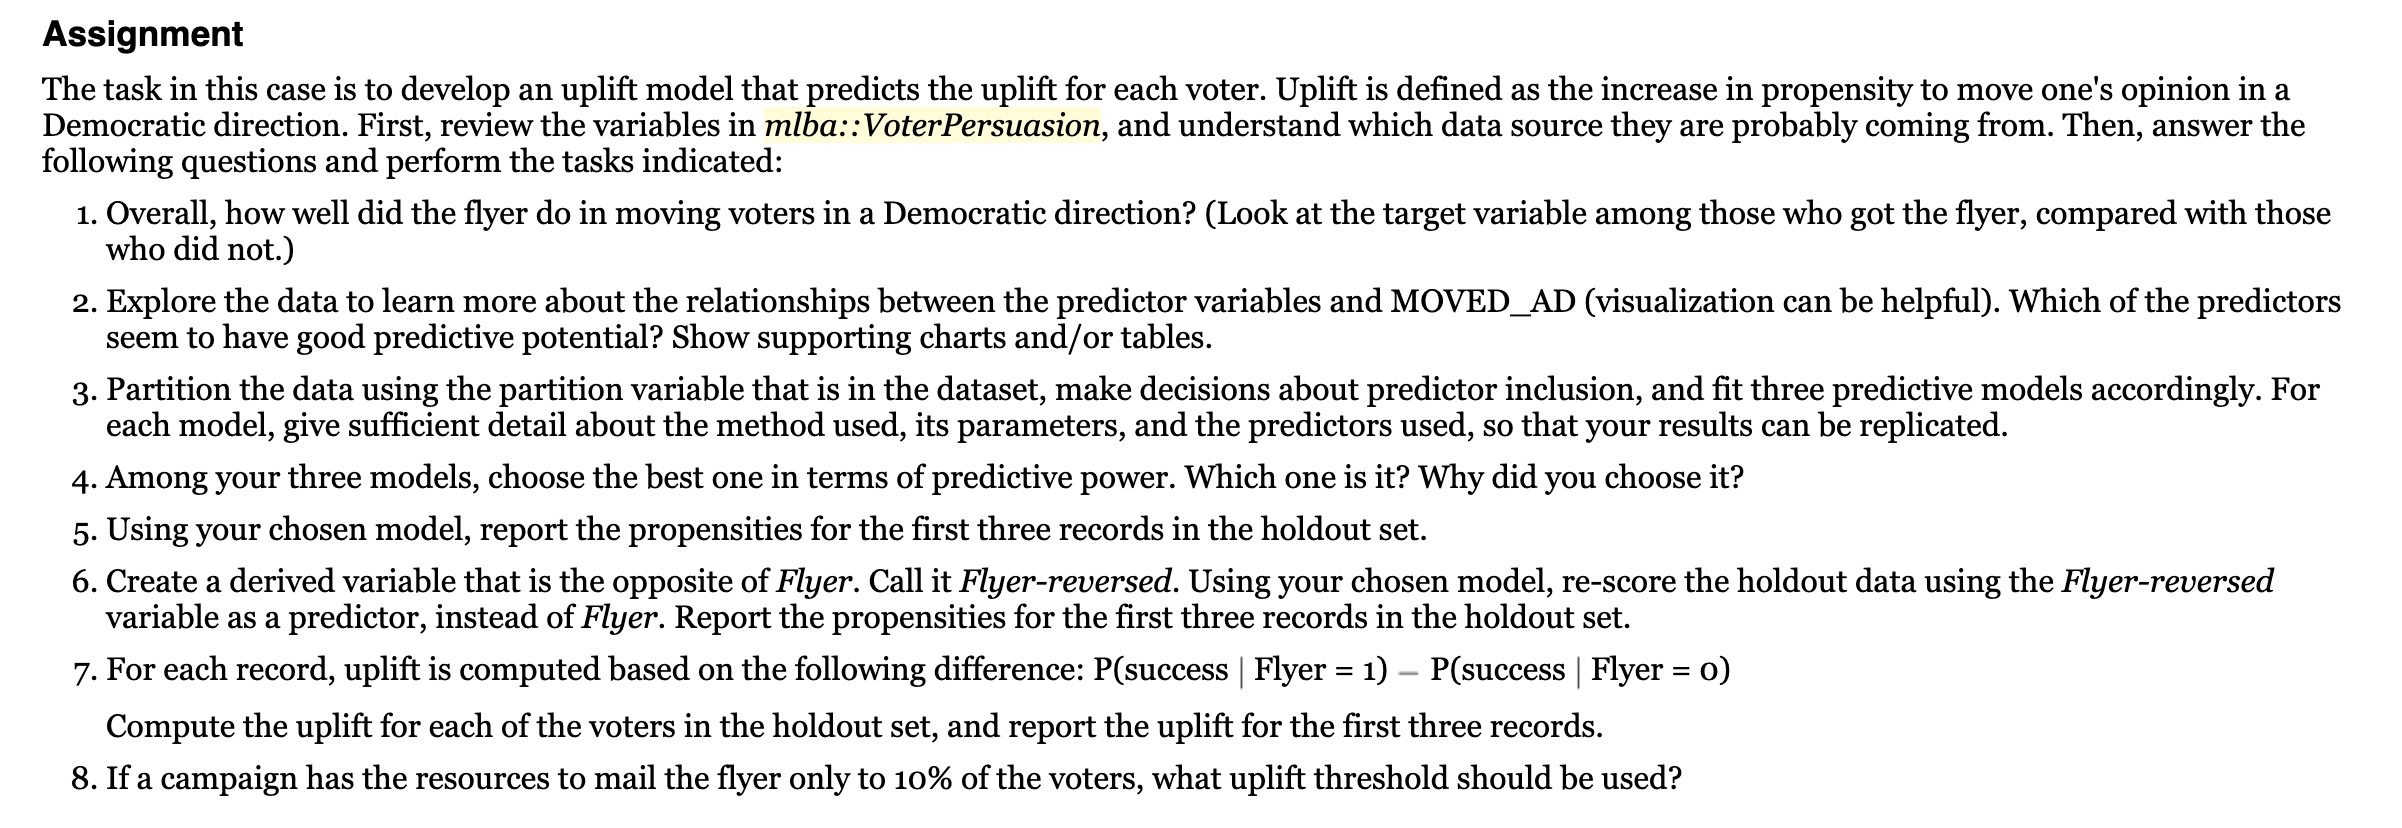
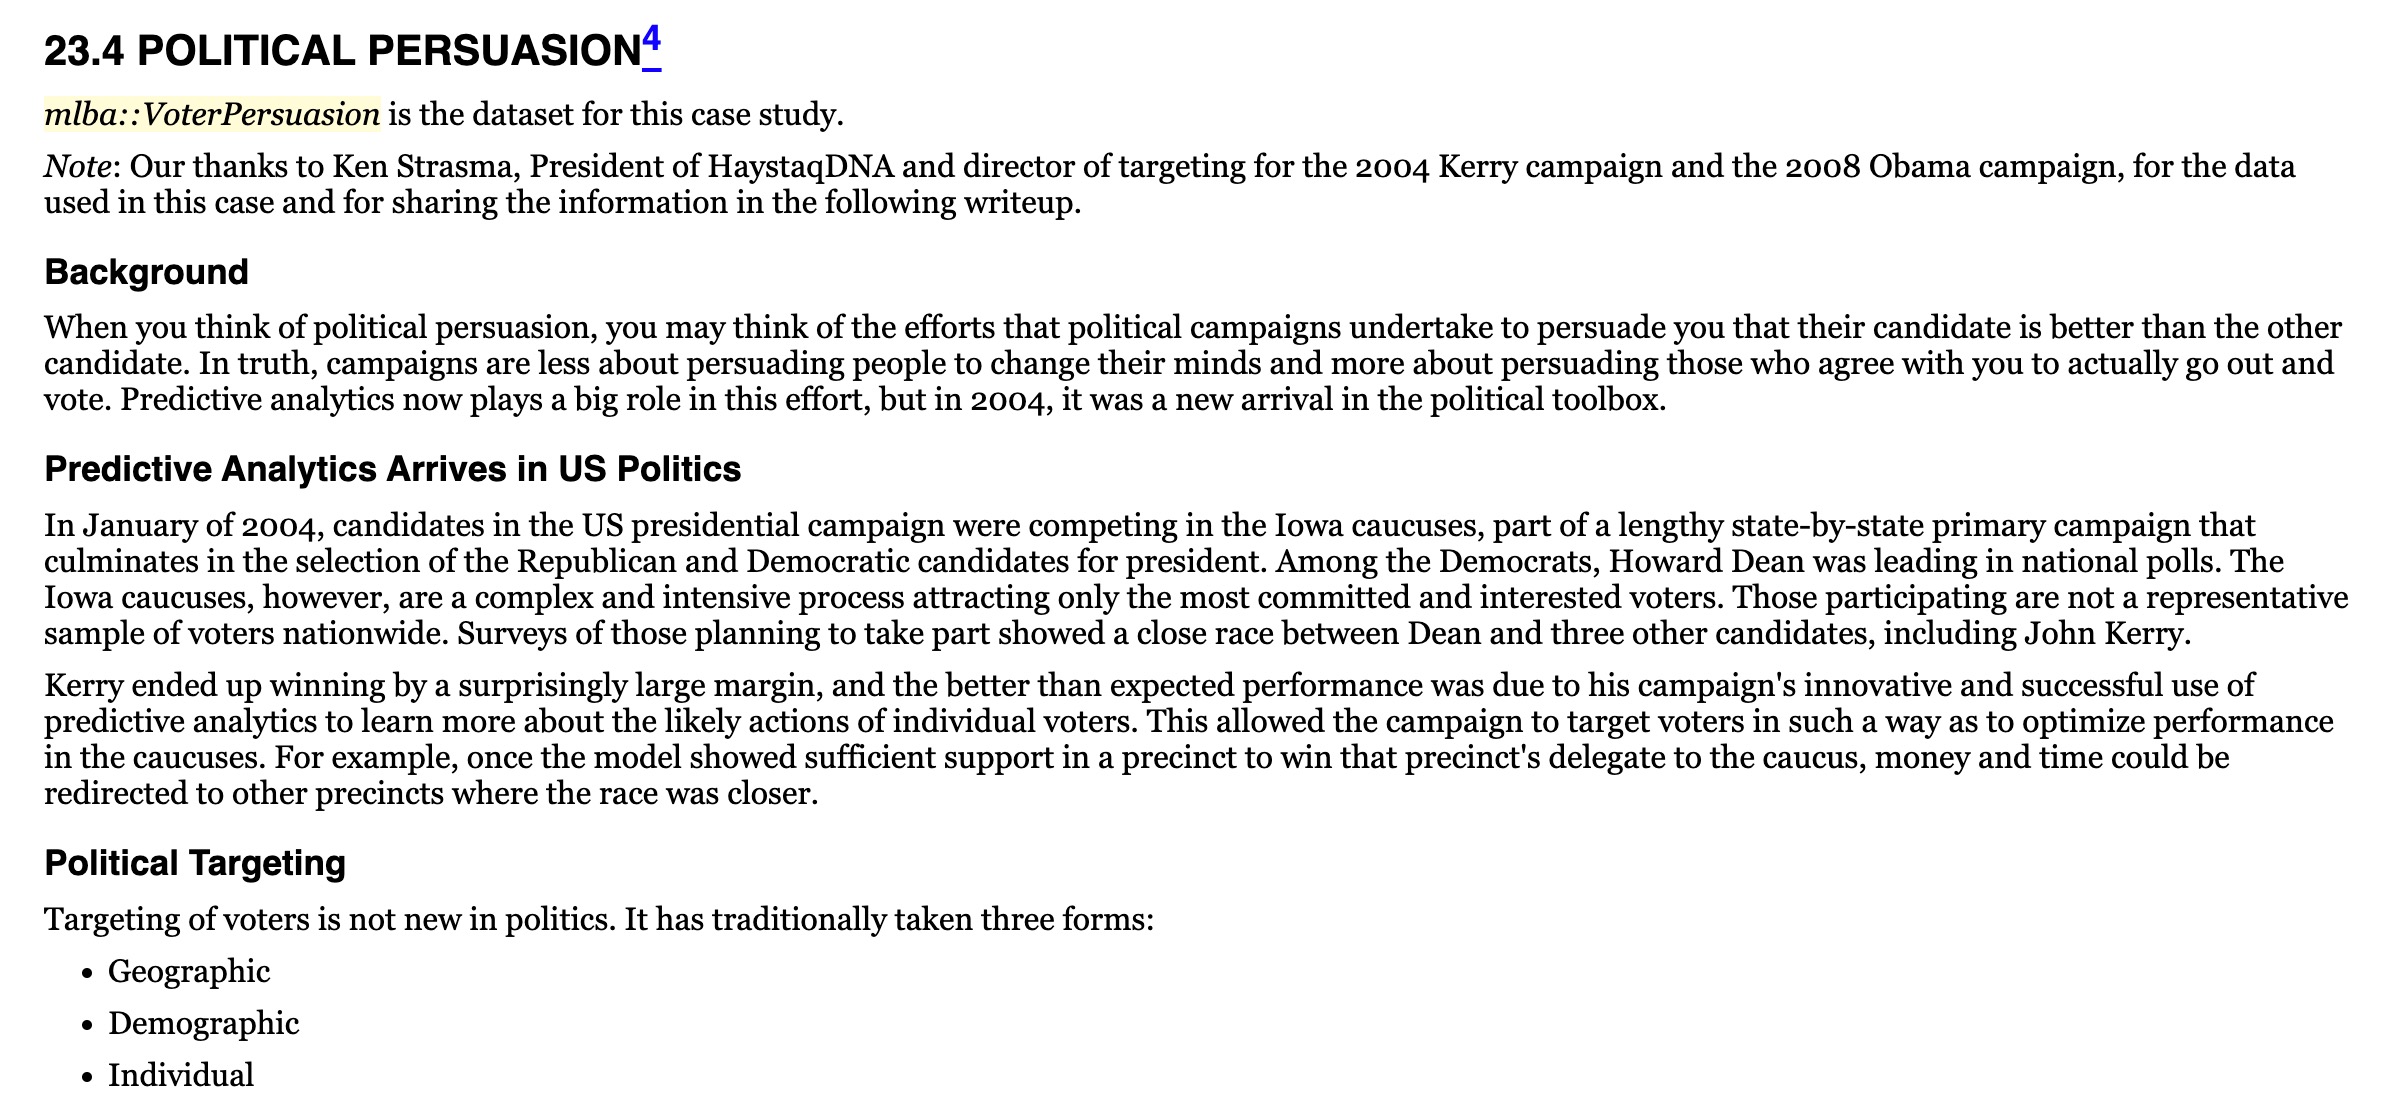
In geographic targeting, resources are directed to a geographic unitstate, city, county, etc.on the basis of prior voting patterns or surveys that reveal the political tendency in that geographic unit. It has significant limitations, though. If a county is only, say, 52% in your favor, it may be in the greatest need of attention, but if messaging is directed to everyone in the county, nearly half of it is reaching the wrong people. In demographic targeting, the messaging is intended for demographic groupsfor example, older voters, younger women voters, Hispanic voters, etc. The limitation of this method is that it is often not easy to implementmessaging is hard to deliver just to single demographic groups. Traditional individual targeting, the most effective form of targeting, was done on the basis of surveys asking voters how they plan to vote. The big limitation of this method is, of course, the cost. The expense of reaching all voters in a phone or door-to-door survey can be prohibitive. The use of predictive analytics adds power to the individual targeting method and reduces cost. A model allows prediction to be rolled out to the entire voter base, not just those surveyed, and brings to bear a wealth of information. Geographic and demographic data remain part of the picture, but they are used at an individual level. Uplift In a classical predictive modeling application for marketing, a sample of data is selected and an offer is made (e.g., on the web) or a message is sent (e.g., by mail), and a predictive model is developed to classify individuals as responding or not-responding. The model is then applied to new data, propensities to respond are calculated, individuals are ranked by their propensity to respond, and the marketer can then select those most likely to respond to mailings or offers. Some key information is missing from this classical approach: how would the individual respond in the absence of the offer or mailing? Might a high-propensity customer be inclined to purchase irrespective of the offer? Might a person's propensity to buy actually be diminished by the offer? Uplift modeling (see Chapter 14) allows us to estimate the effect of \"offer vs. no offer\" or \"mailing vs. no mailing\" at the individual level. In this case, we will apply uplift modeling to actual voter data that were augmented with the results of a hypothetical experiment. The experiment consisted of the following steps: 1. Conduct a pre-survey of the voters to determine their inclination to vote Democratic. 2. Randomly split the voters into two samplescontrol and treatment. 3. Send a flyer promoting the Democratic candidate to the treatment group. 4. Conduct another survey of the voters to determine their inclination to vote Democratic. Data The data in this case are in the dataset mlba::VoterPersuasion. The target variable is MOVED_AD, where a 1 = \"opinion moved in favor of the Democratic candidate\" and o = \"opinion did not move in favor of the Democratic candidate.\" This variable encapsulates the information from the pre- and post-surveys. The important predictor variable is Flyer, a binary variable that indicates whether or not a voter received the flyer. In addition, there are numerous other predictor variables from these sources: 1. Government voter files 2. Political party data 3. Commercial consumer and demographic data 4. Census neighborhood data Government voter files are maintained, and made public, to assure the integrity of the voting process. They contain essential data for identification purposes such as name, address, and date of birth. The dataset used in this case also contains party identification (needed if a state limits participation in party primaries to voters in that party). Parties also staff elections with their own poll watchers, who record whether an individual votes in an election. These data (termed \"derived\" in the case data) are maintained and curated by each party and can be readily matched to the voter data by name. Demographic data at the neighborhood level are available from the census and can be appended to the voter data by address matching. Consumer and additional demographic data (buying habits, education) can be purchased from marketing firms and appended to the voter data (matching by name and address). Assignment The task in this case is to develop an uplift model that predicts the uplift for each voter. Uplift is defined as the increase in propensity to move one's opinion in a Democratic direction. First, review the variables in mlba: : VoterPersuasion, and understand which data source they are probably coming from. Then, answer the following questions and perform the tasks indicated: = 3. 4. . Using your chosen model, report the propensities for the first three records in the holdout set. w1 . Overall, how well did the flyer do in moving voters in a Democratic direction? (Look at the target variable among those who got the flyer, compared with those who did not.) . Explore the data to learn more about the relationships between the predictor variables and MOVED_AD (visualization can be helpful). Which of the predictors seem to have good predictive potential? Show supporting charts and/or tables. Partition the data using the partition variable that is in the dataset, make decisions about predictor inclusion, and fit three predictive models accordingly. For each model, give sufficient detail about the method used, its parameters, and the predictors used, so that your results can be replicated. Among your three models, choose the best one in terms of predictive power. Which one is it? Why did you choose it? . Create a derived variable that is the opposite of Flyer. Call it Flyer-reversed. Using your chosen model, re-score the holdout data using the Flyer-reversed variable as a predictor, instead of Flyer. Report the propensities for the first three records in the holdout set. For each record, uplift is computed based on the following difference: P(success | Flyer = 1) P(success | Flyer = 0) Compute the uplift for each of the voters in the holdout set, and report the uplift for the first three records. . If a campaign has the resources to mail the flyer only to 10% of the voters, what uplift threshold should be used? 23.4 POLITICAL PERSUASION? miba::VoterPersuasion is the dataset for this case study. Note: Our thanks to Ken Strasma, President of HaystagDNA and director of targeting for the 2004 Kerry campaign and the 2008 Obama campaign, for the data used in this case and for sharing the information in the following writeup. Background When you think of political persuasion, you may think of the efforts that political campaigns undertake to persuade you that their candidate is better than the other candidate. In truth, campaigns are less about persuading people to change their minds and more about persuading those who agree with you to actually go out and vote. Predictive analytics now plays a big role in this effort, but in 2004, it was a new arrival in the political toolbox. Predictive Analytics Arrives in US Politics In January of 2004, candidates in the US presidential campaign were competing in the Iowa caucuses, part of a lengthy state-by-state primary campaign that culminates in the selection of the Republican and Democratic candidates for president. Among the Democrats, Howard Dean was leading in national polls. The Iowa caucuses, however, are a complex and intensive process attracting only the most committed and interested voters. Those participating are not a representative sample of voters nationwide. Surveys of those planning to take part showed a close race between Dean and three other candidates, including John Kerry. Kerry ended up winning by a surprisingly large margin, and the better than expected performance was due to his campaign's innovative and successful use of predictive analytics to learn more about the likely actions of individual voters. This allowed the campaign to target voters in such a way as to optimize performance in the caucuses. For example, once the model showed sufficient support in a precinct to win that precinct's delegate to the caucus, money and time could be redirected to other precincts where the race was closer. Political Targeting Targeting of voters is not new in politics. It has traditionally taken three forms: Geographic Demographic Individual
Step by Step Solution
There are 3 Steps involved in it

Get step-by-step solutions from verified subject matter experts