

Question: Hello I need help with this question The following data represent the age (in weeks) at which babies first crawl based on a survey of
Hello I need help with this question
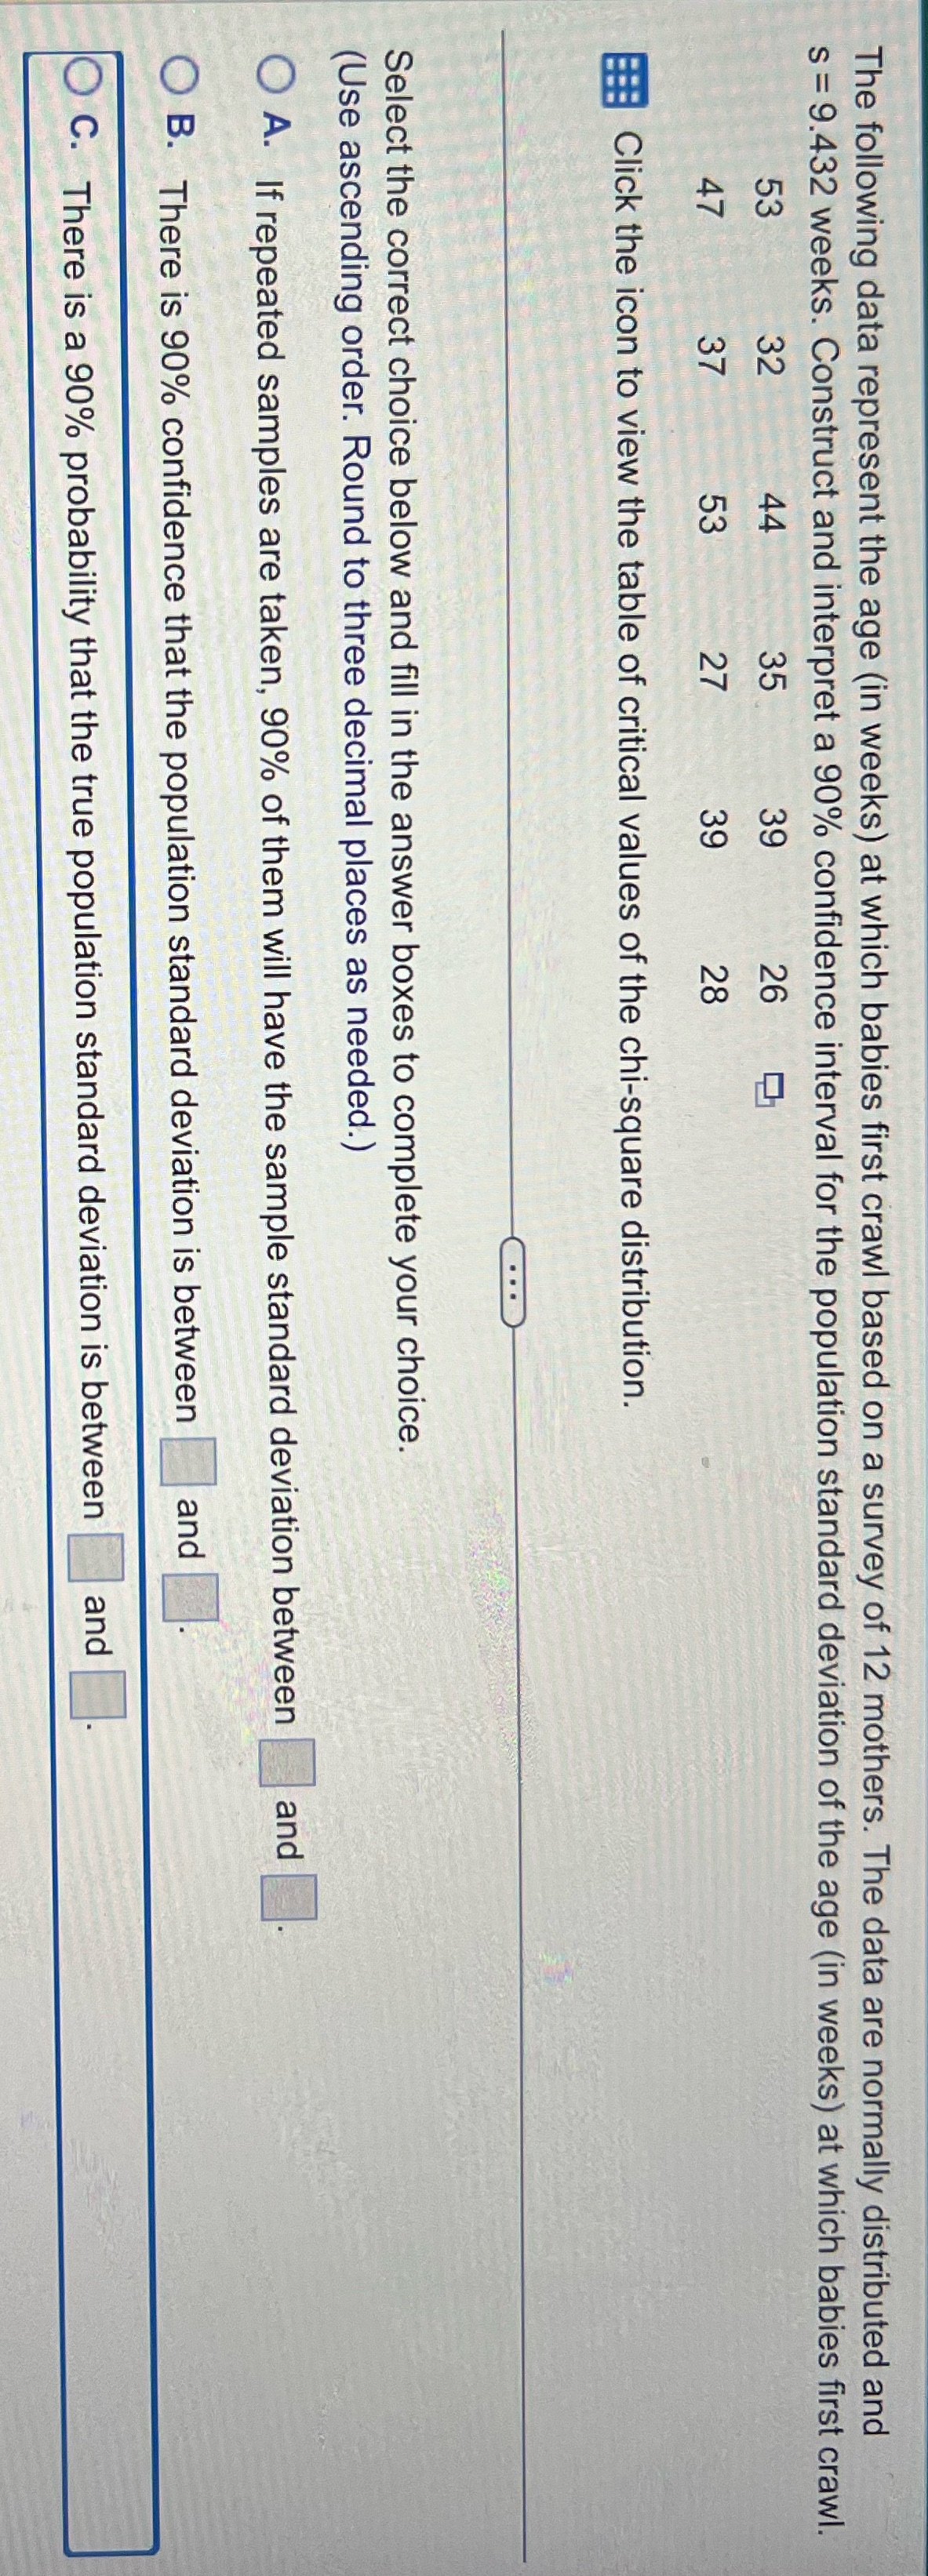
The following data represent the age (in weeks) at which babies first crawl based on a survey of 12 mothers. The data are normally distributed and s =9.432 weeks. Construct and interpret a 90% confidence interval for the population standard deviation of the age (in weeks) at which babies first crawl. 26 Click the icon to view the table of critical values of the chi-square distribution. Select the correct choice below and fill in the answer boxes to complete your choice. (Use ascending order. Round to three decimal places as needed.) O A. If repeated samples are taken, 90% of them will have the sample standard deviation between and O B. There is 90% confidence that the population standard deviation is between and O C. There is a 90% probability that the true population standard deviation is between and
Step by Step Solution
There are 3 Steps involved in it

Get step-by-step solutions from verified subject matter experts