

Question: Hello, I need some and quick help with these questions please the first pictures are just info. The topic is The Sun. OBJECTIVE: . Learn
Hello, I need some and quick help with these questions please the first pictures are just info. The topic is The Sun.
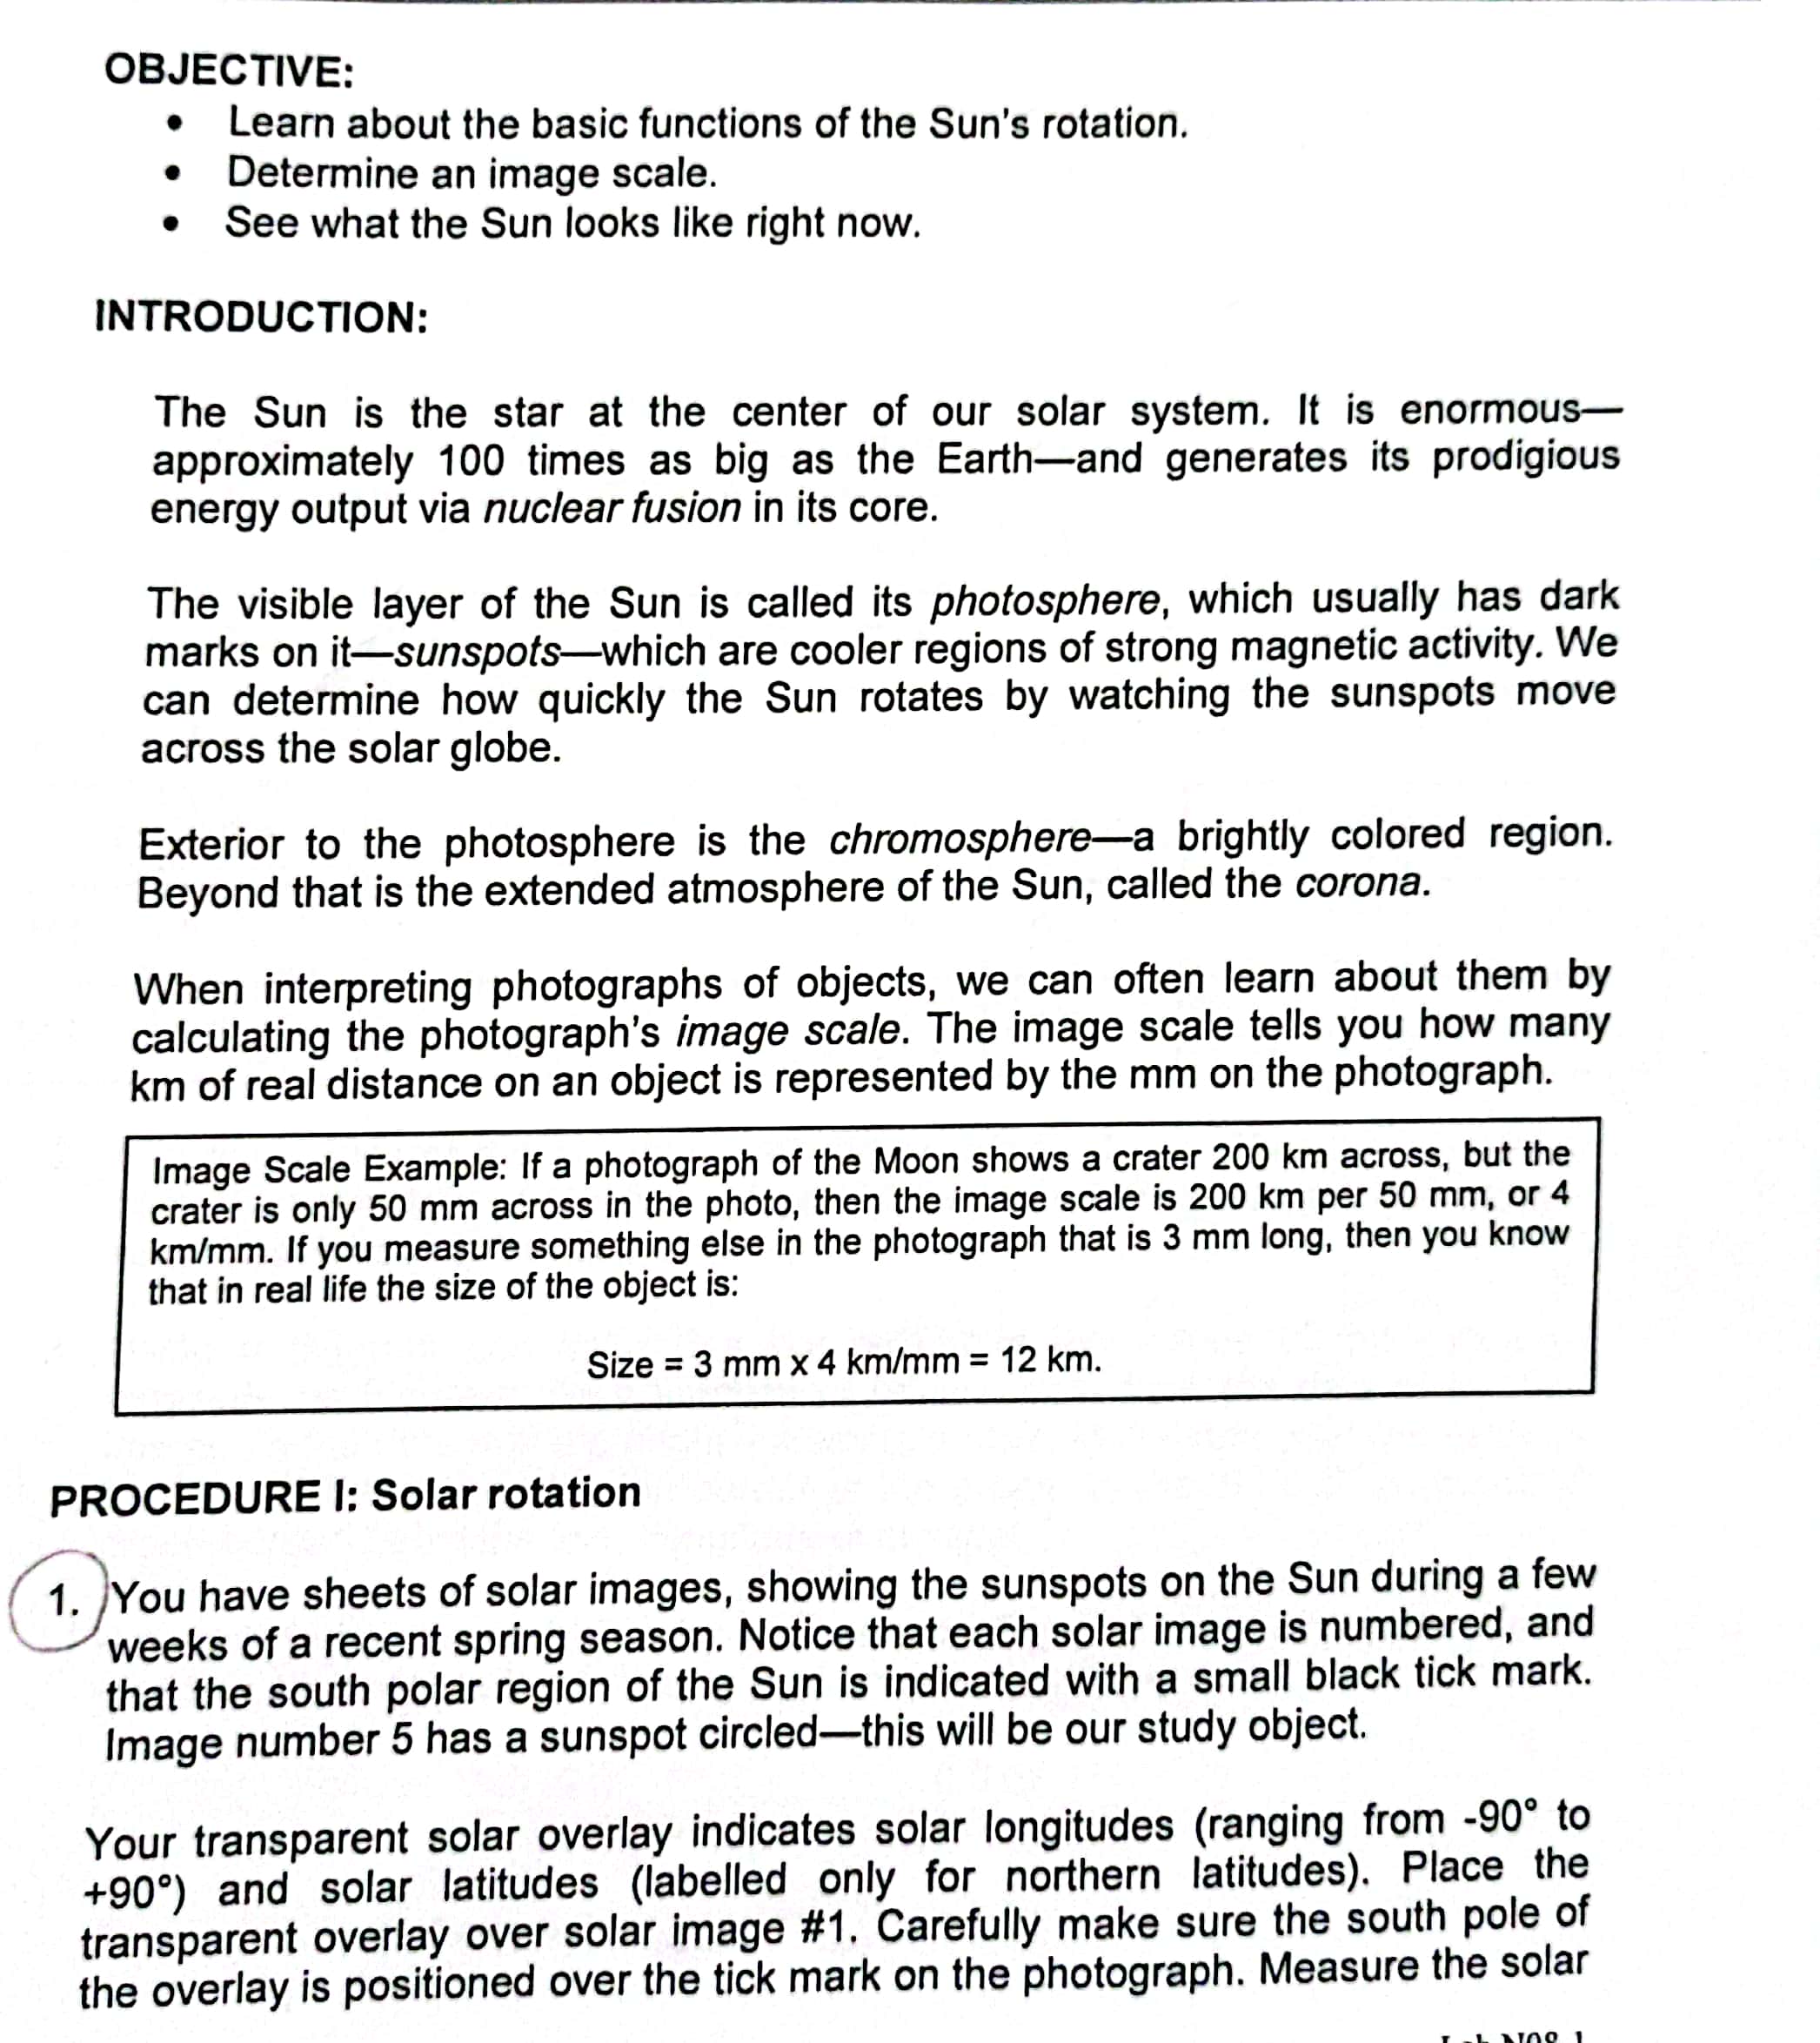
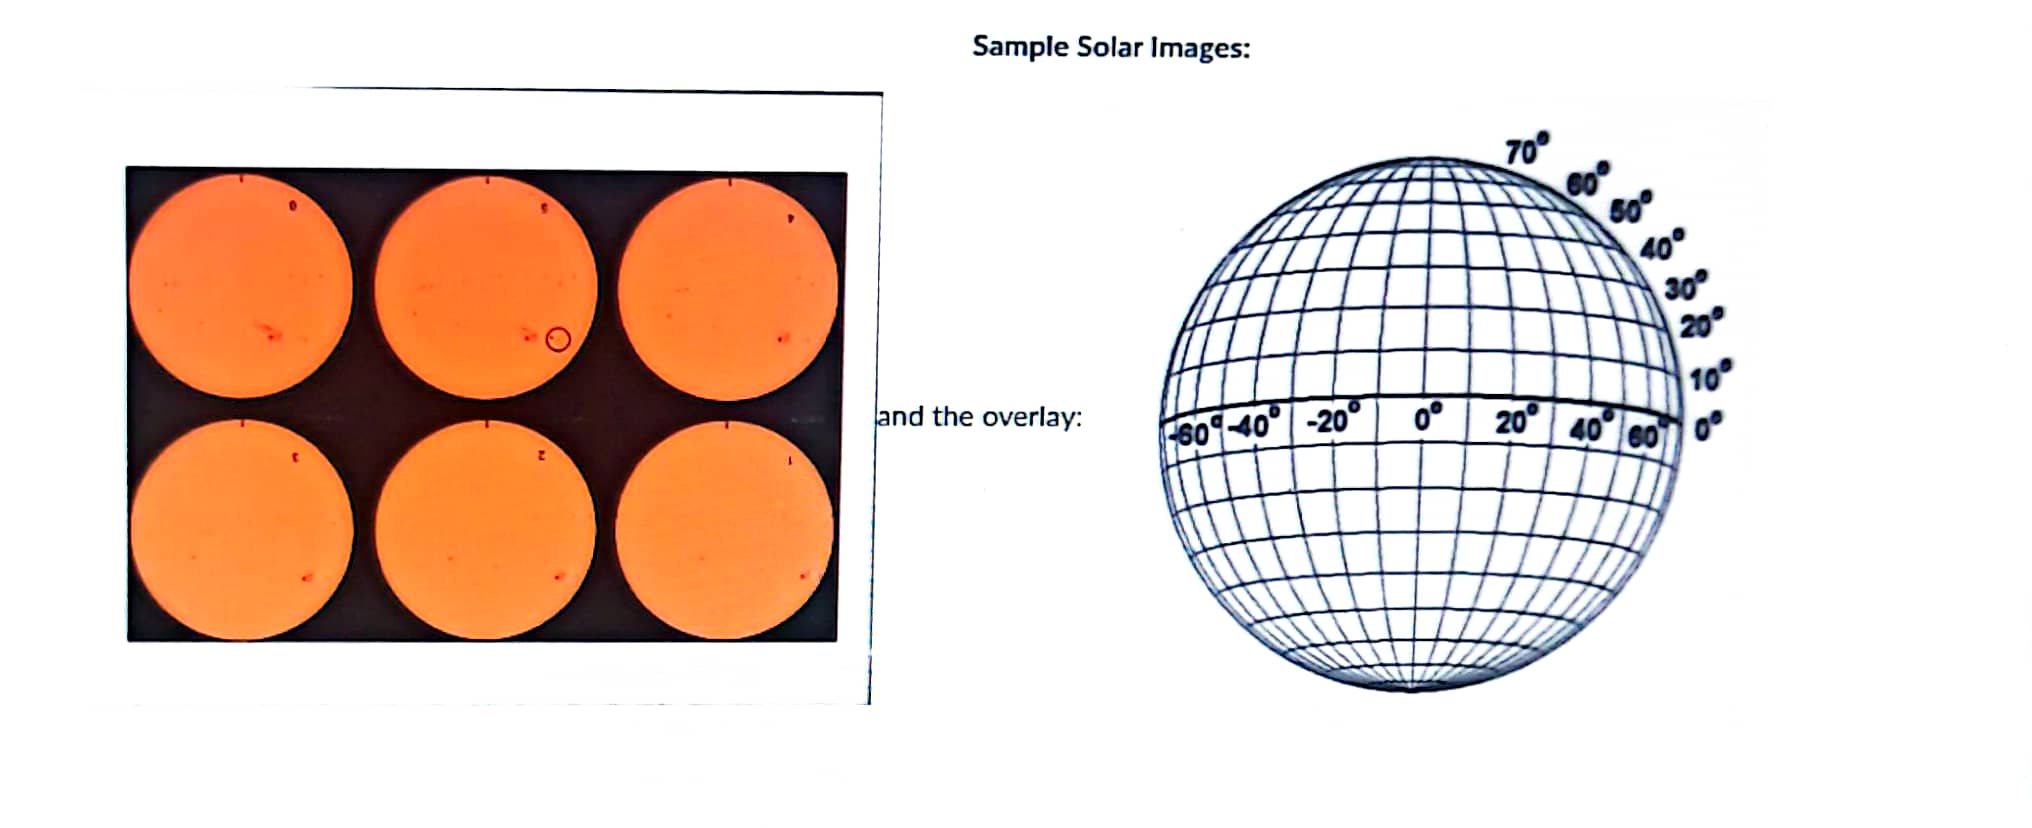
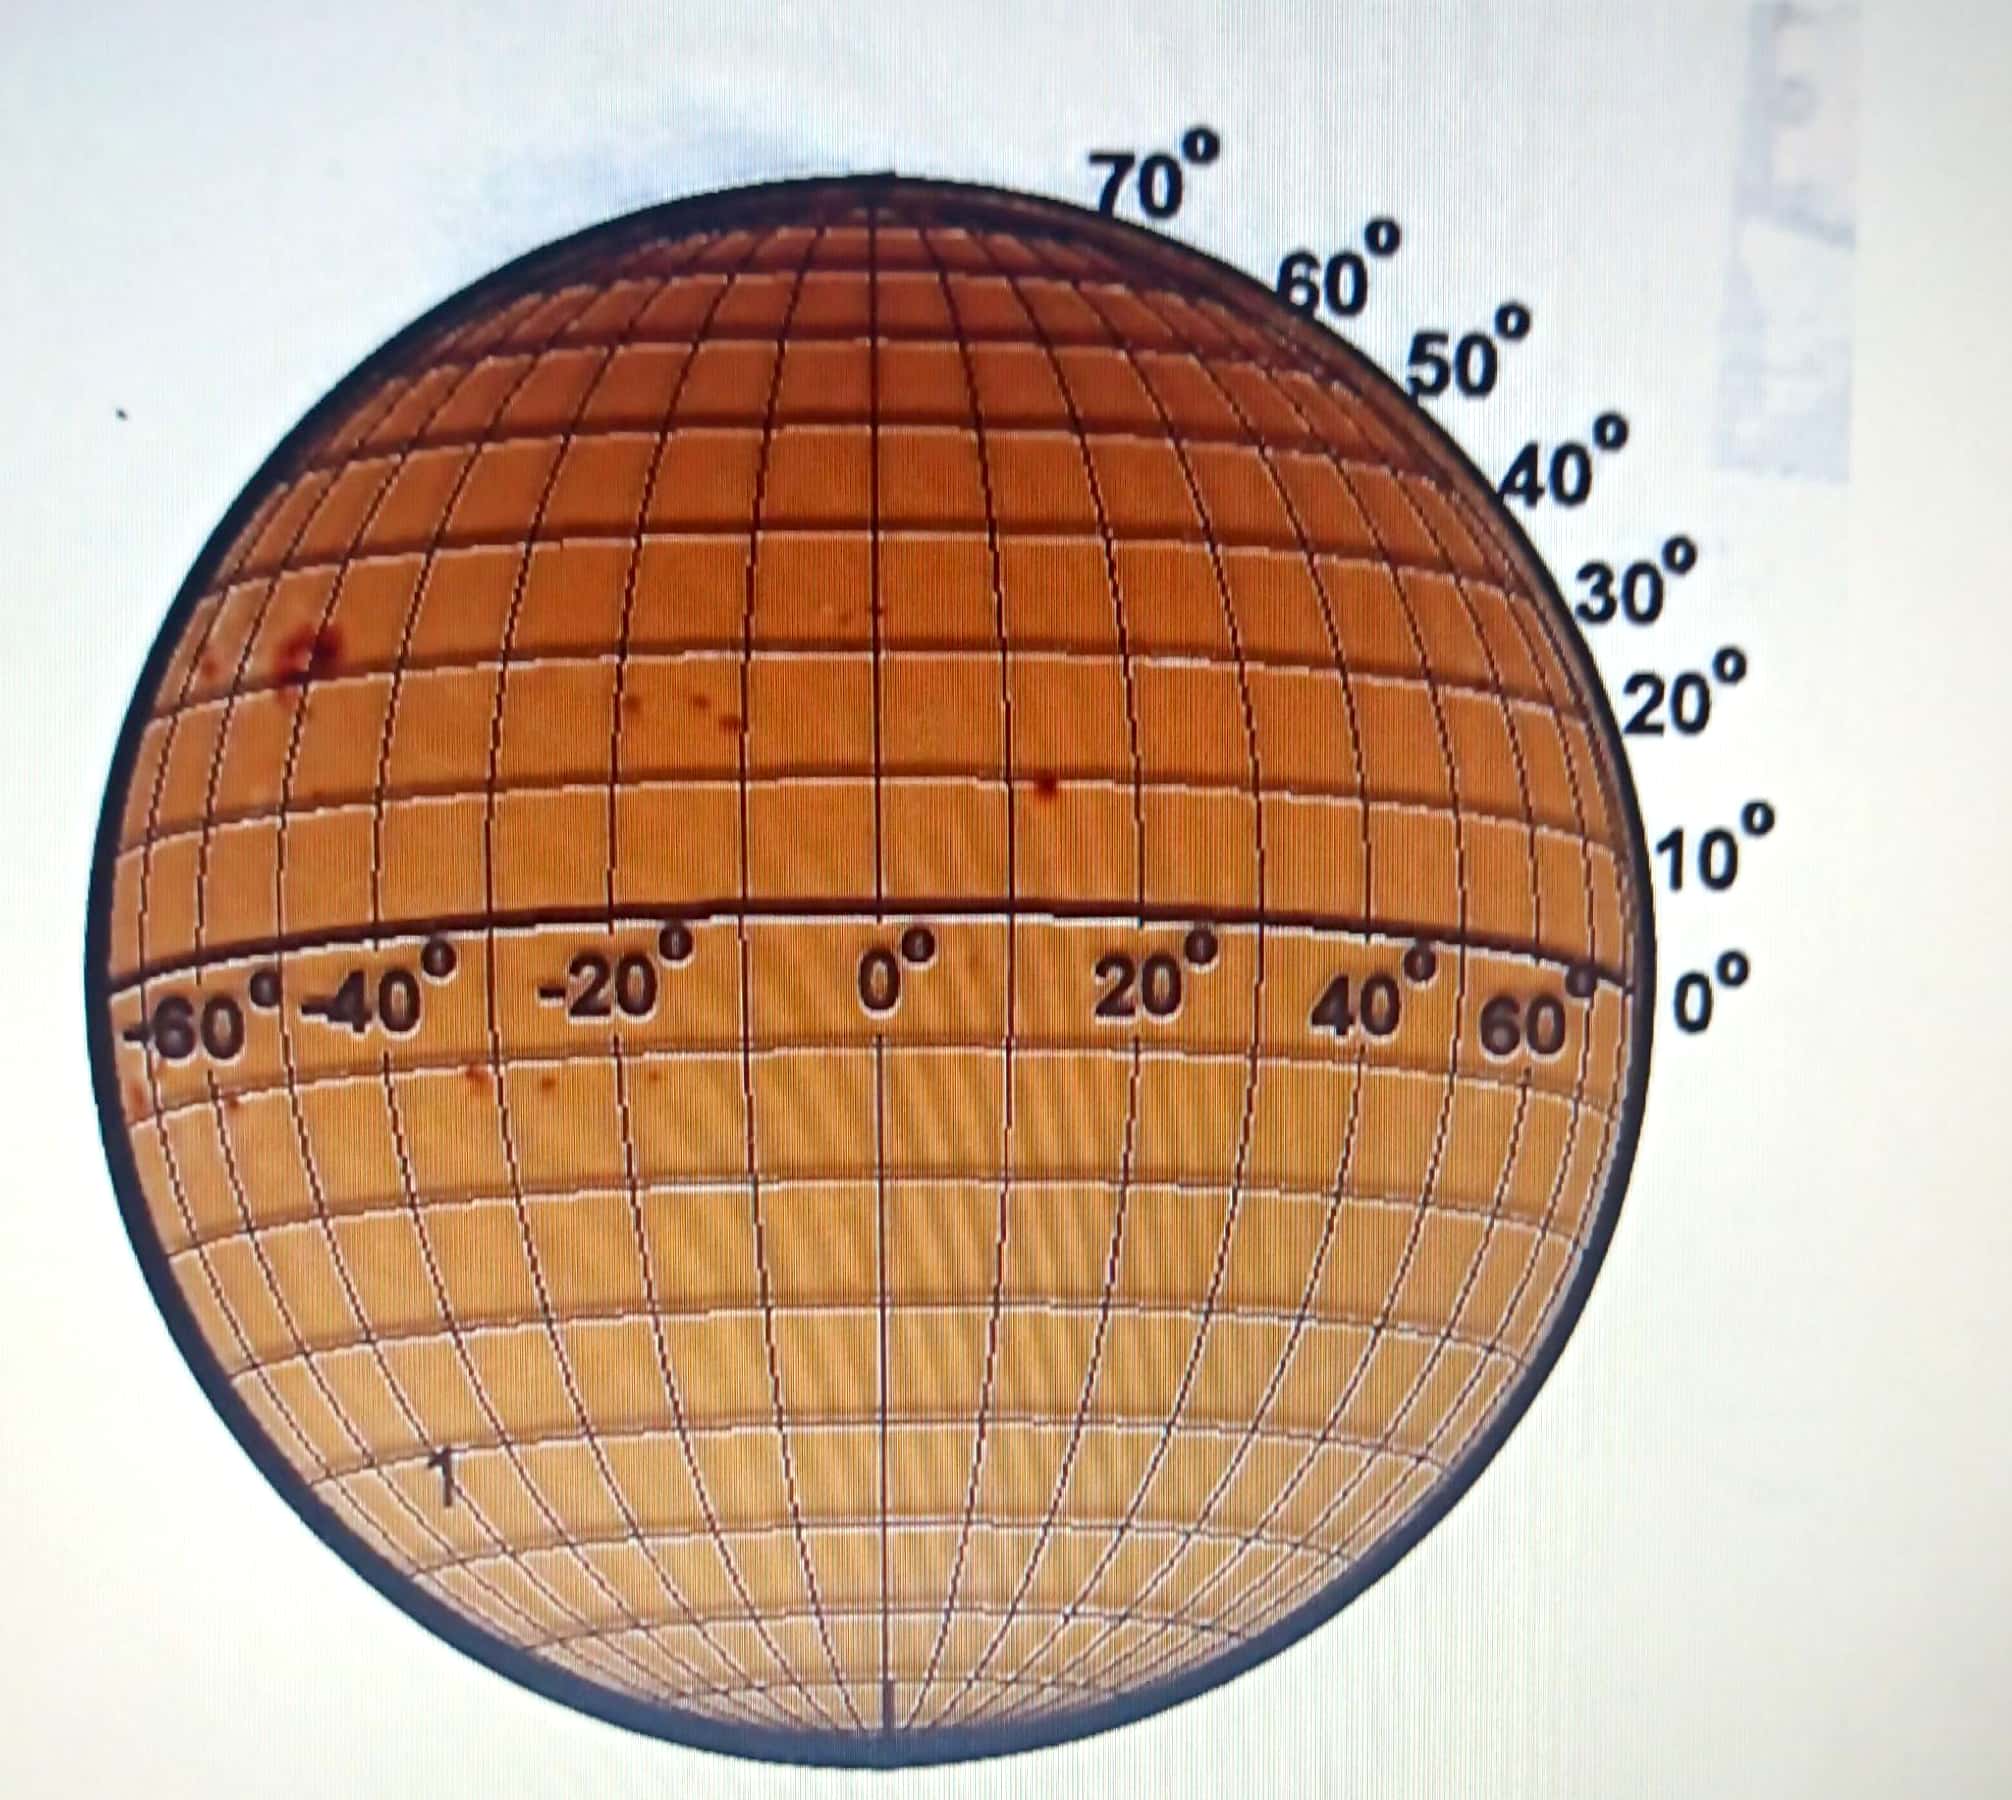
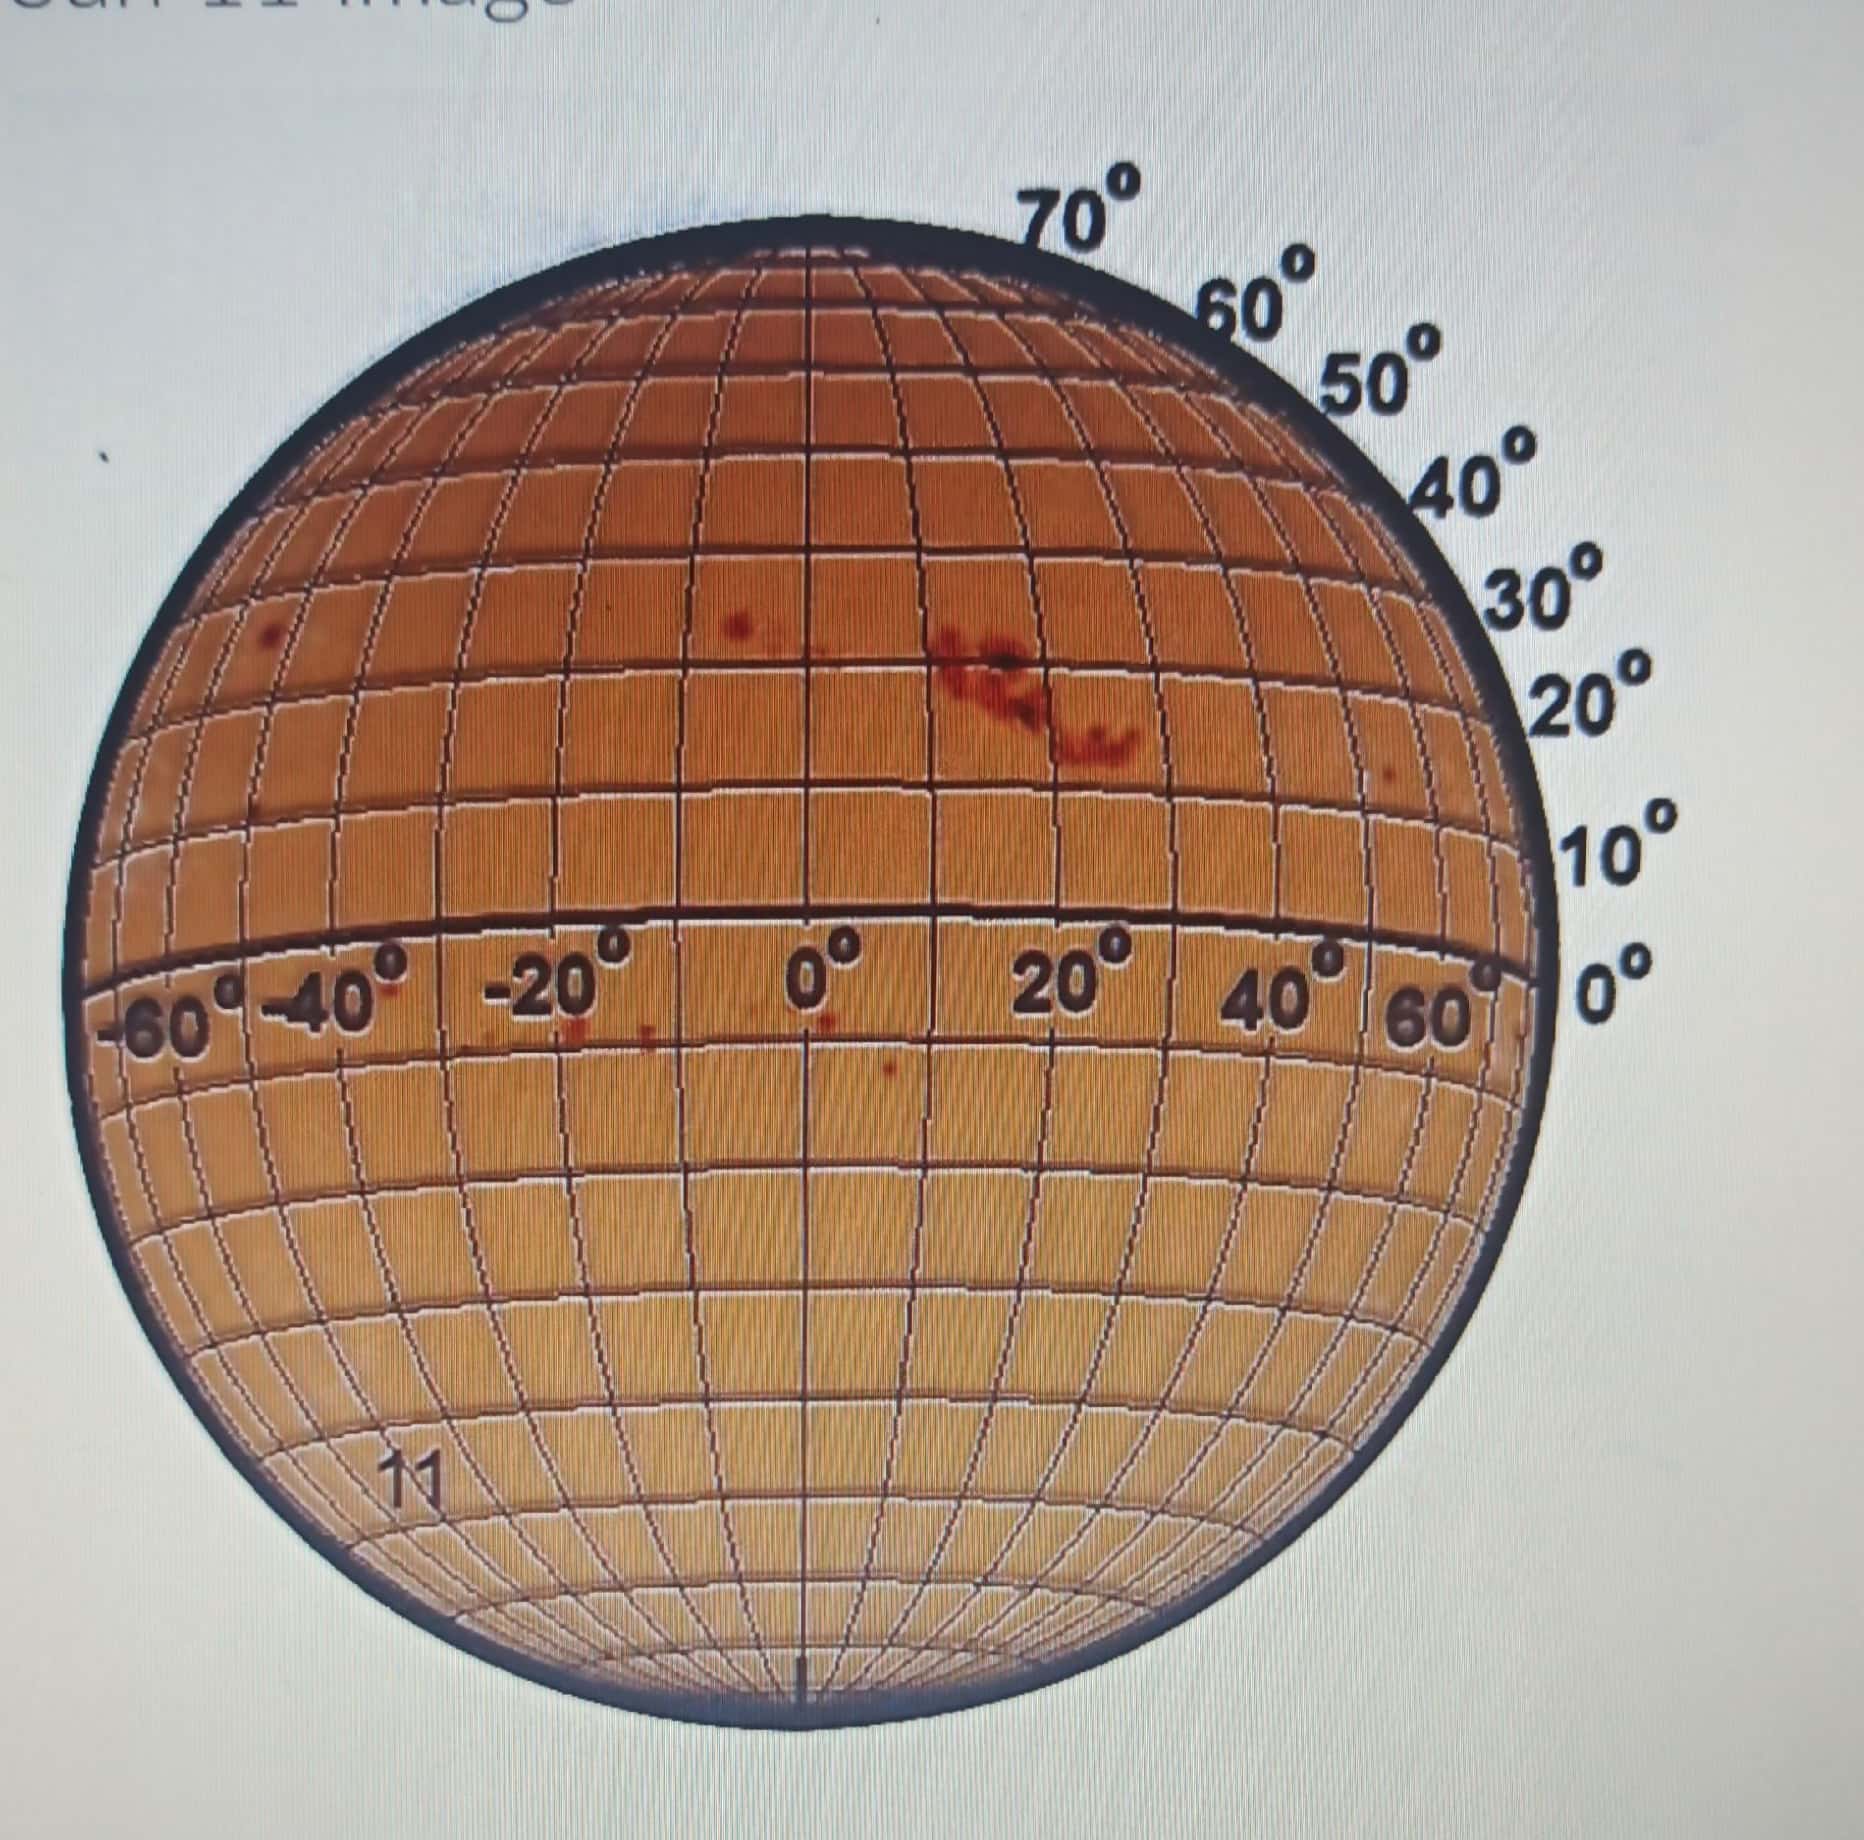
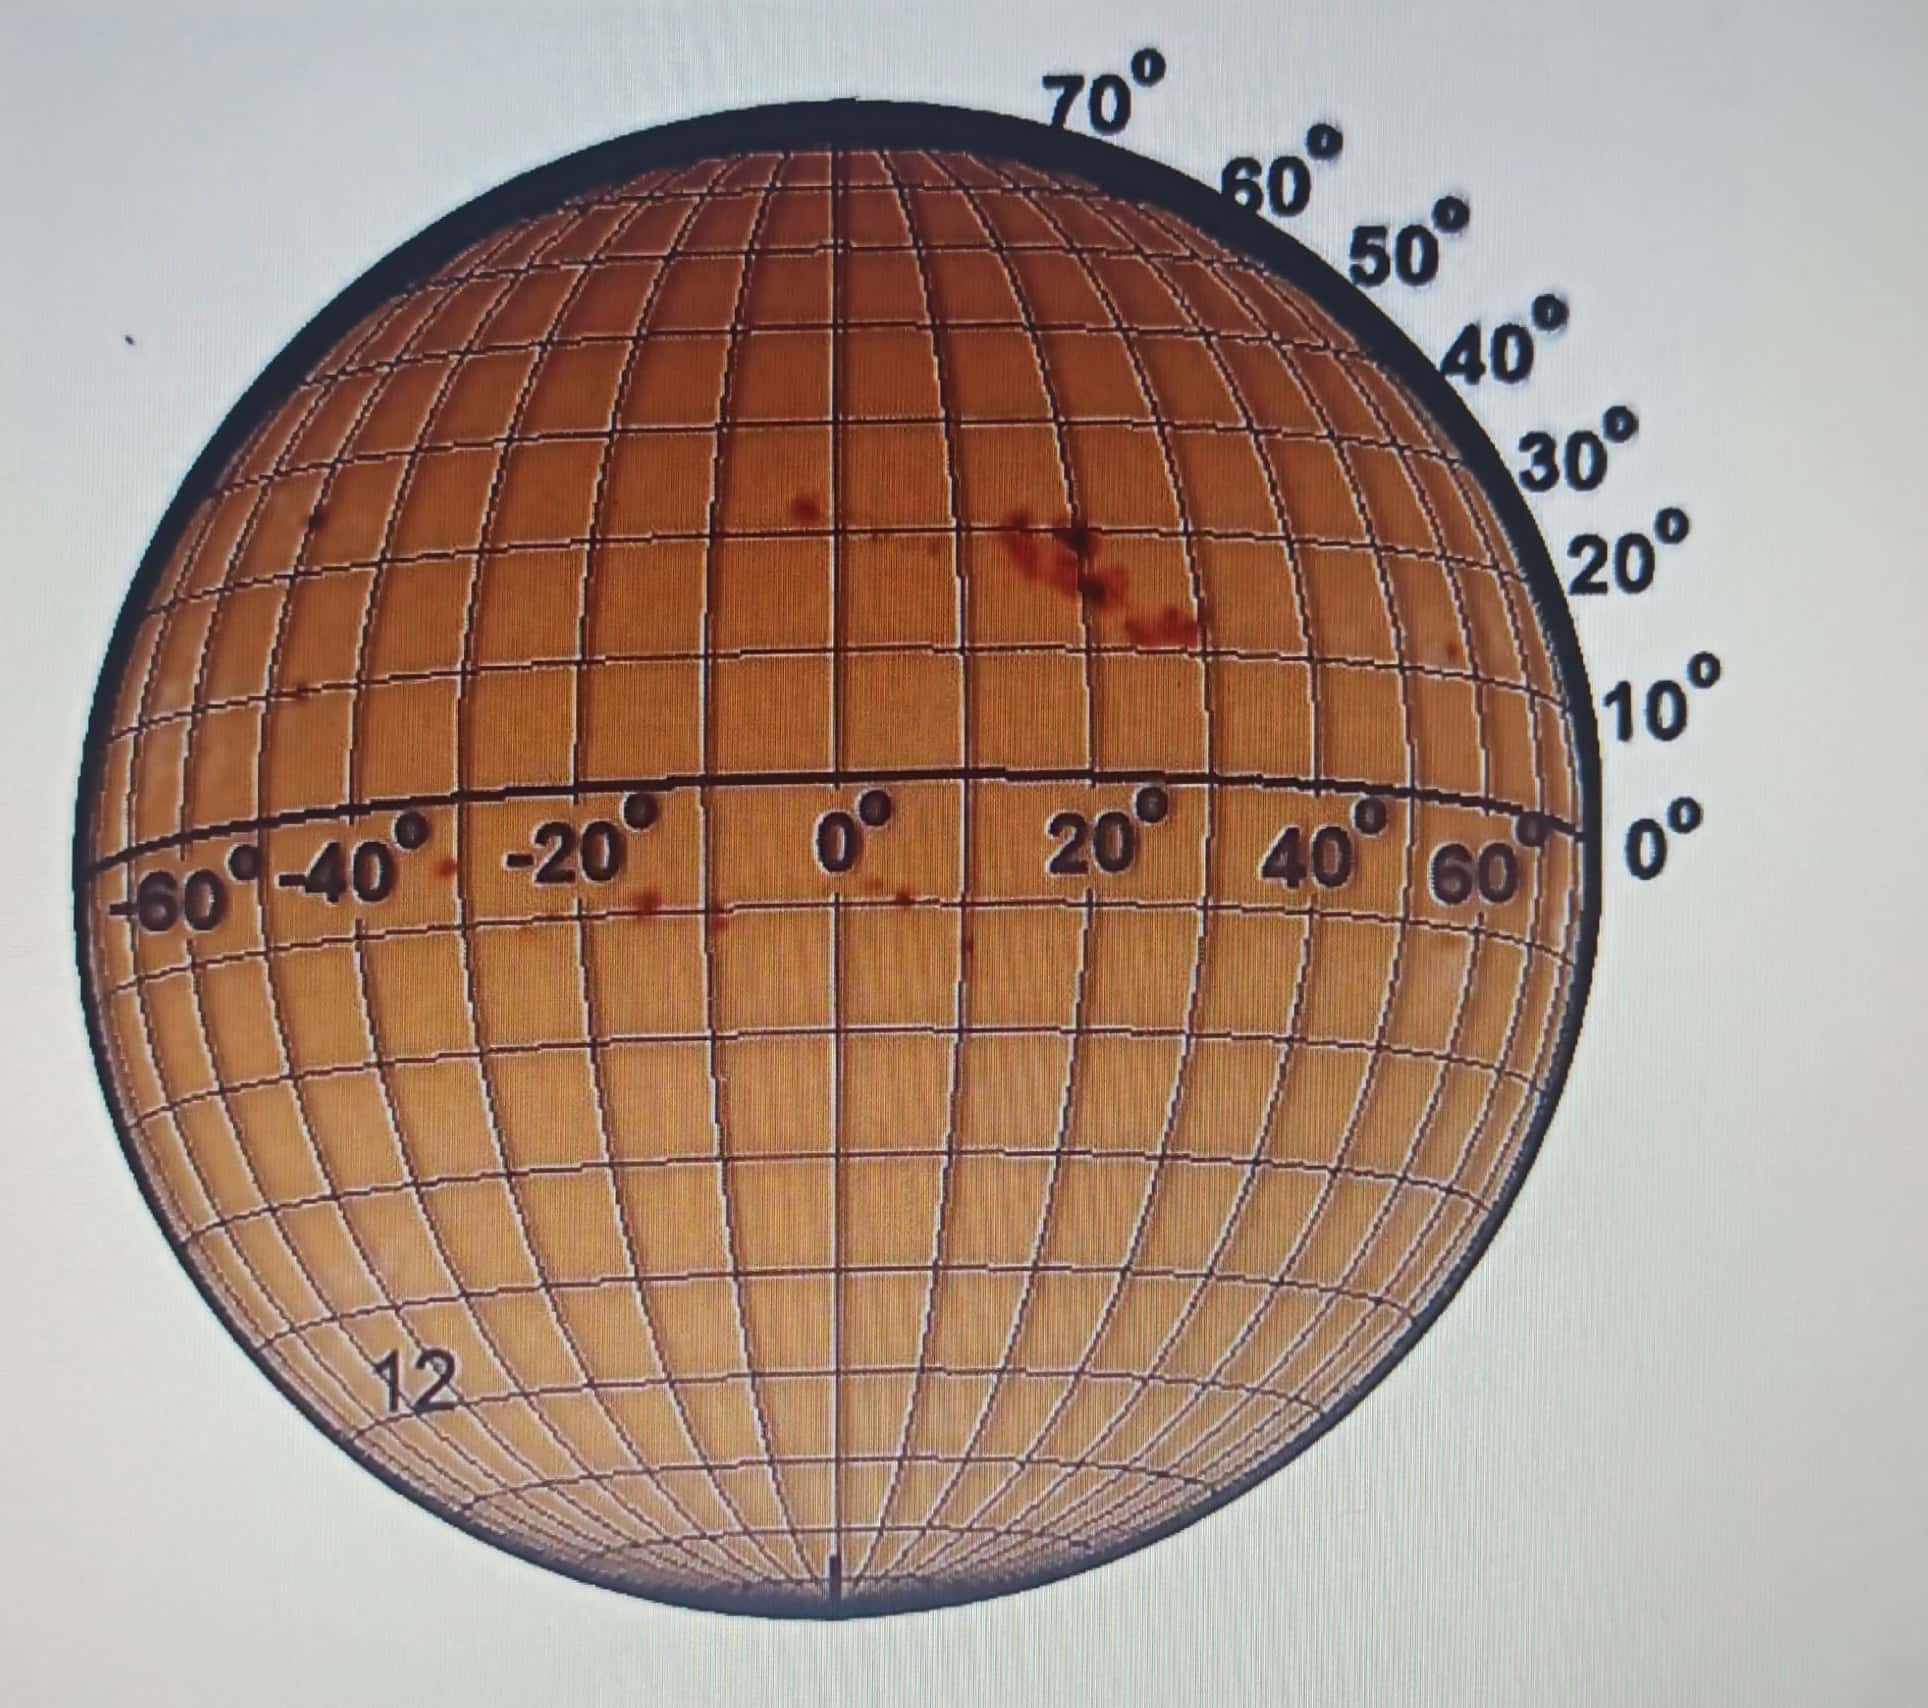
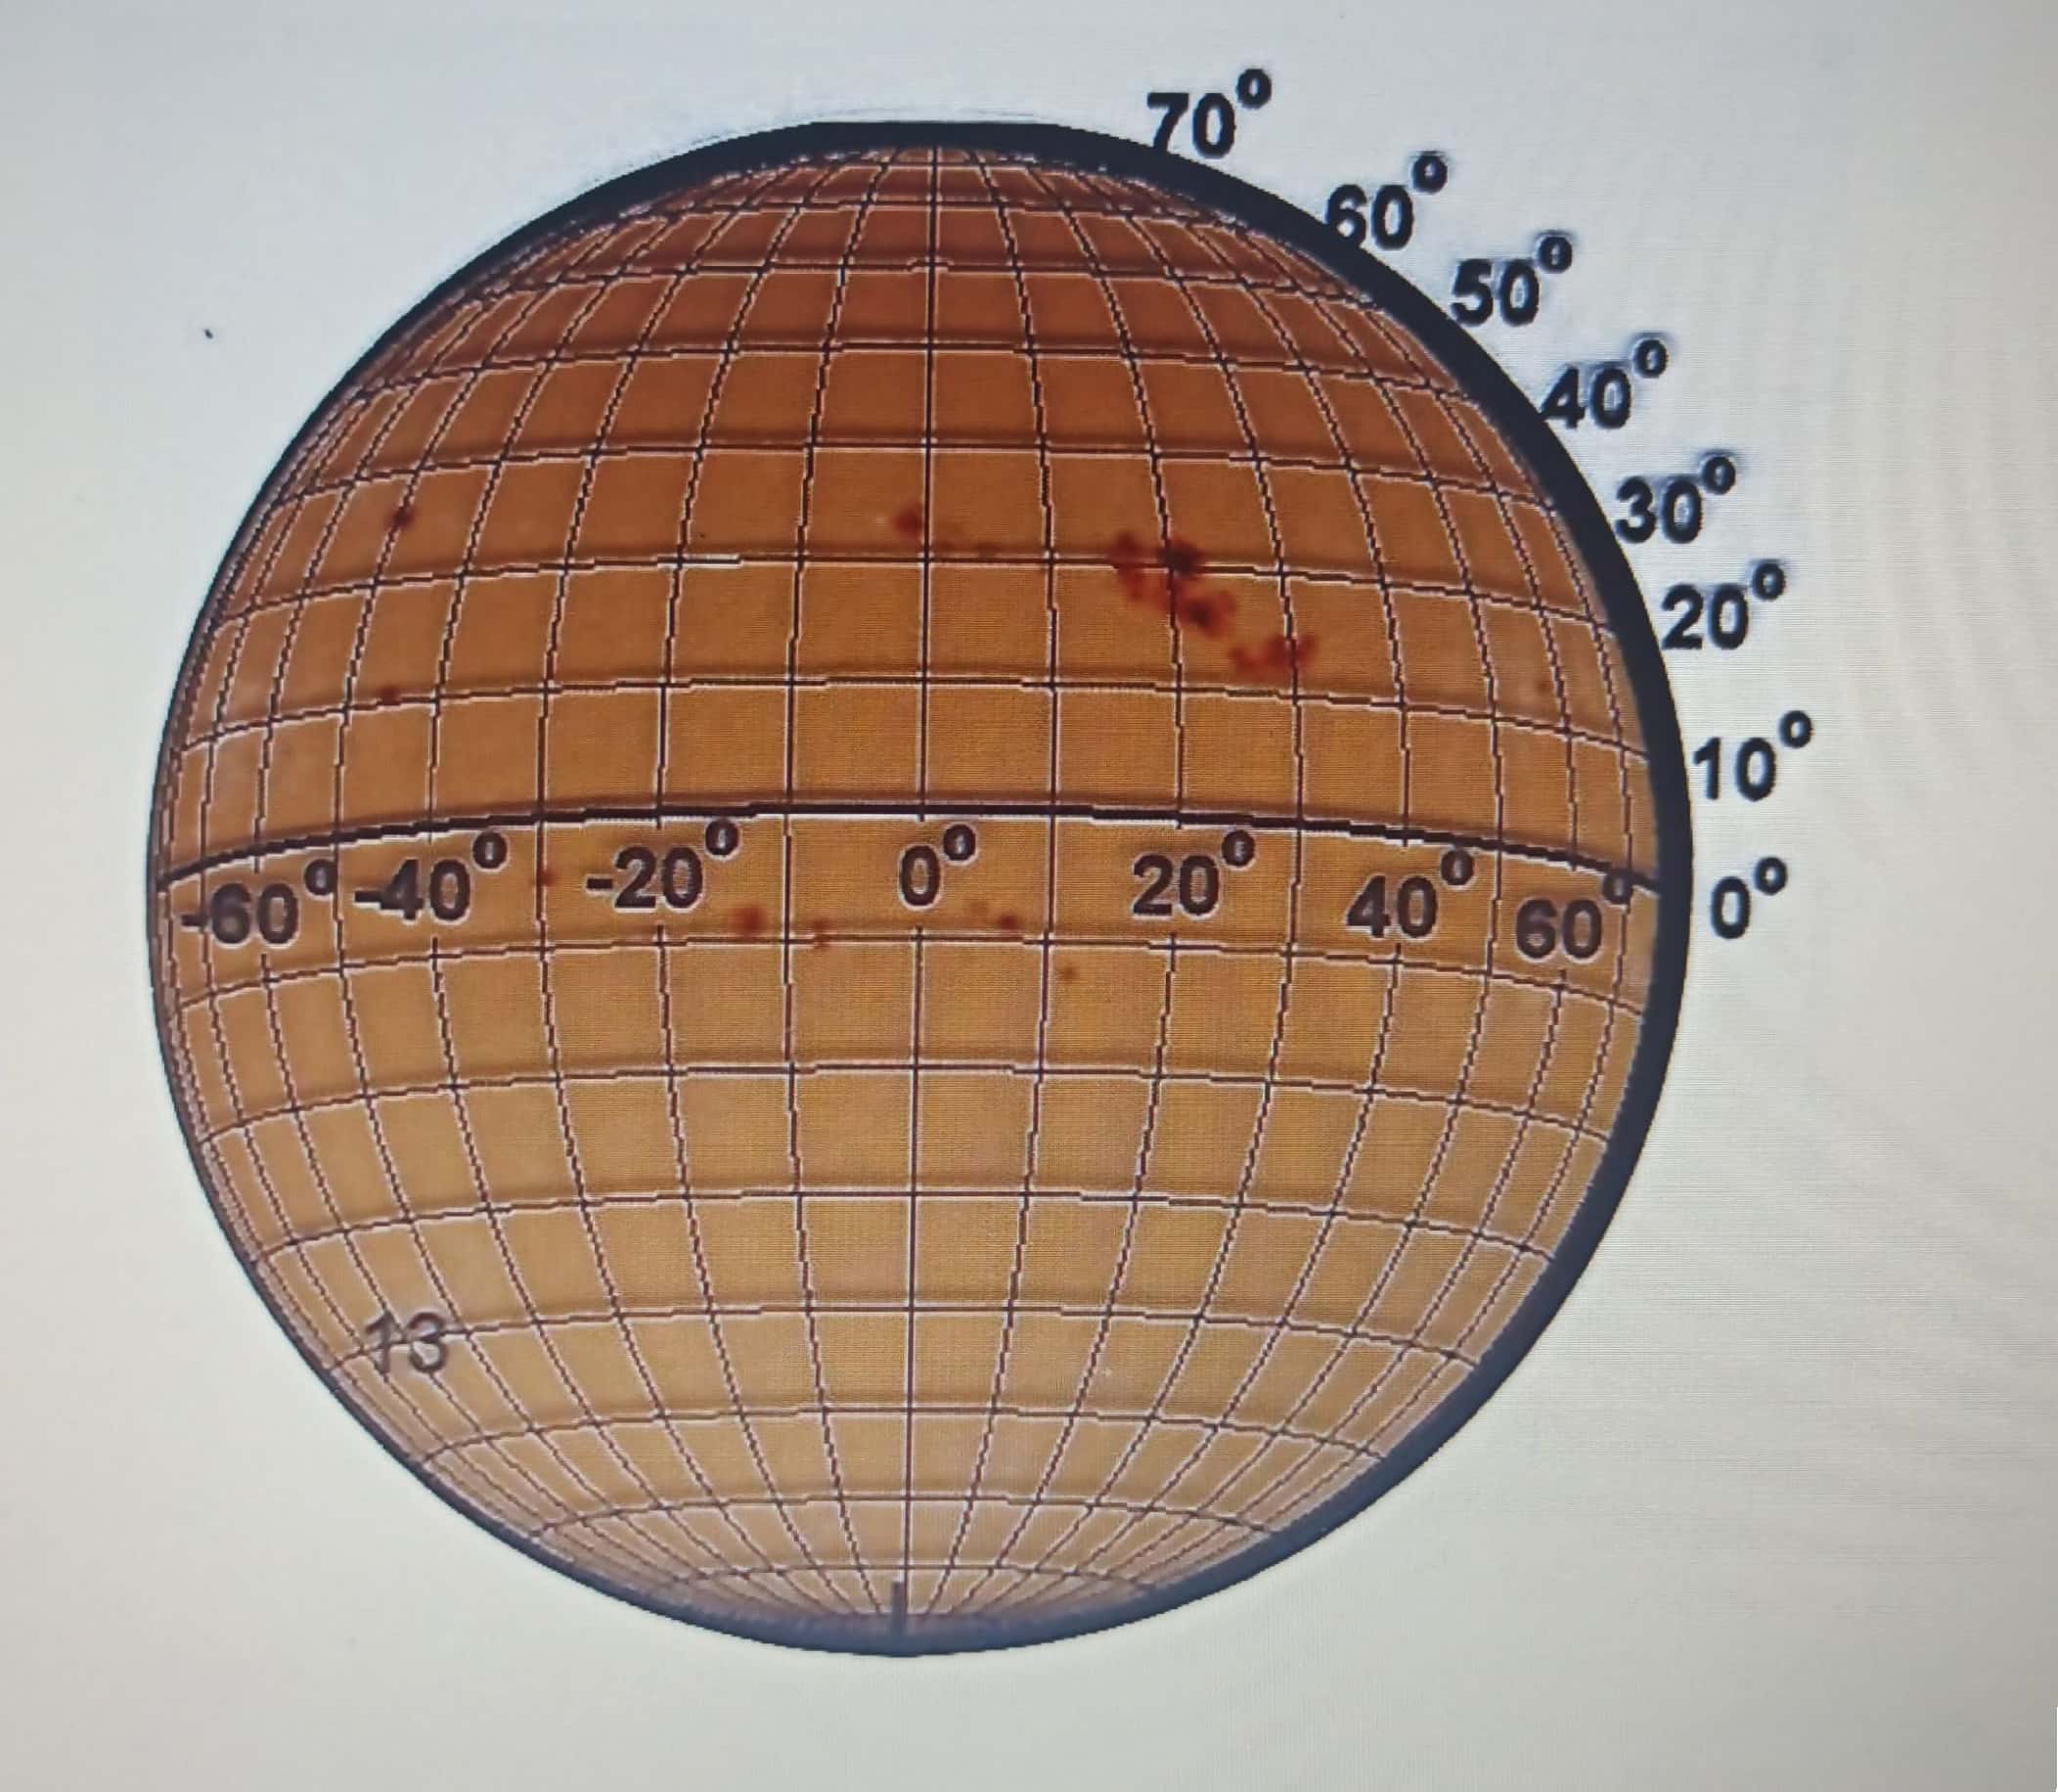
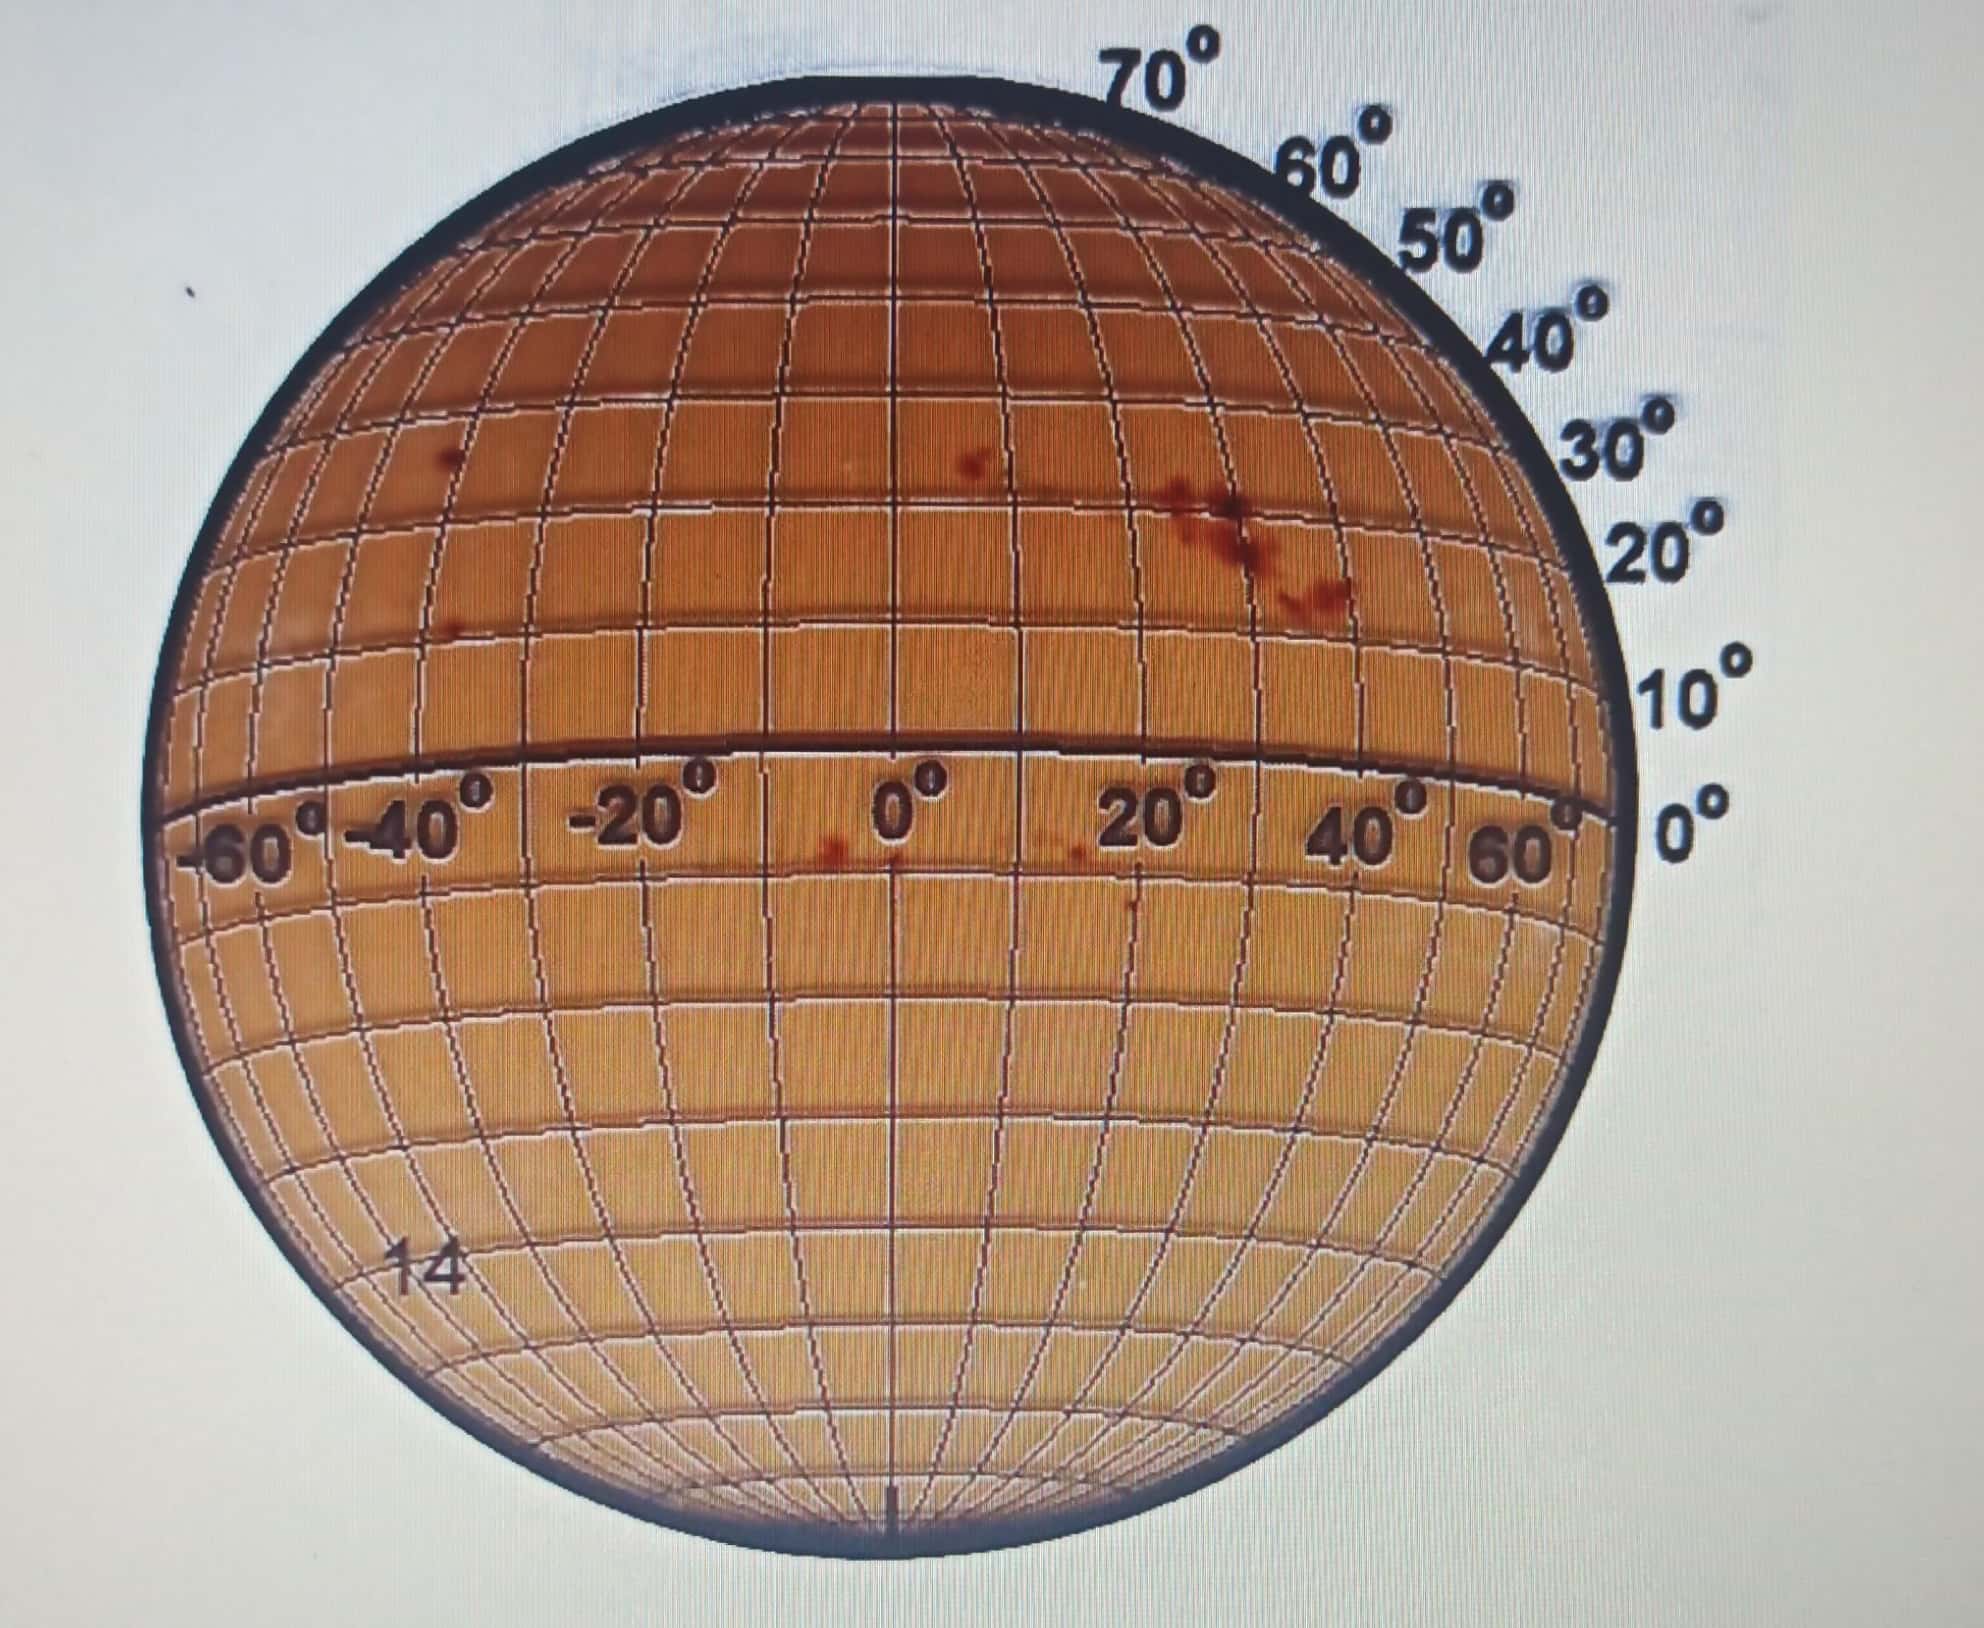
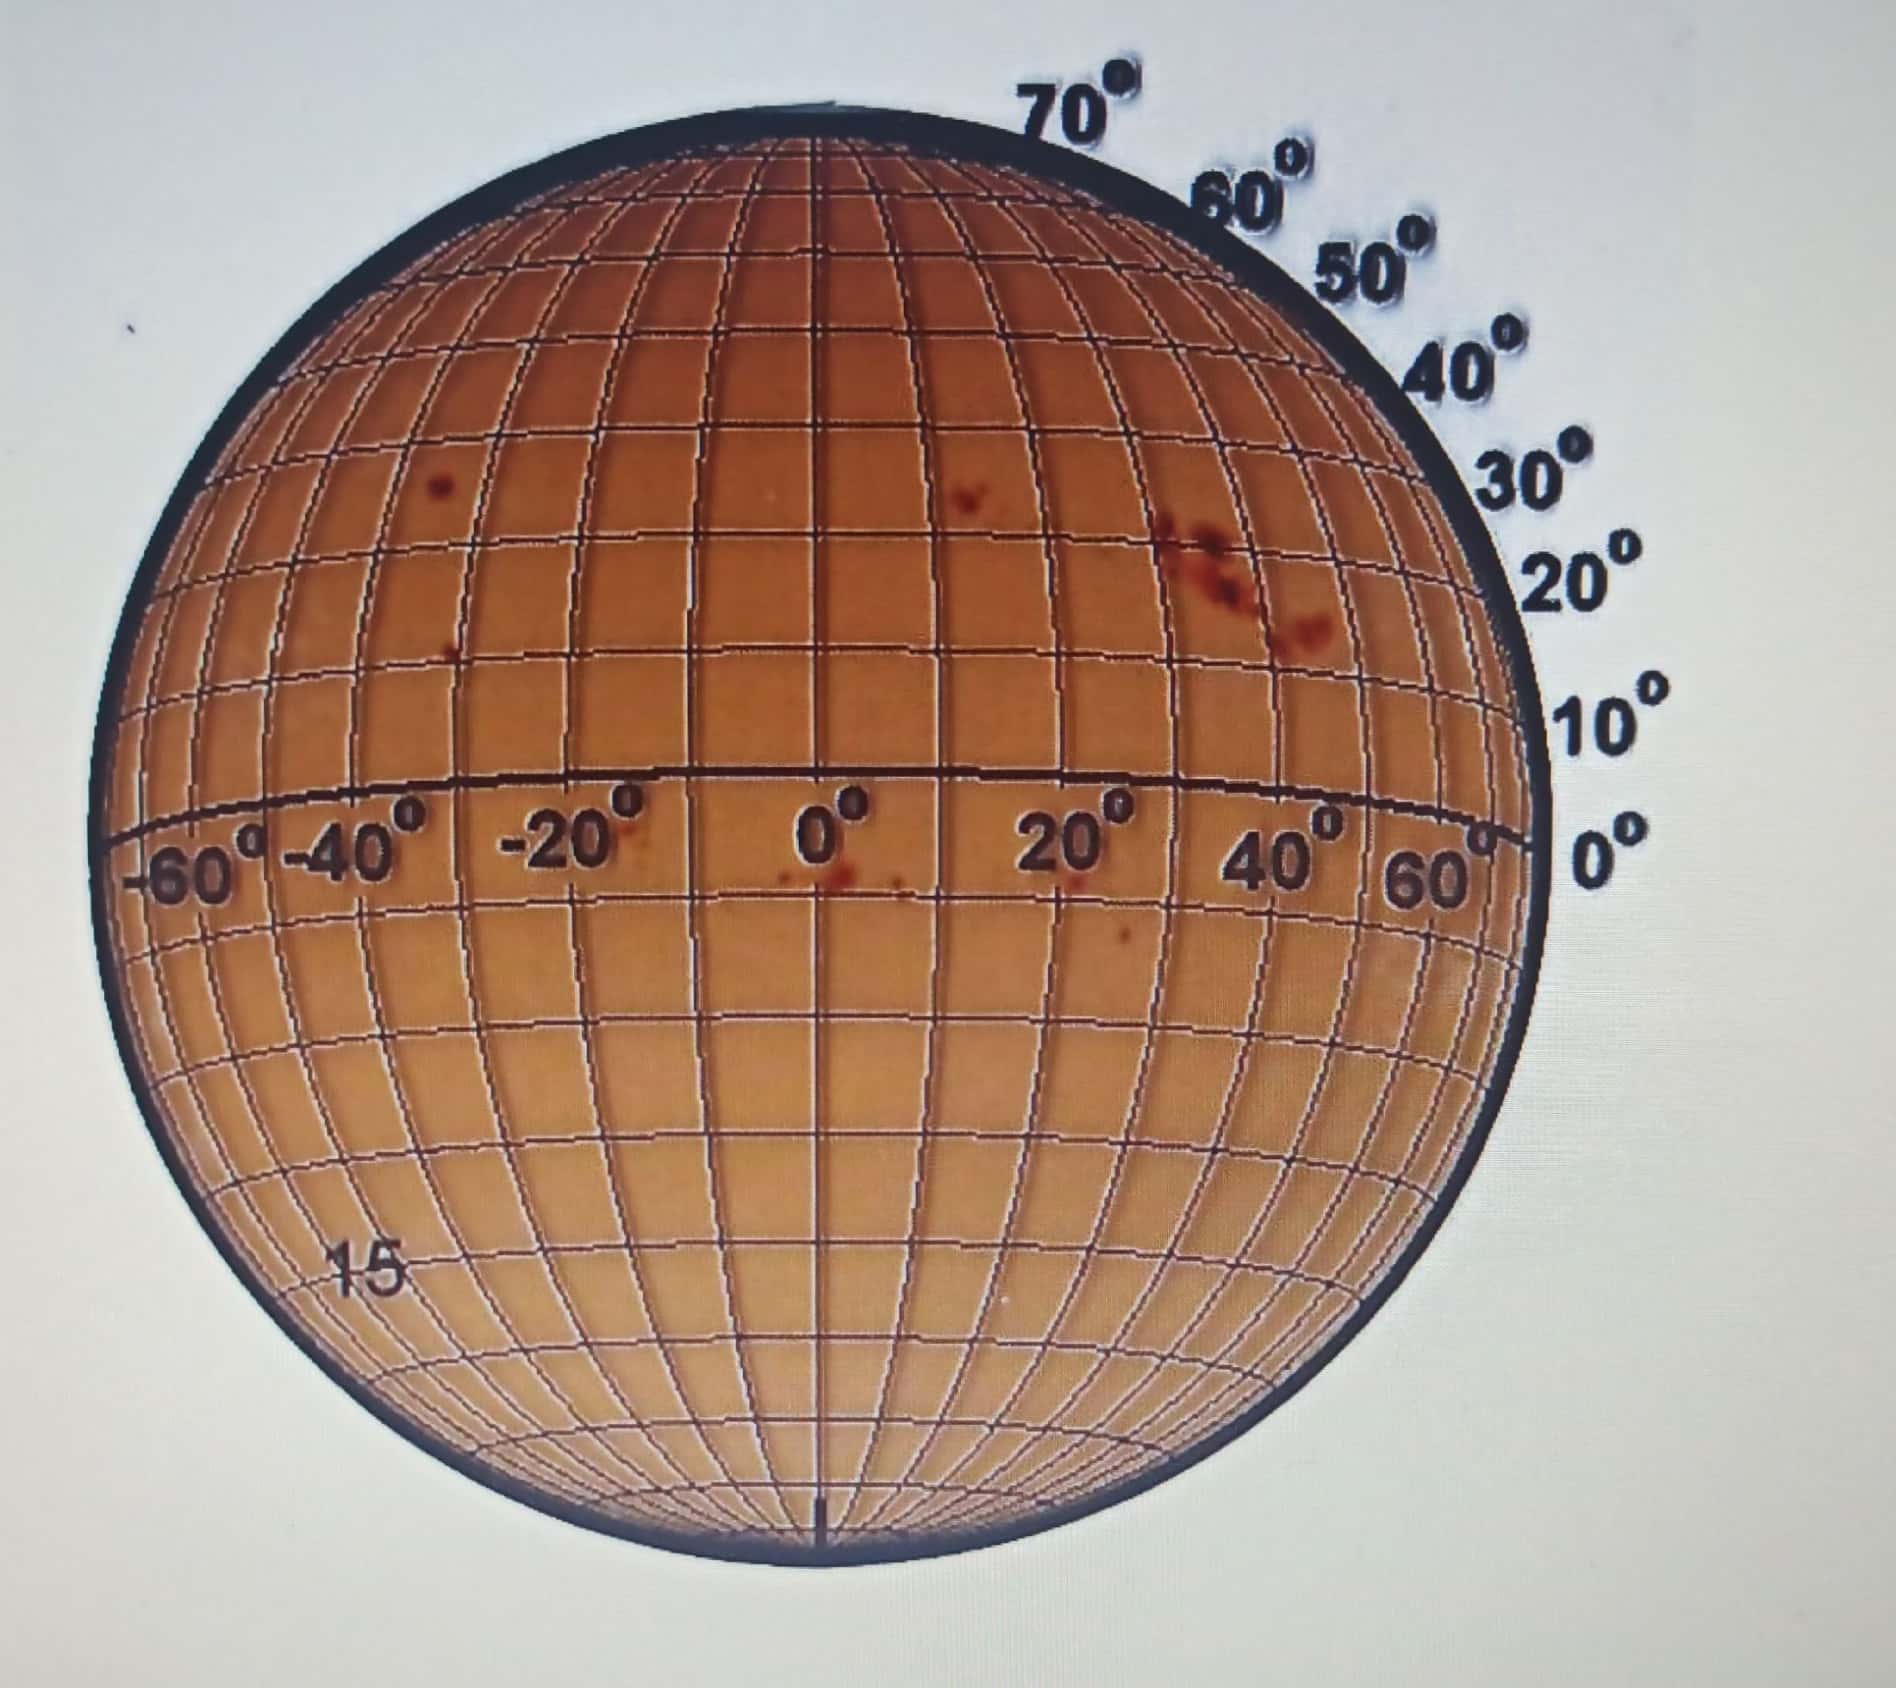
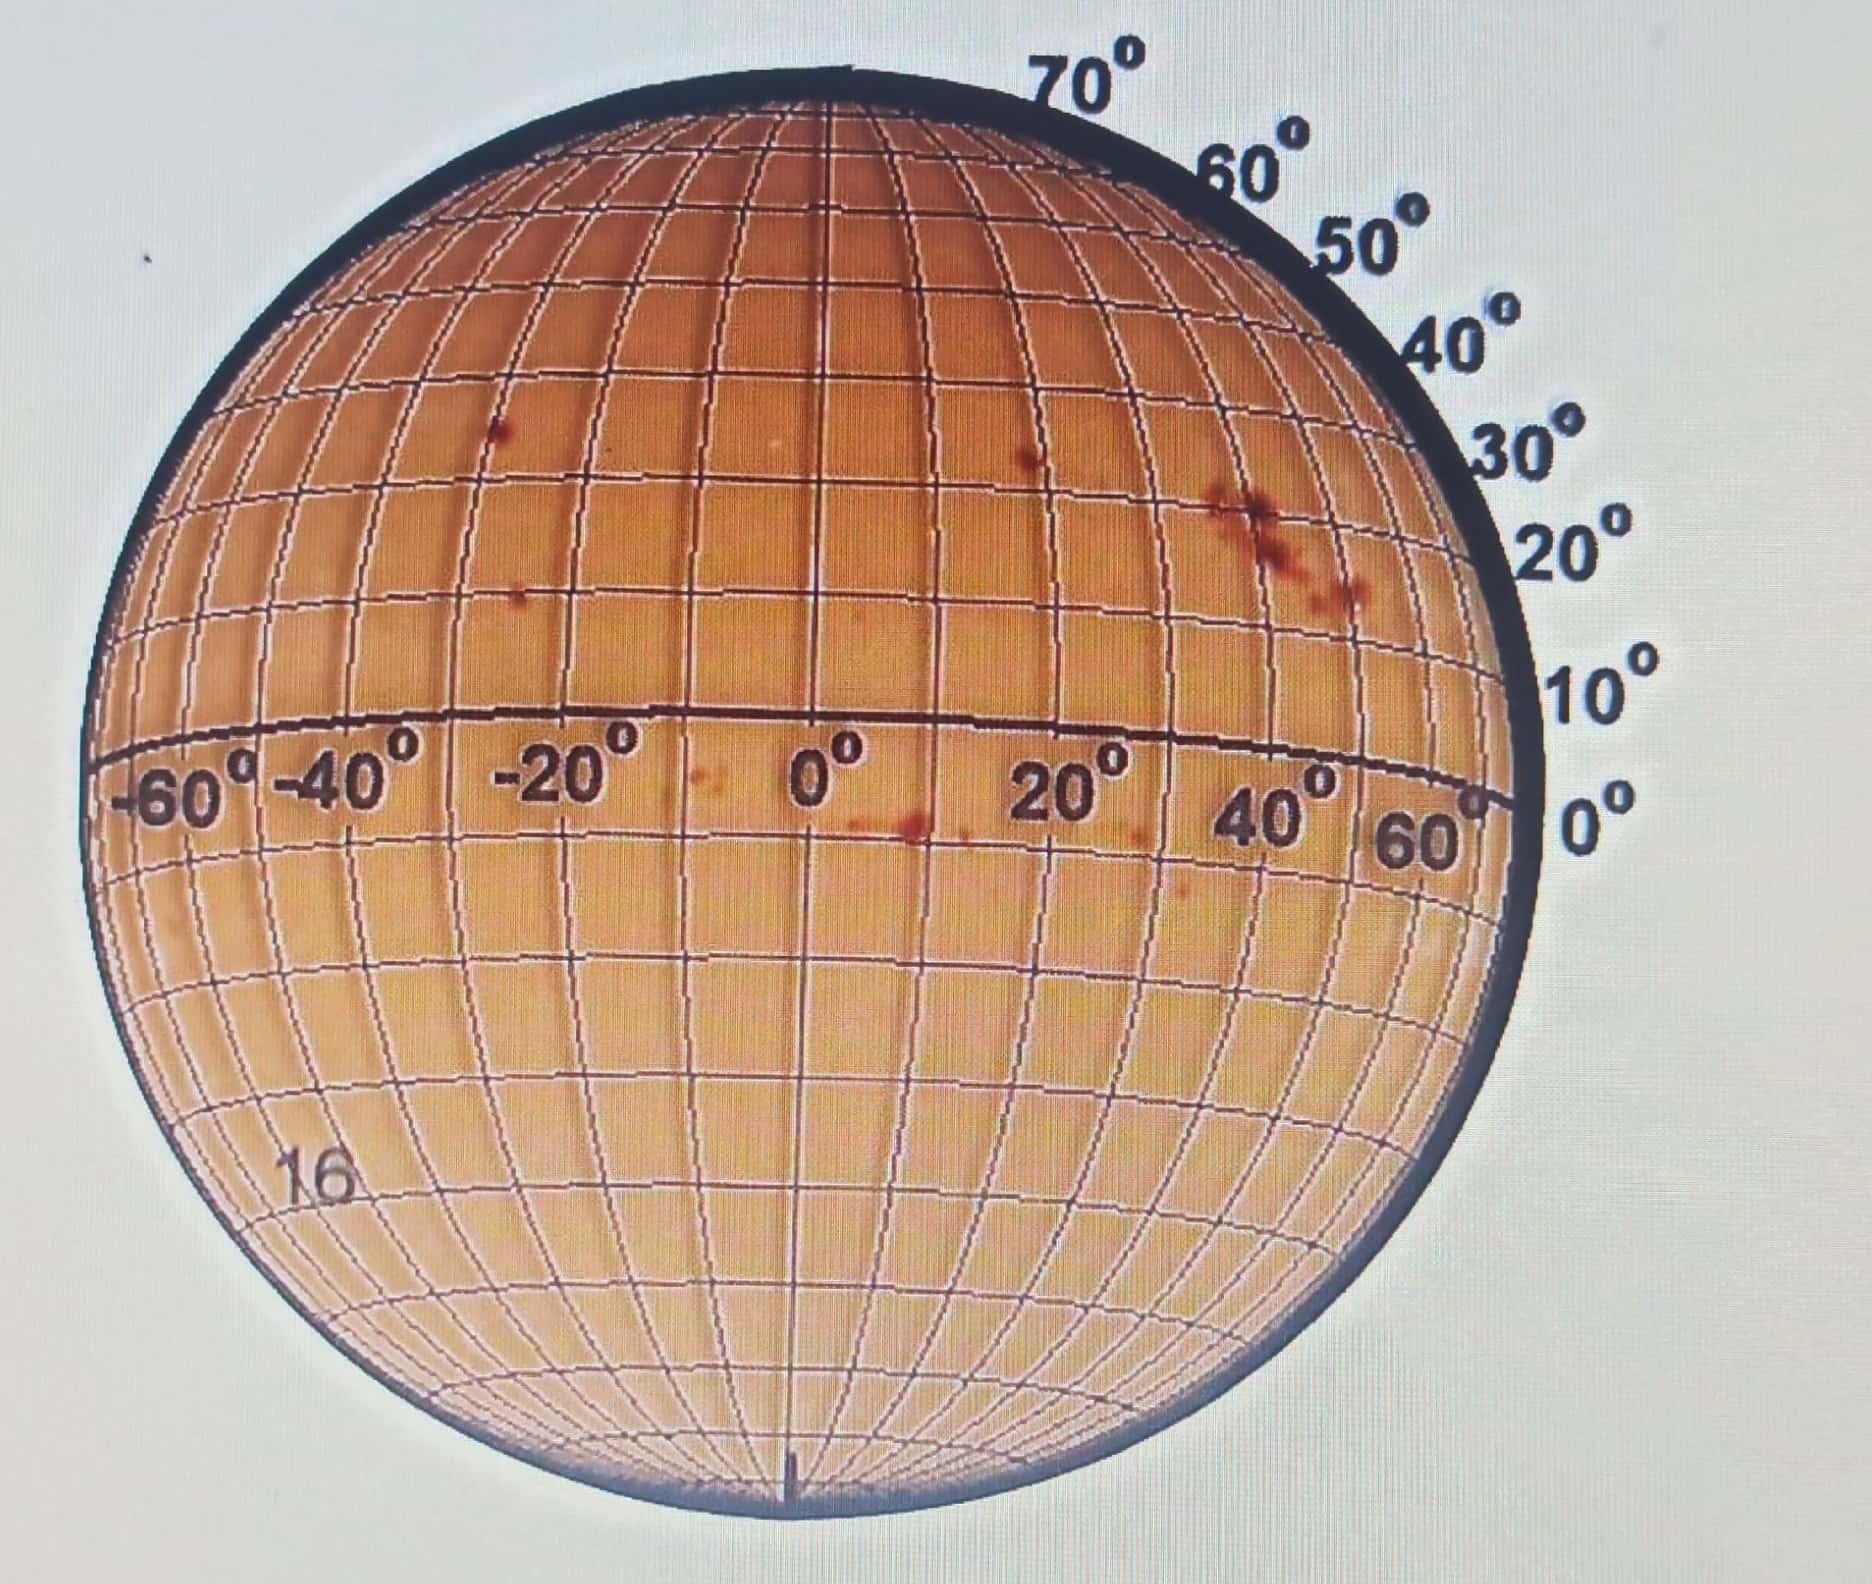
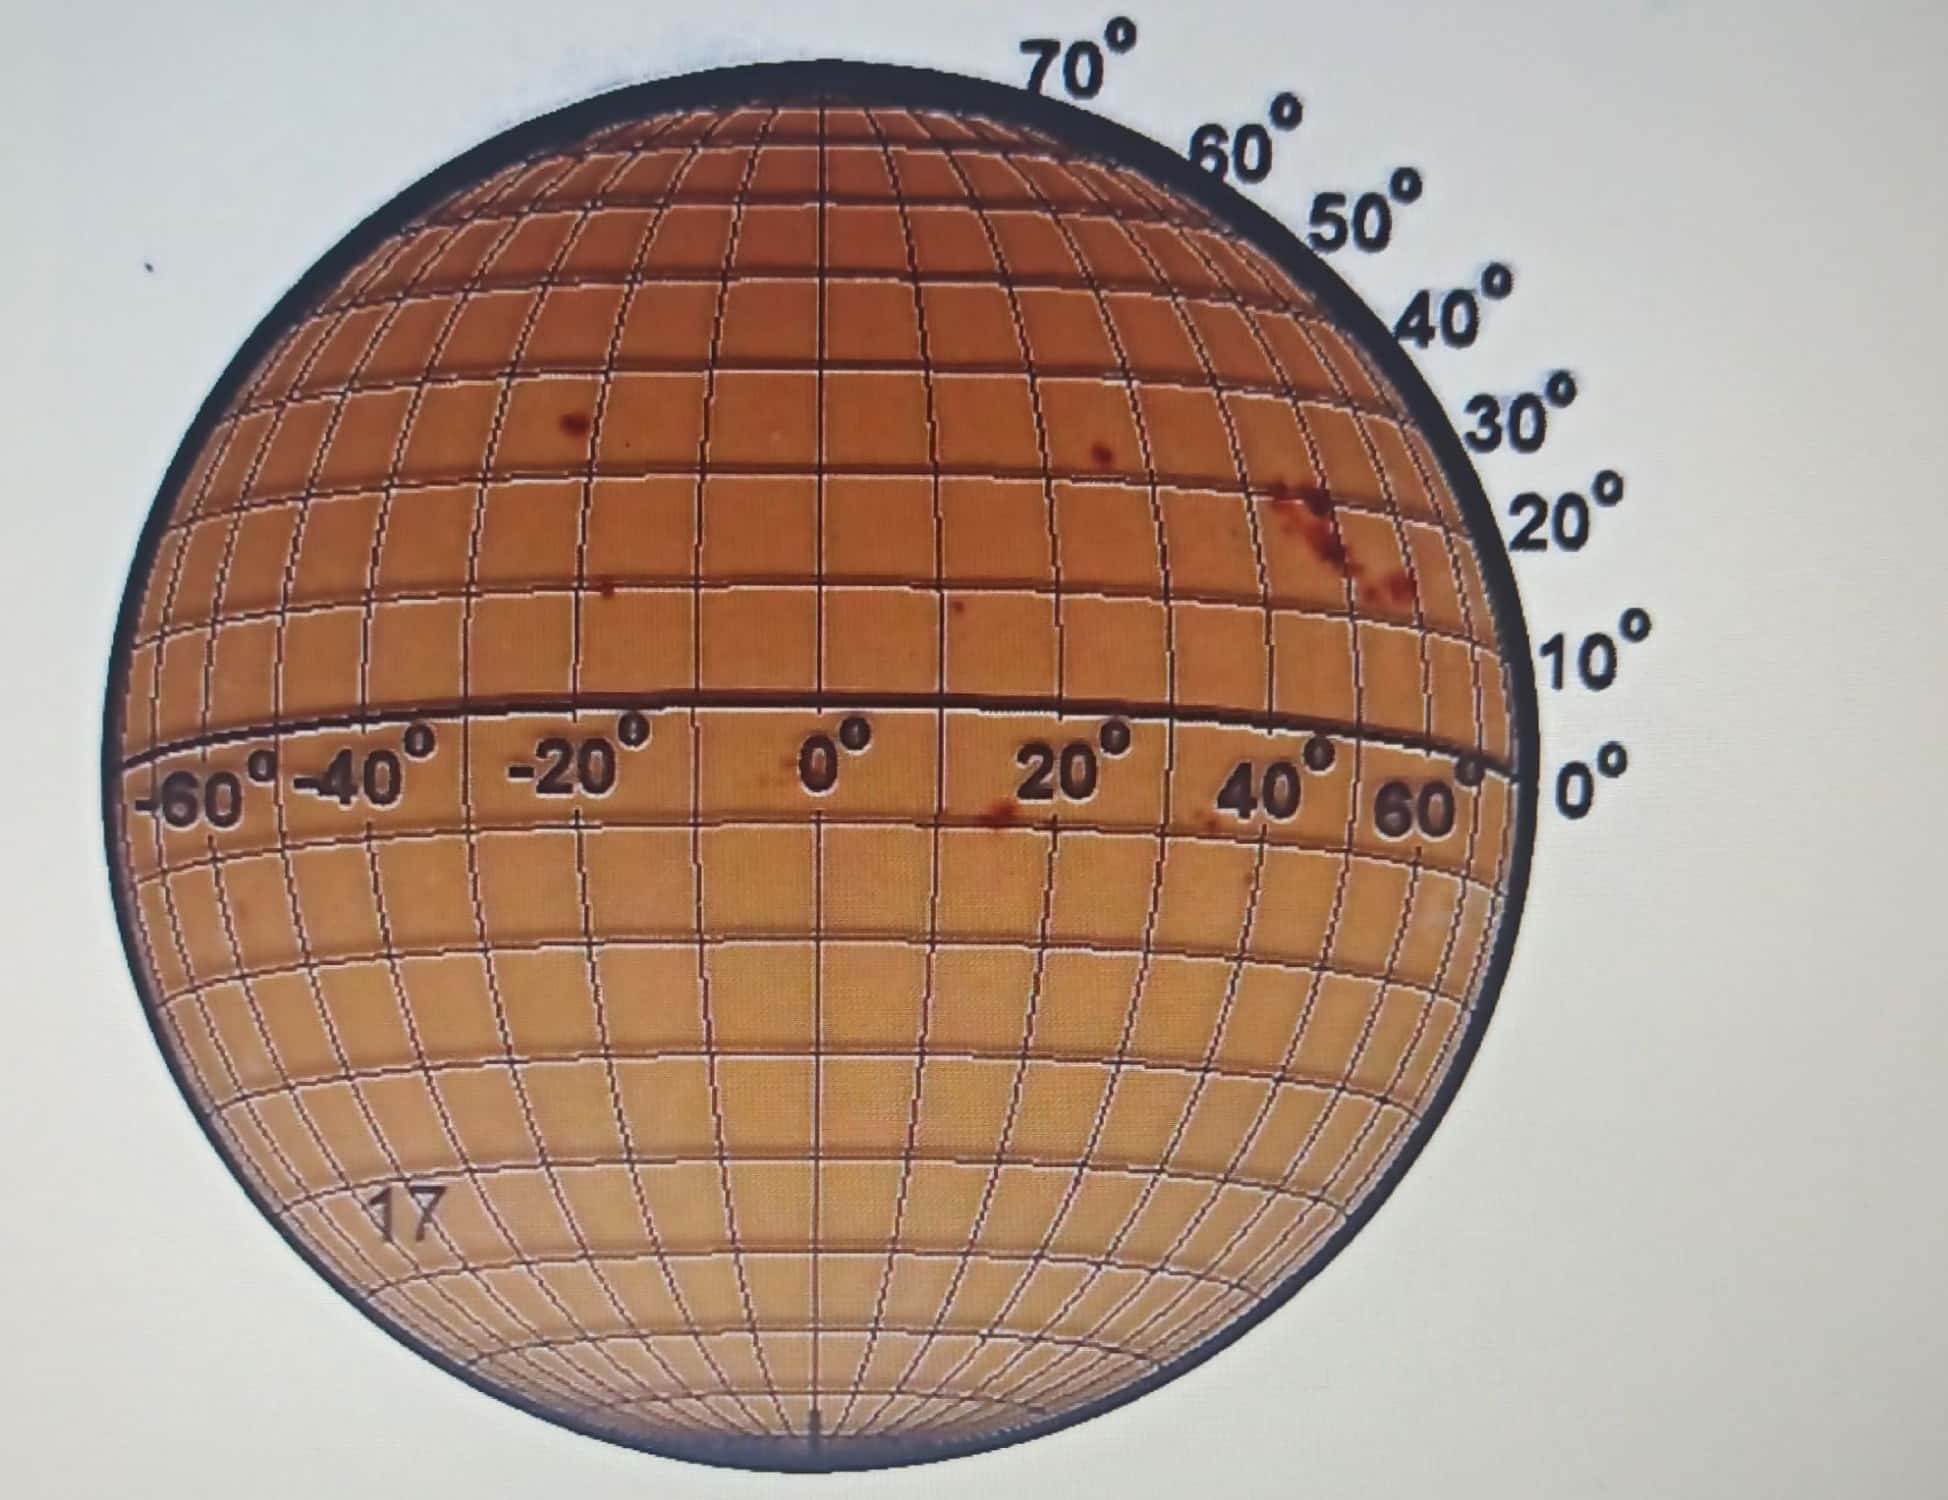
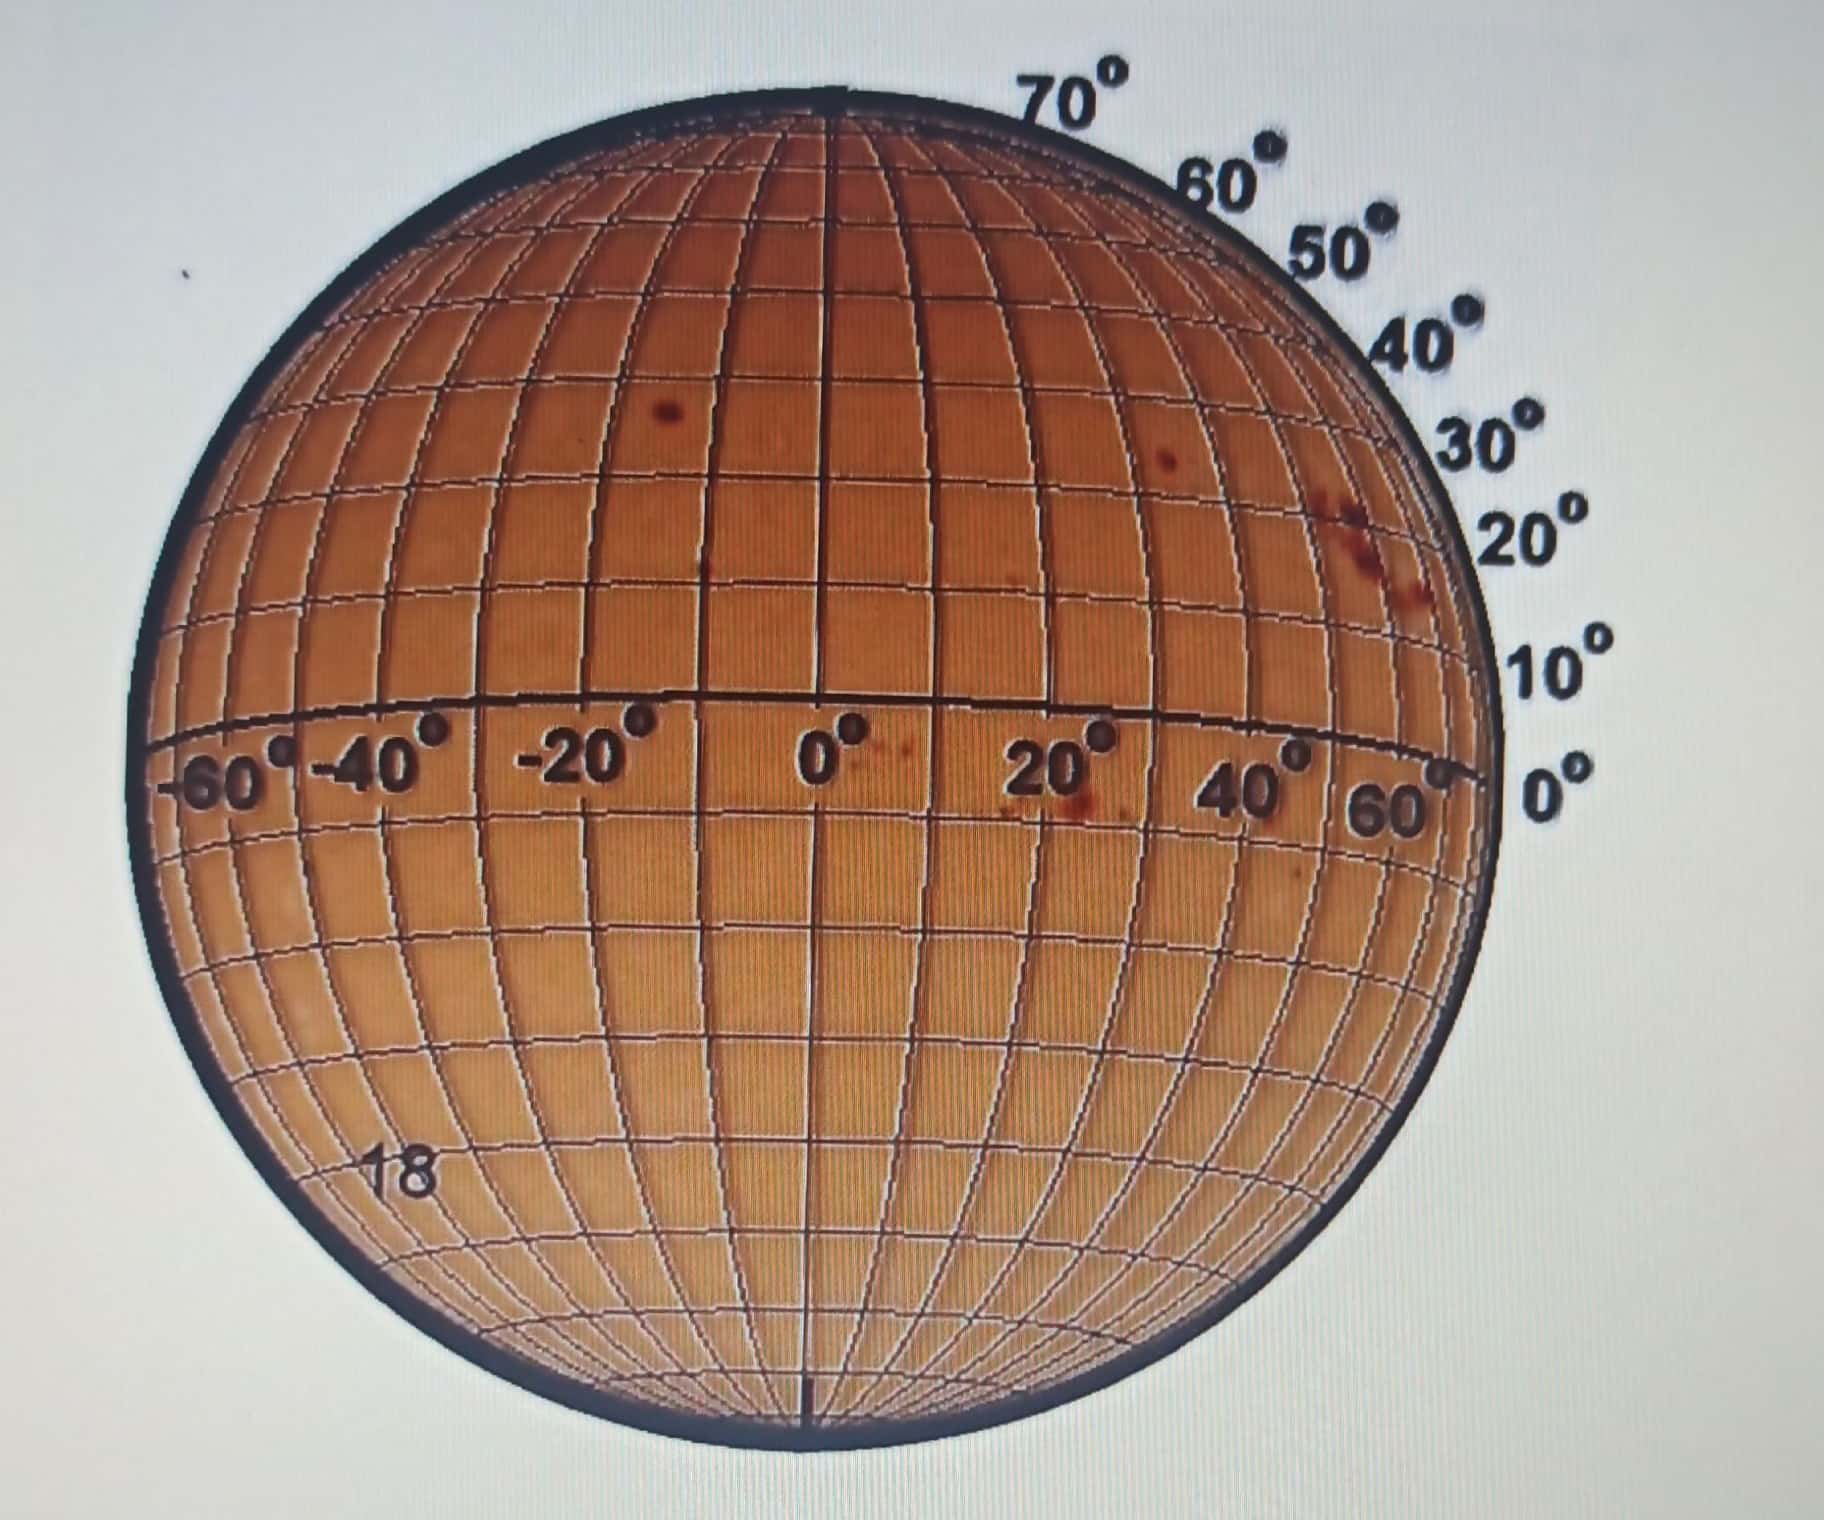
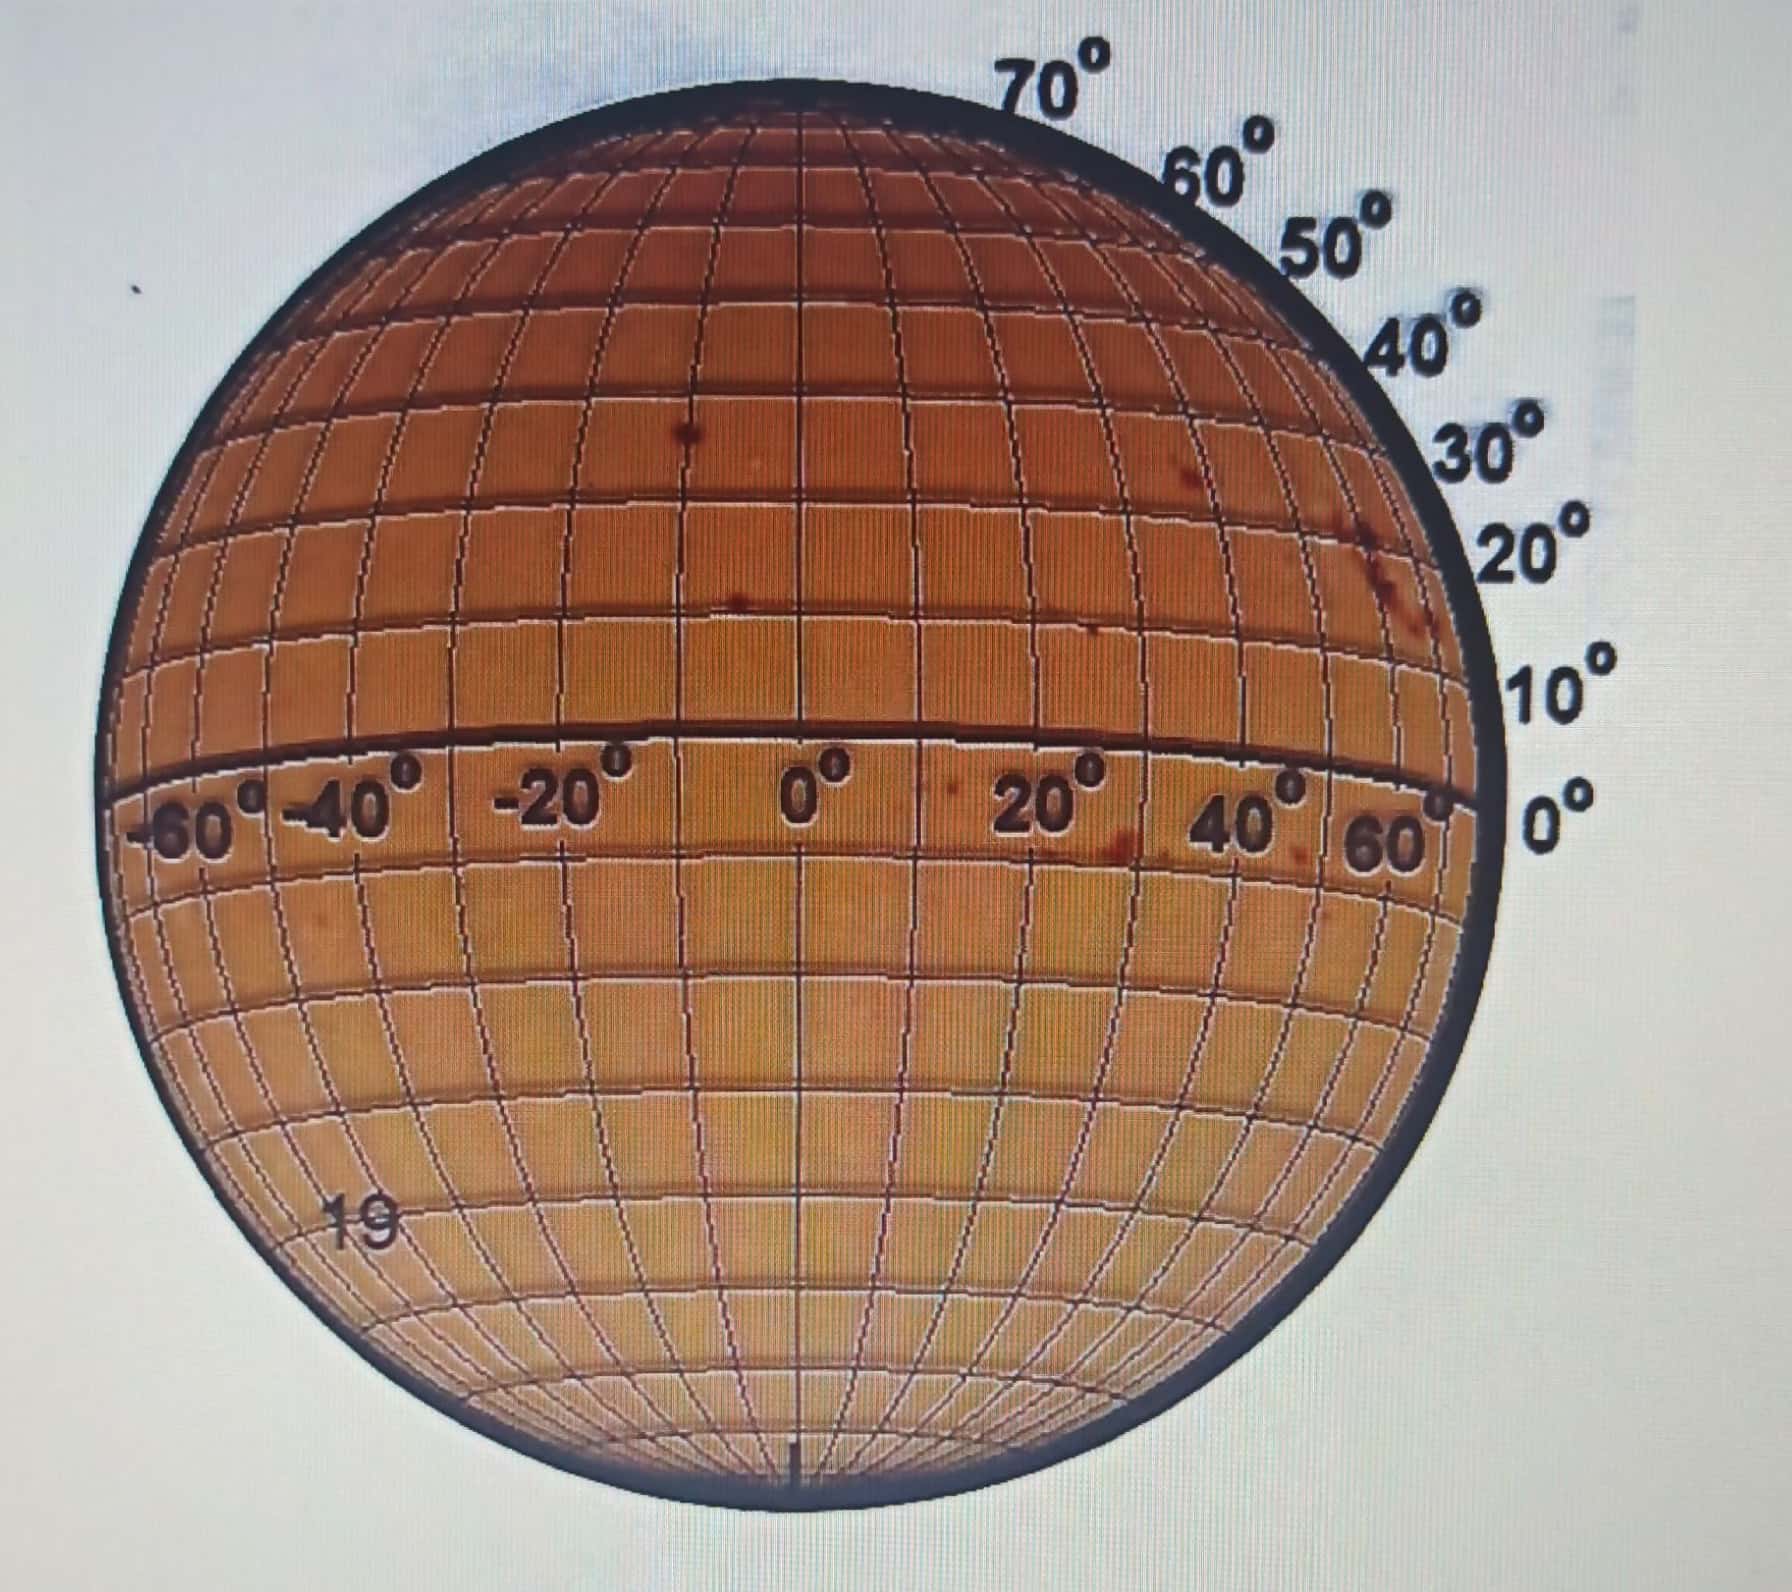
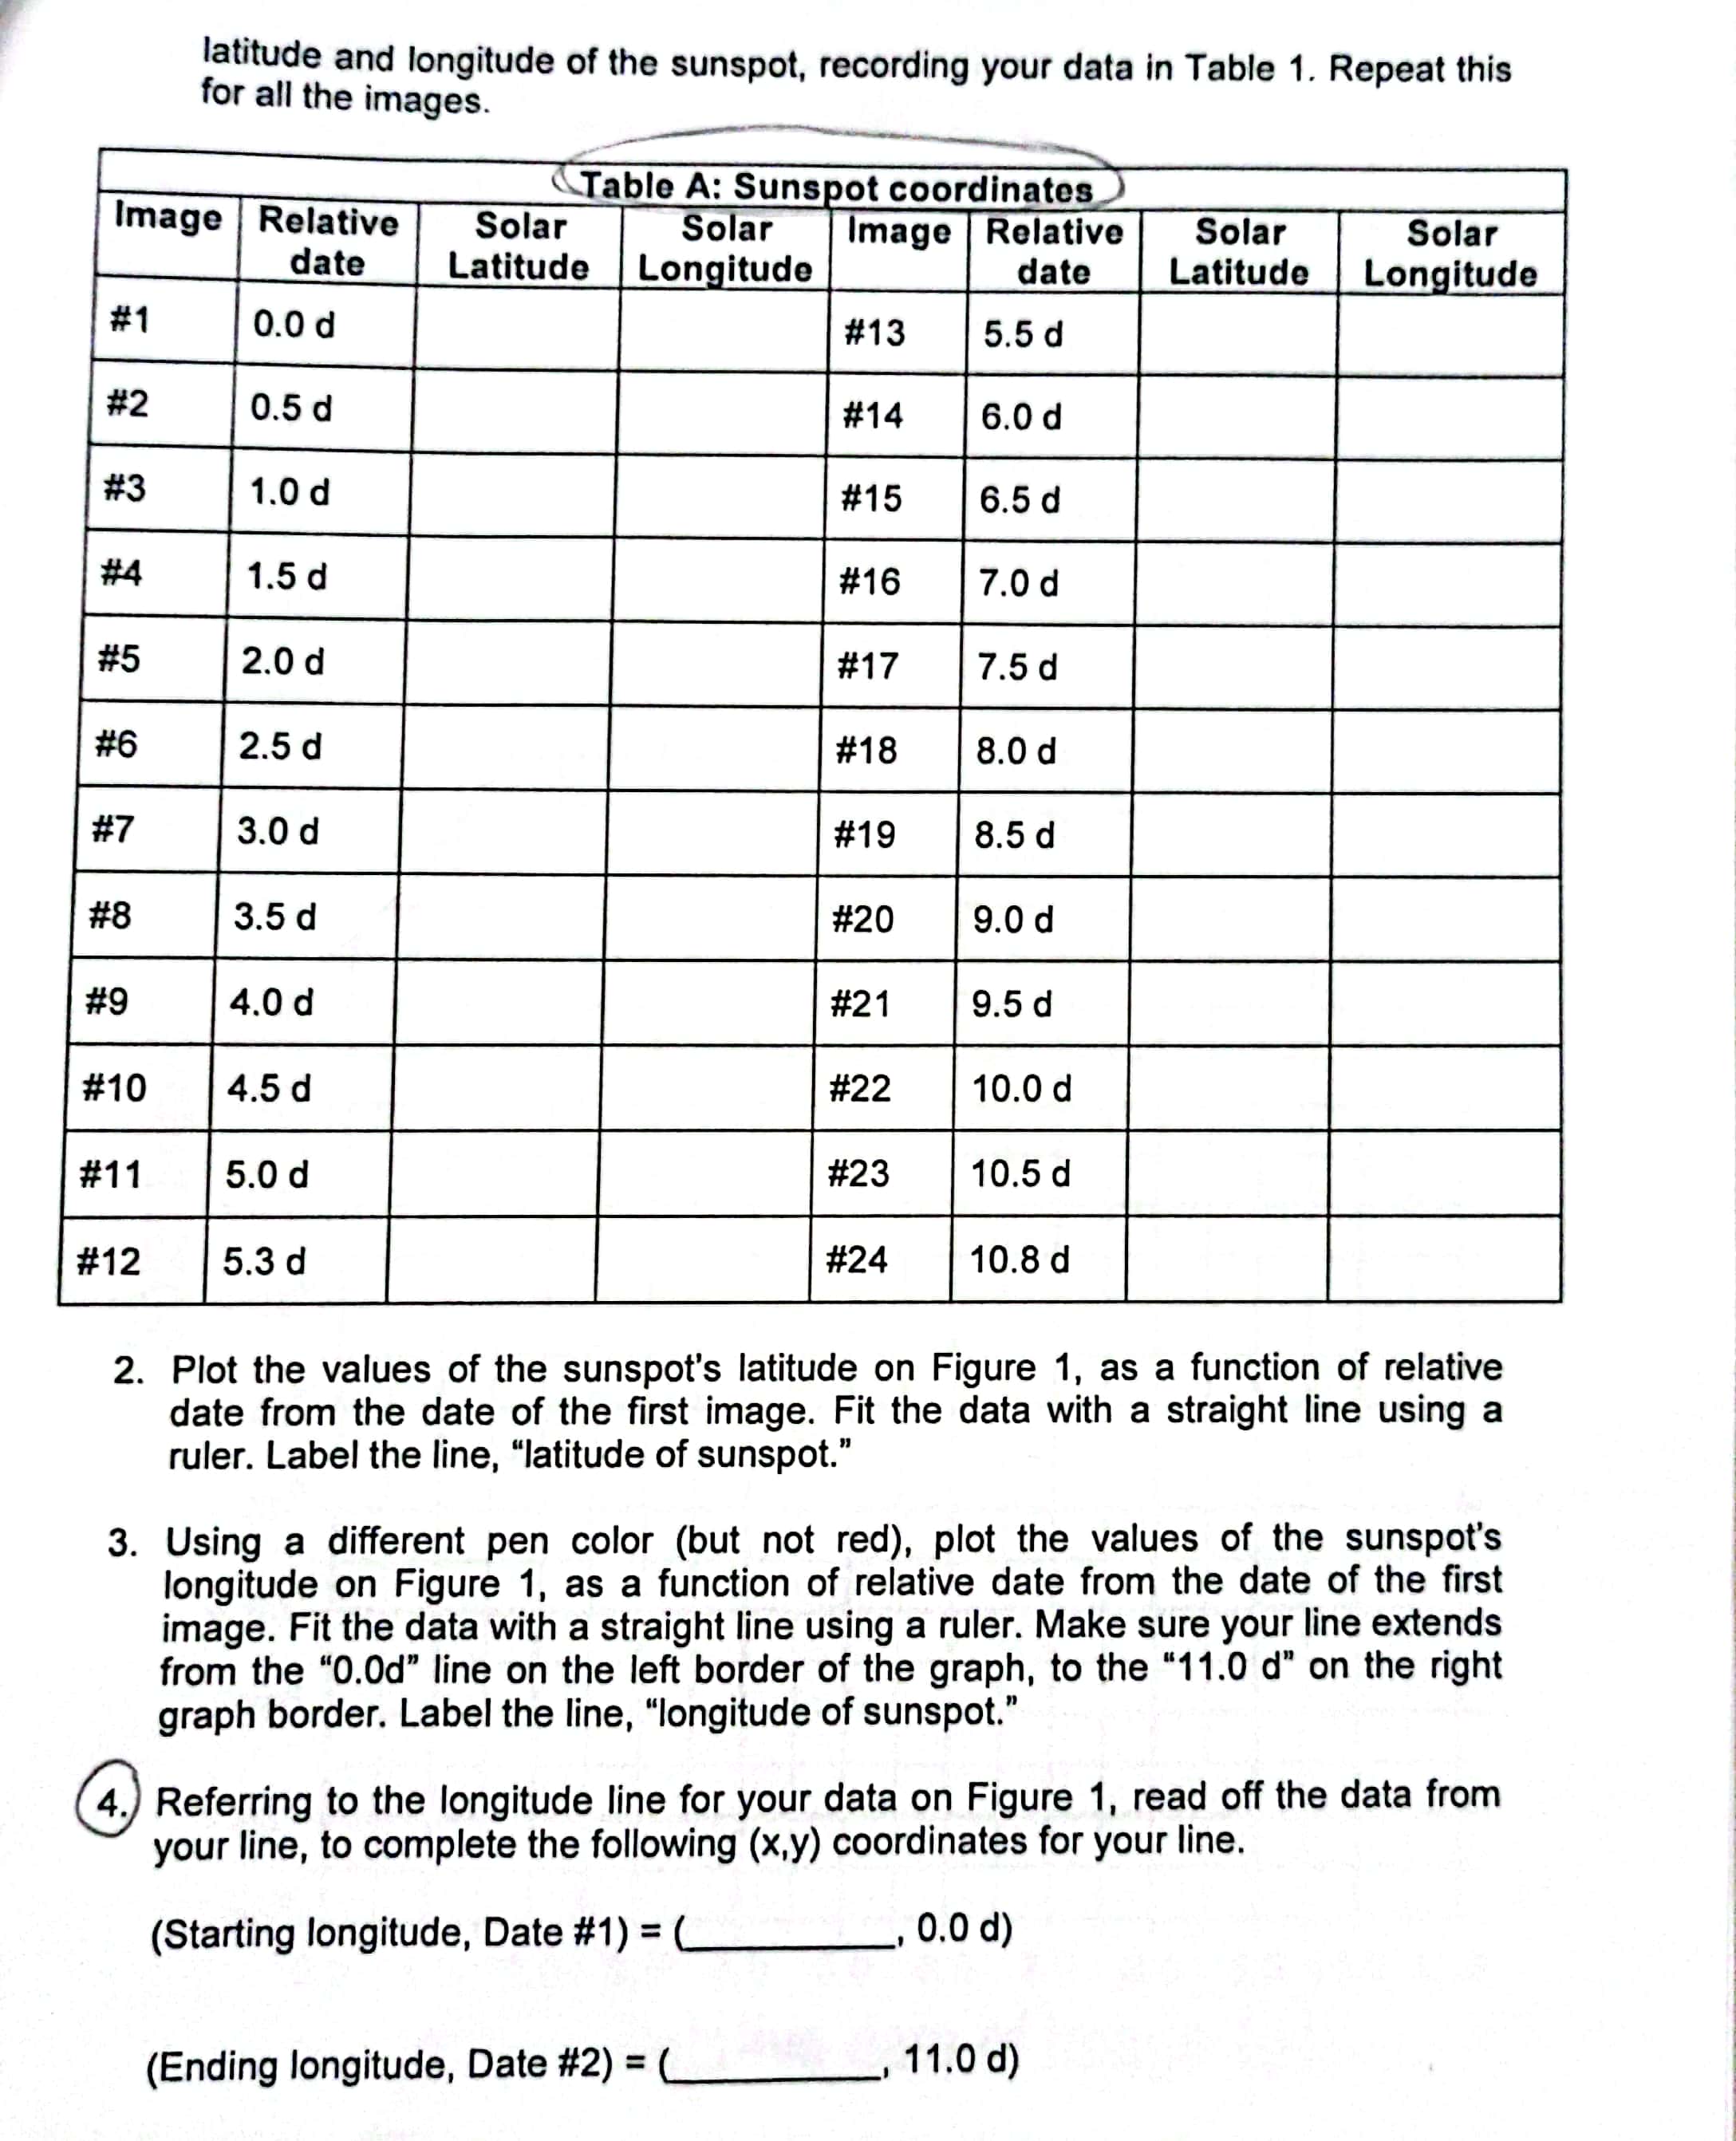
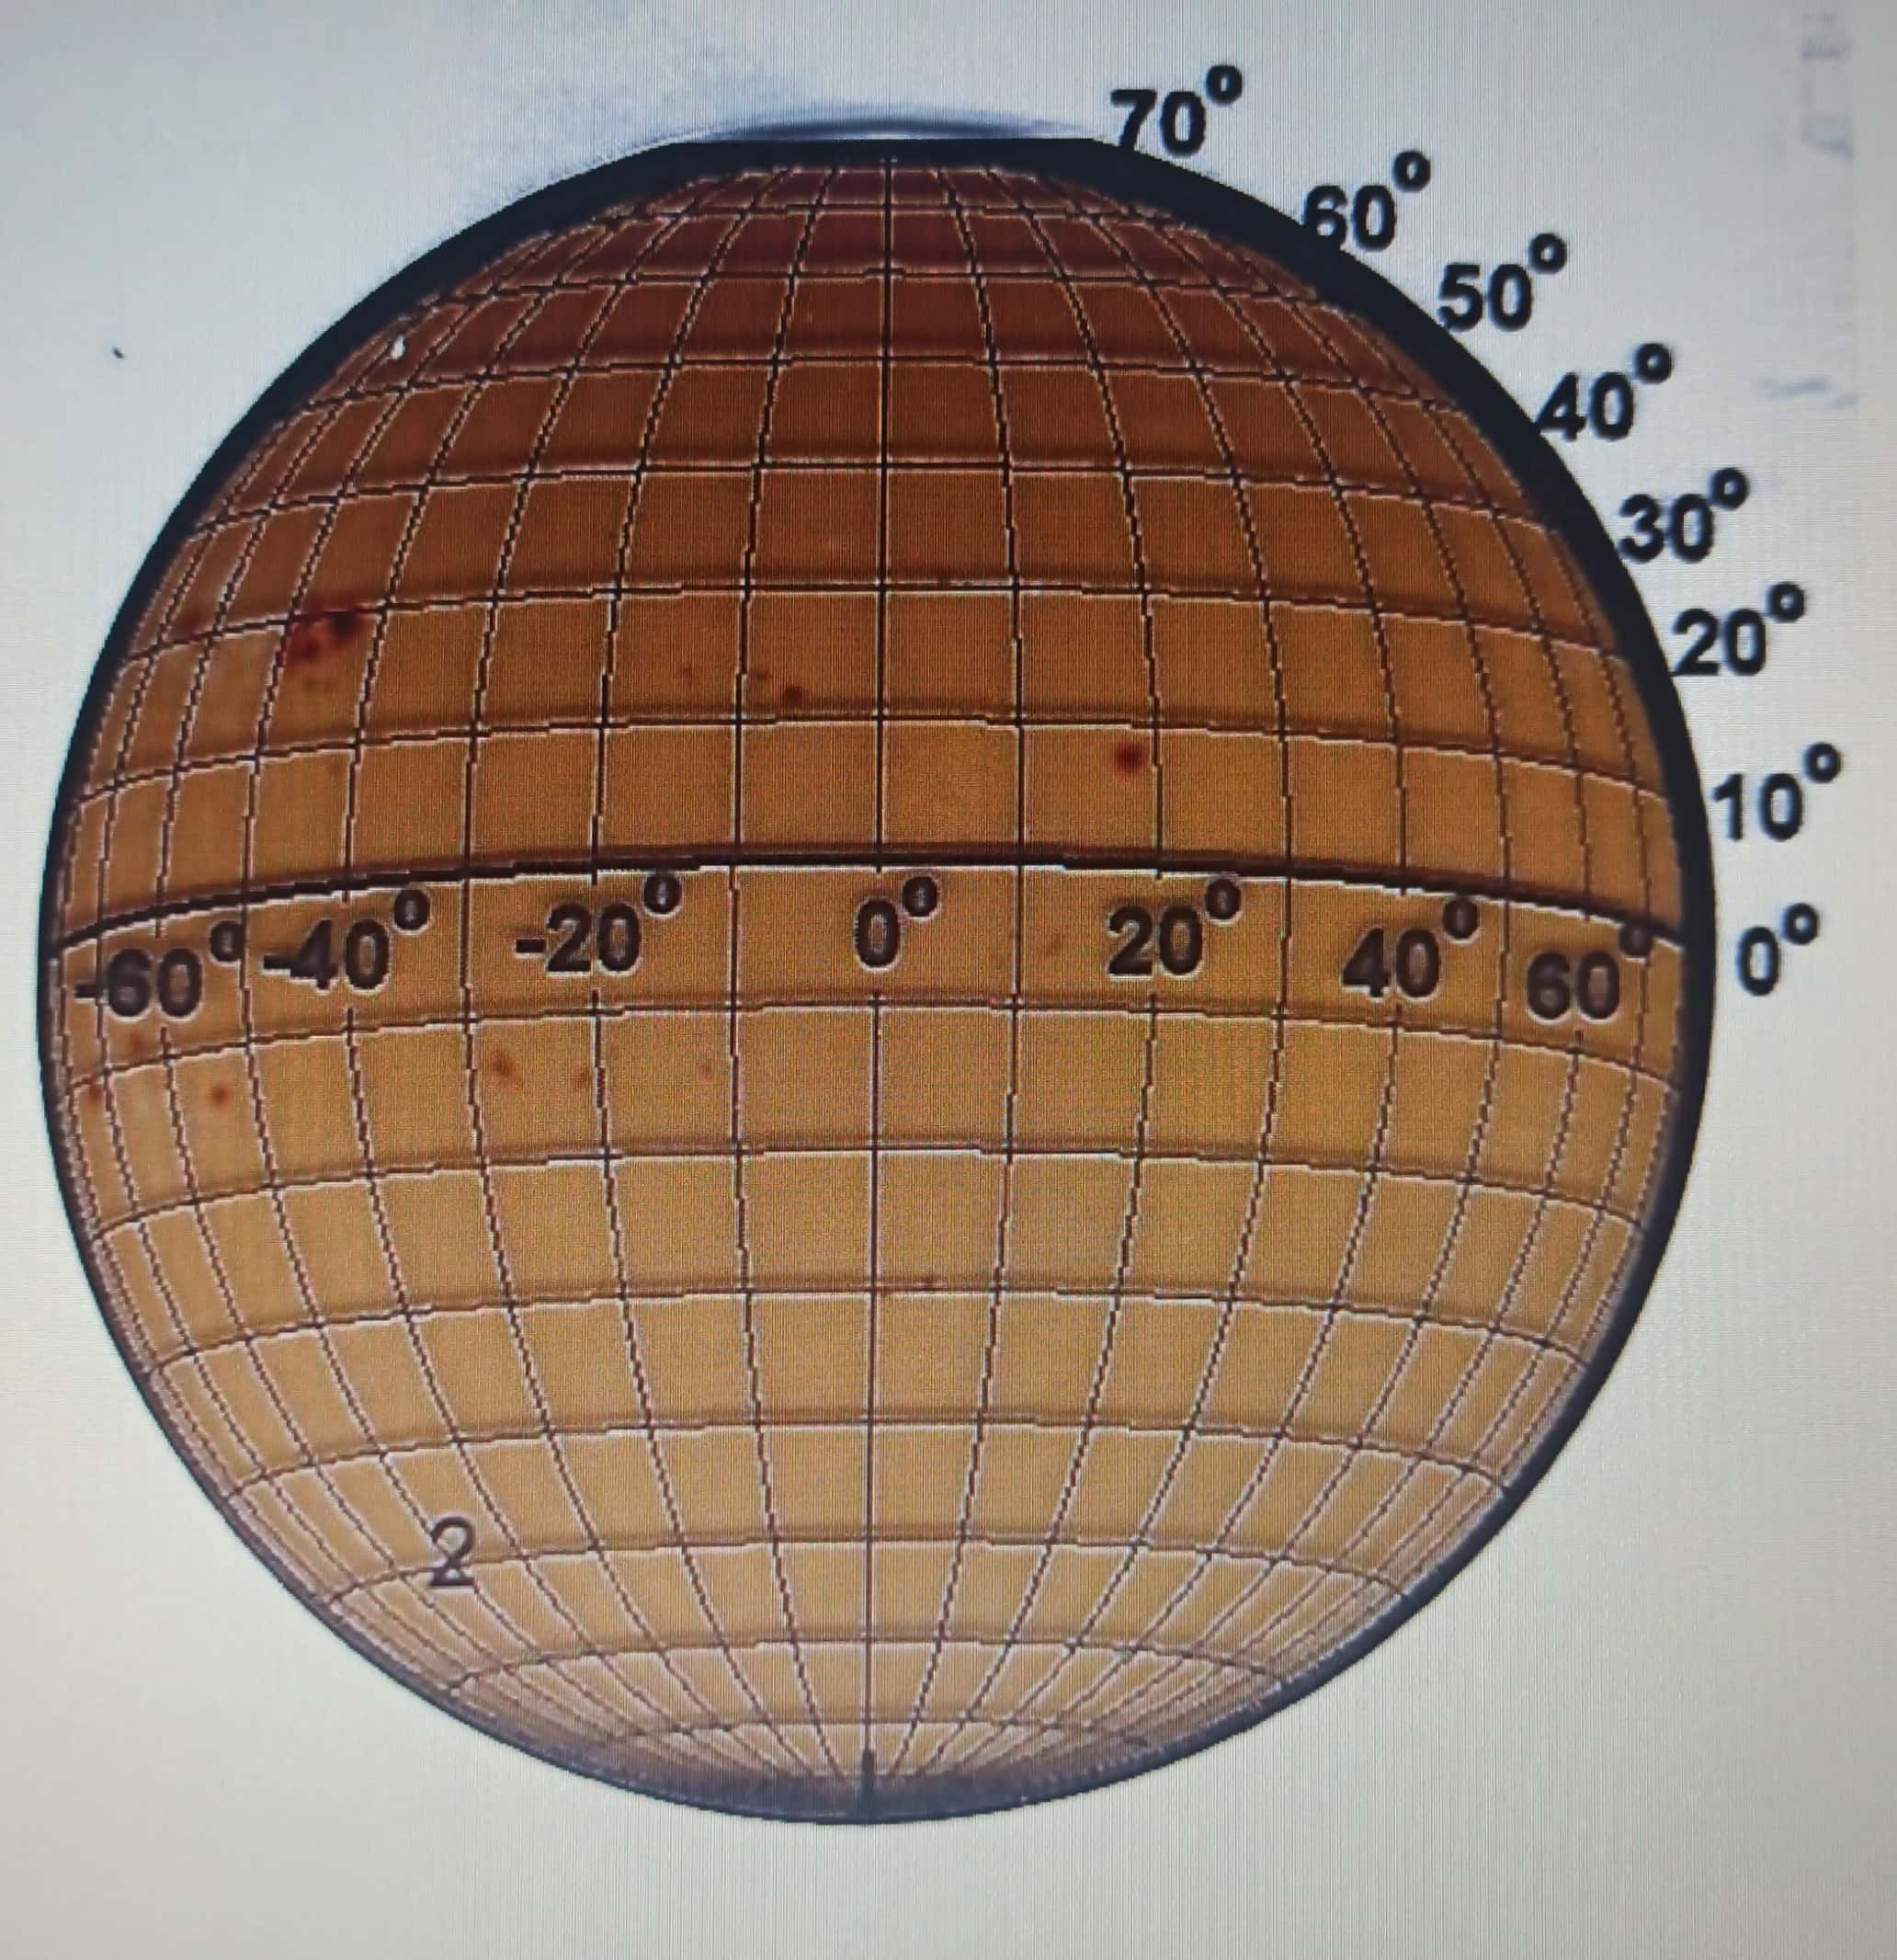
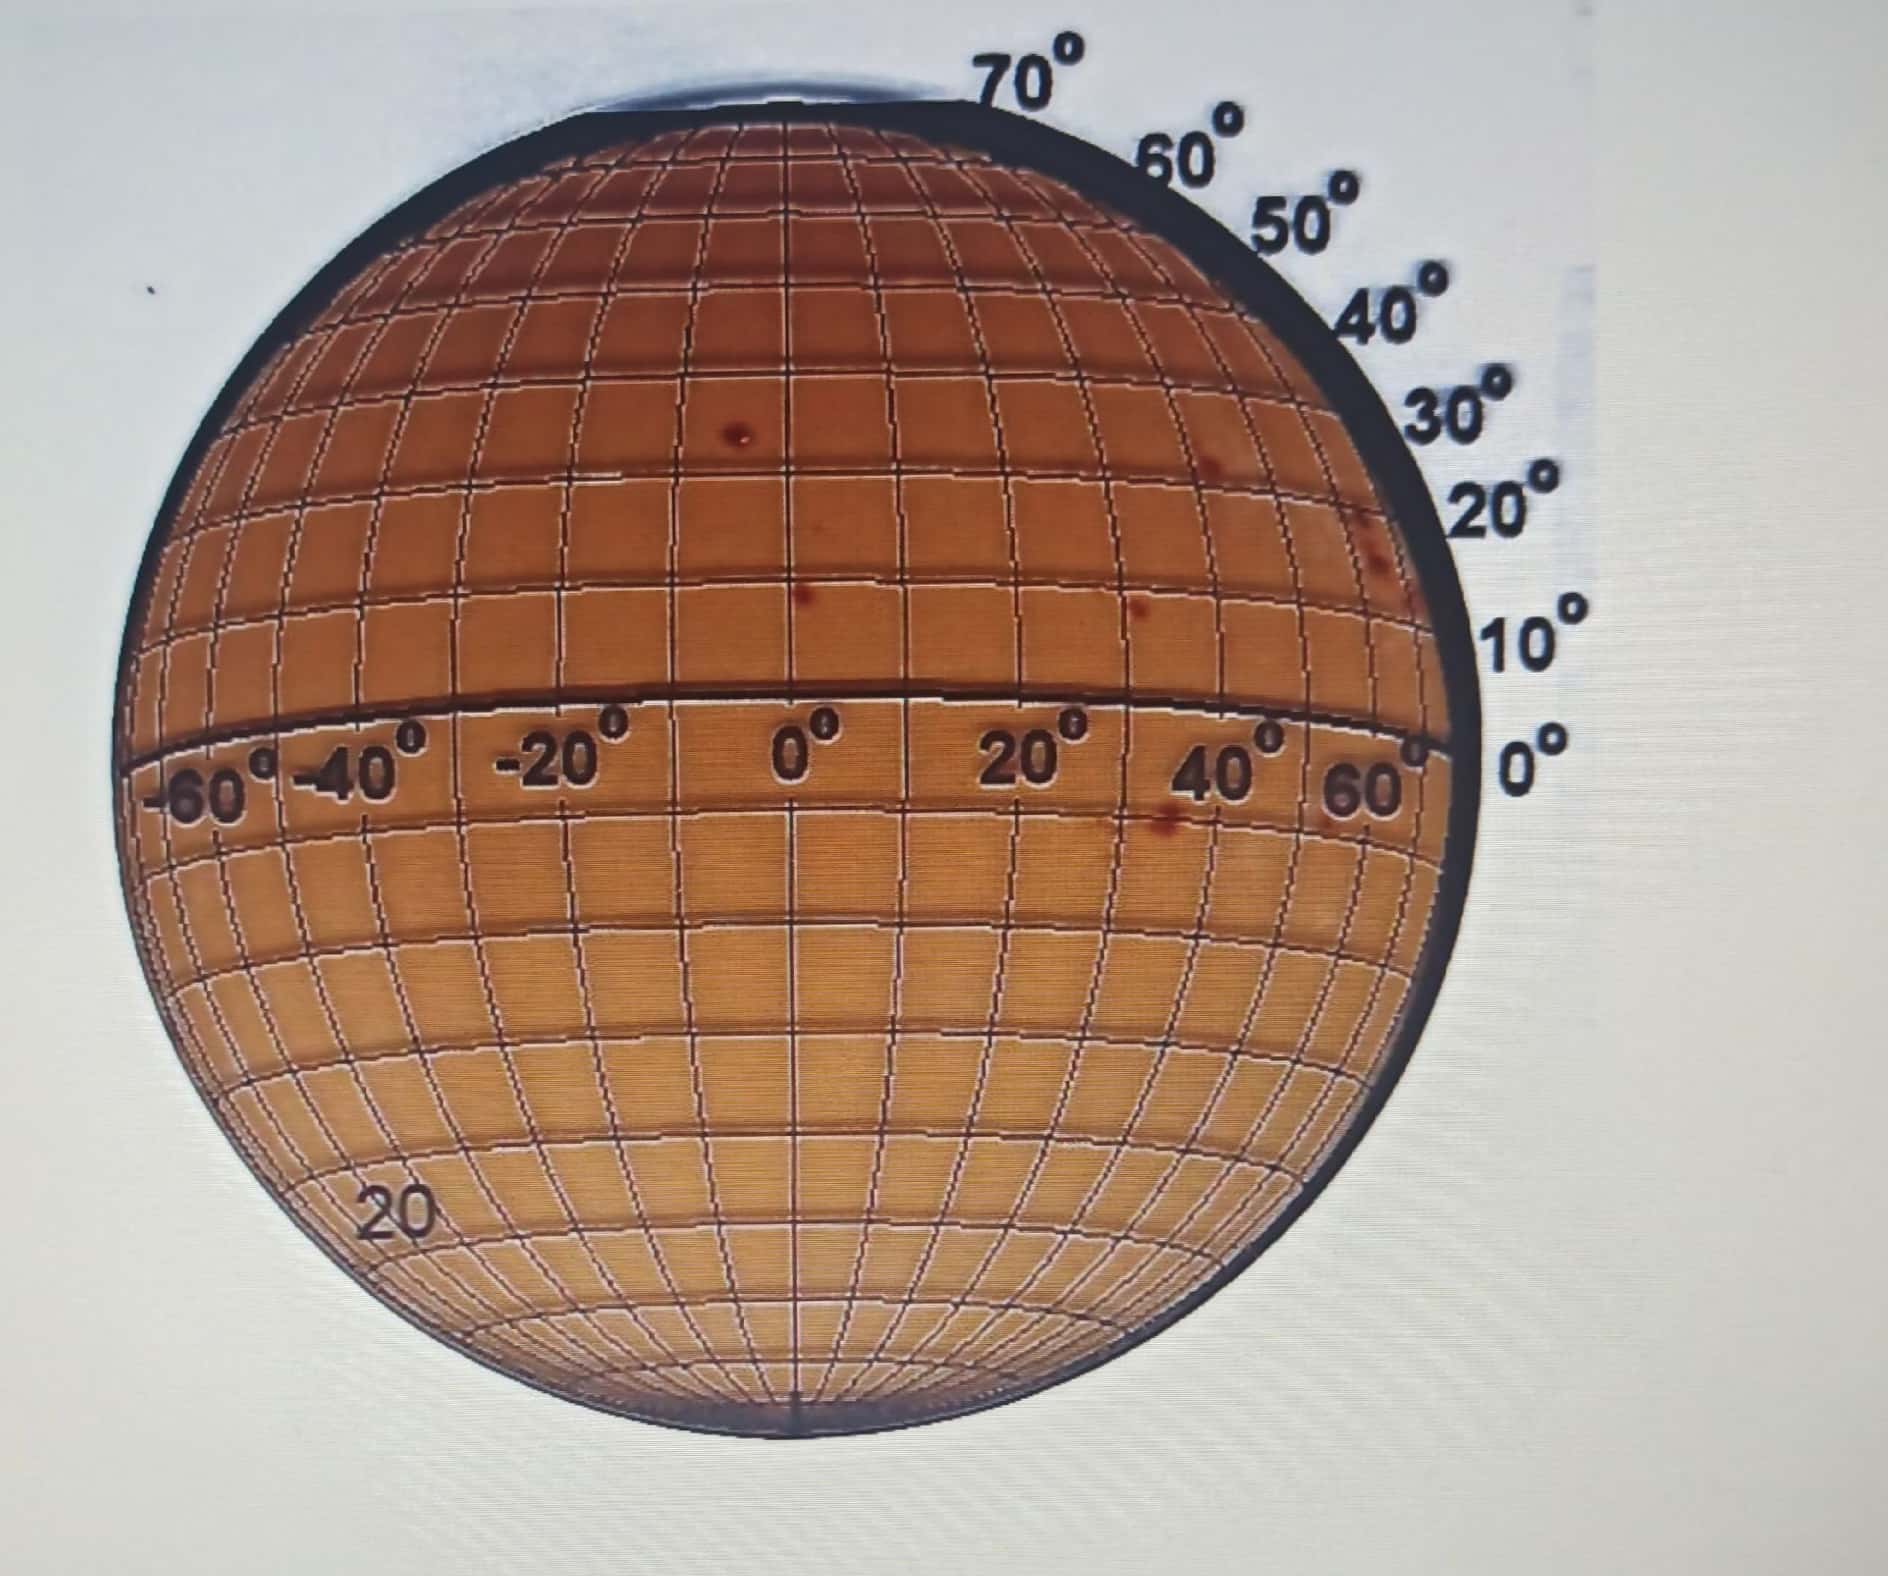
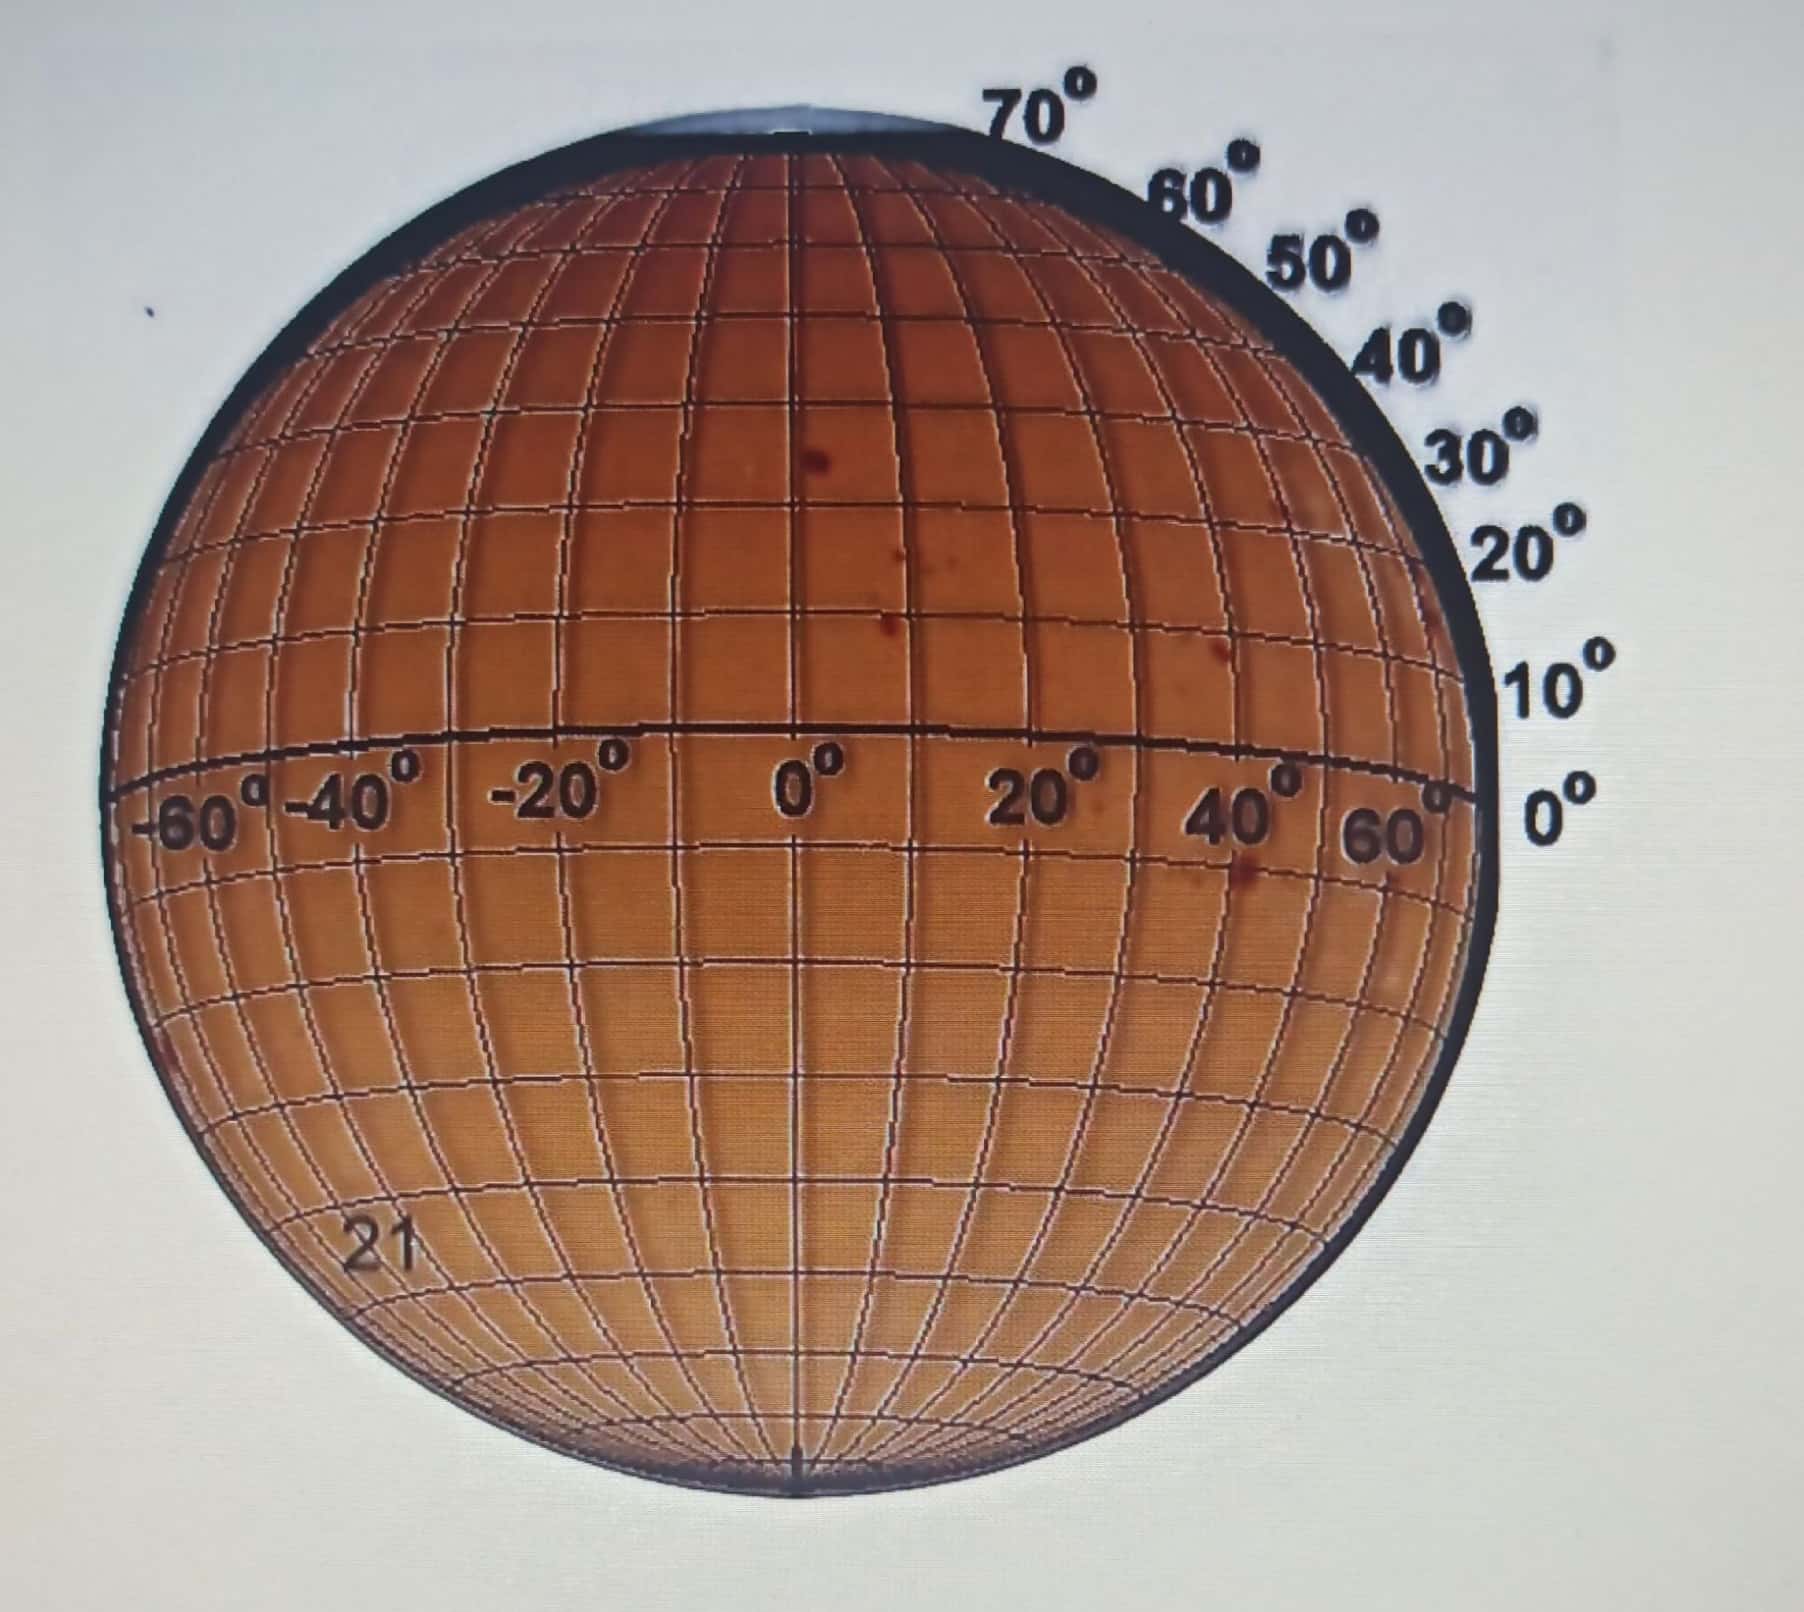
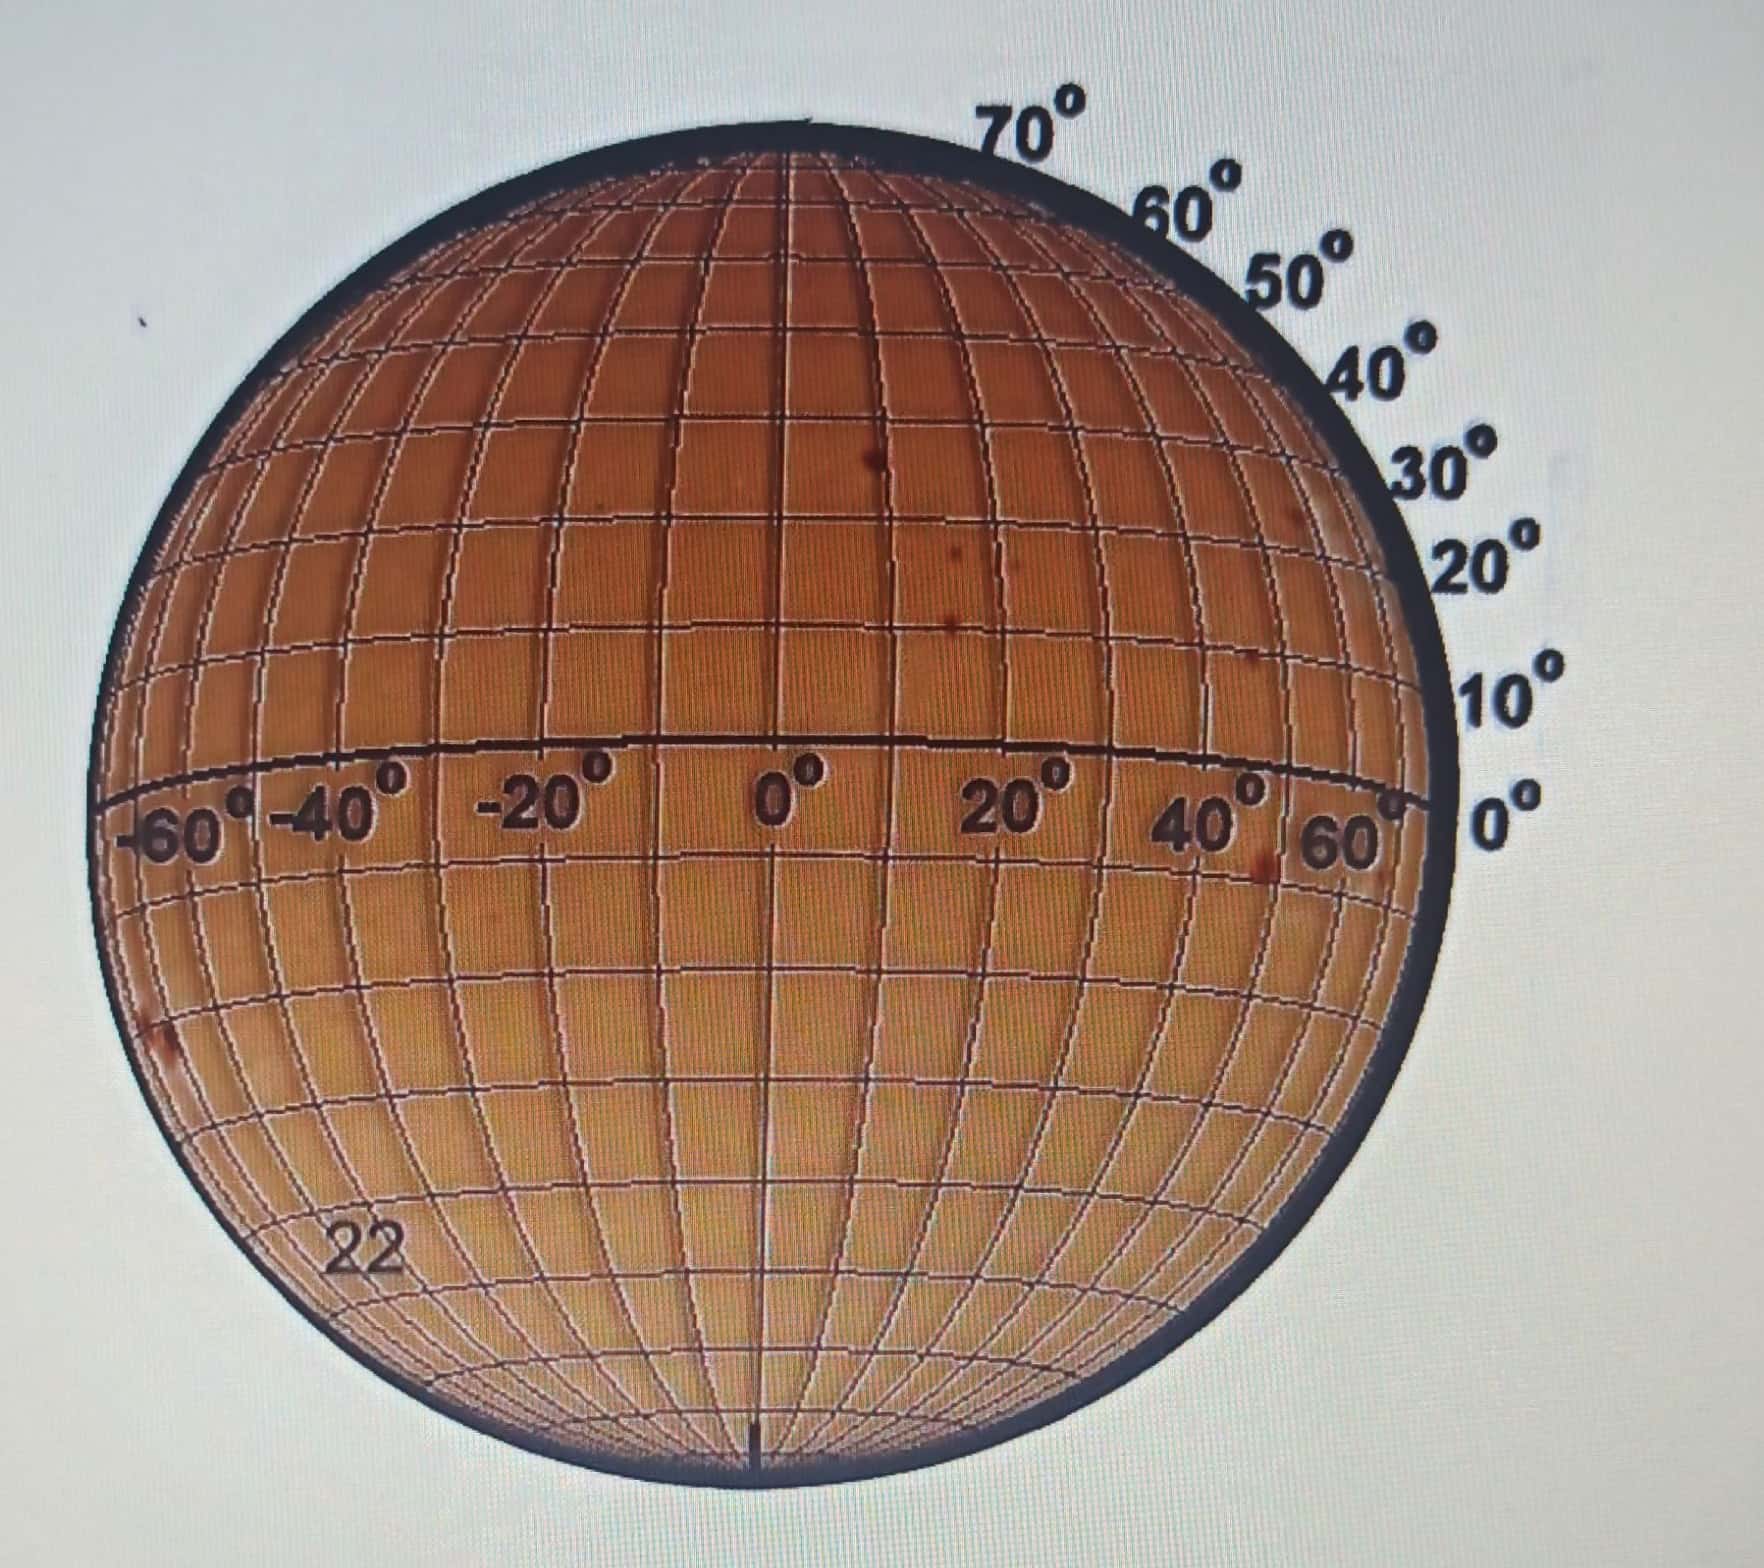
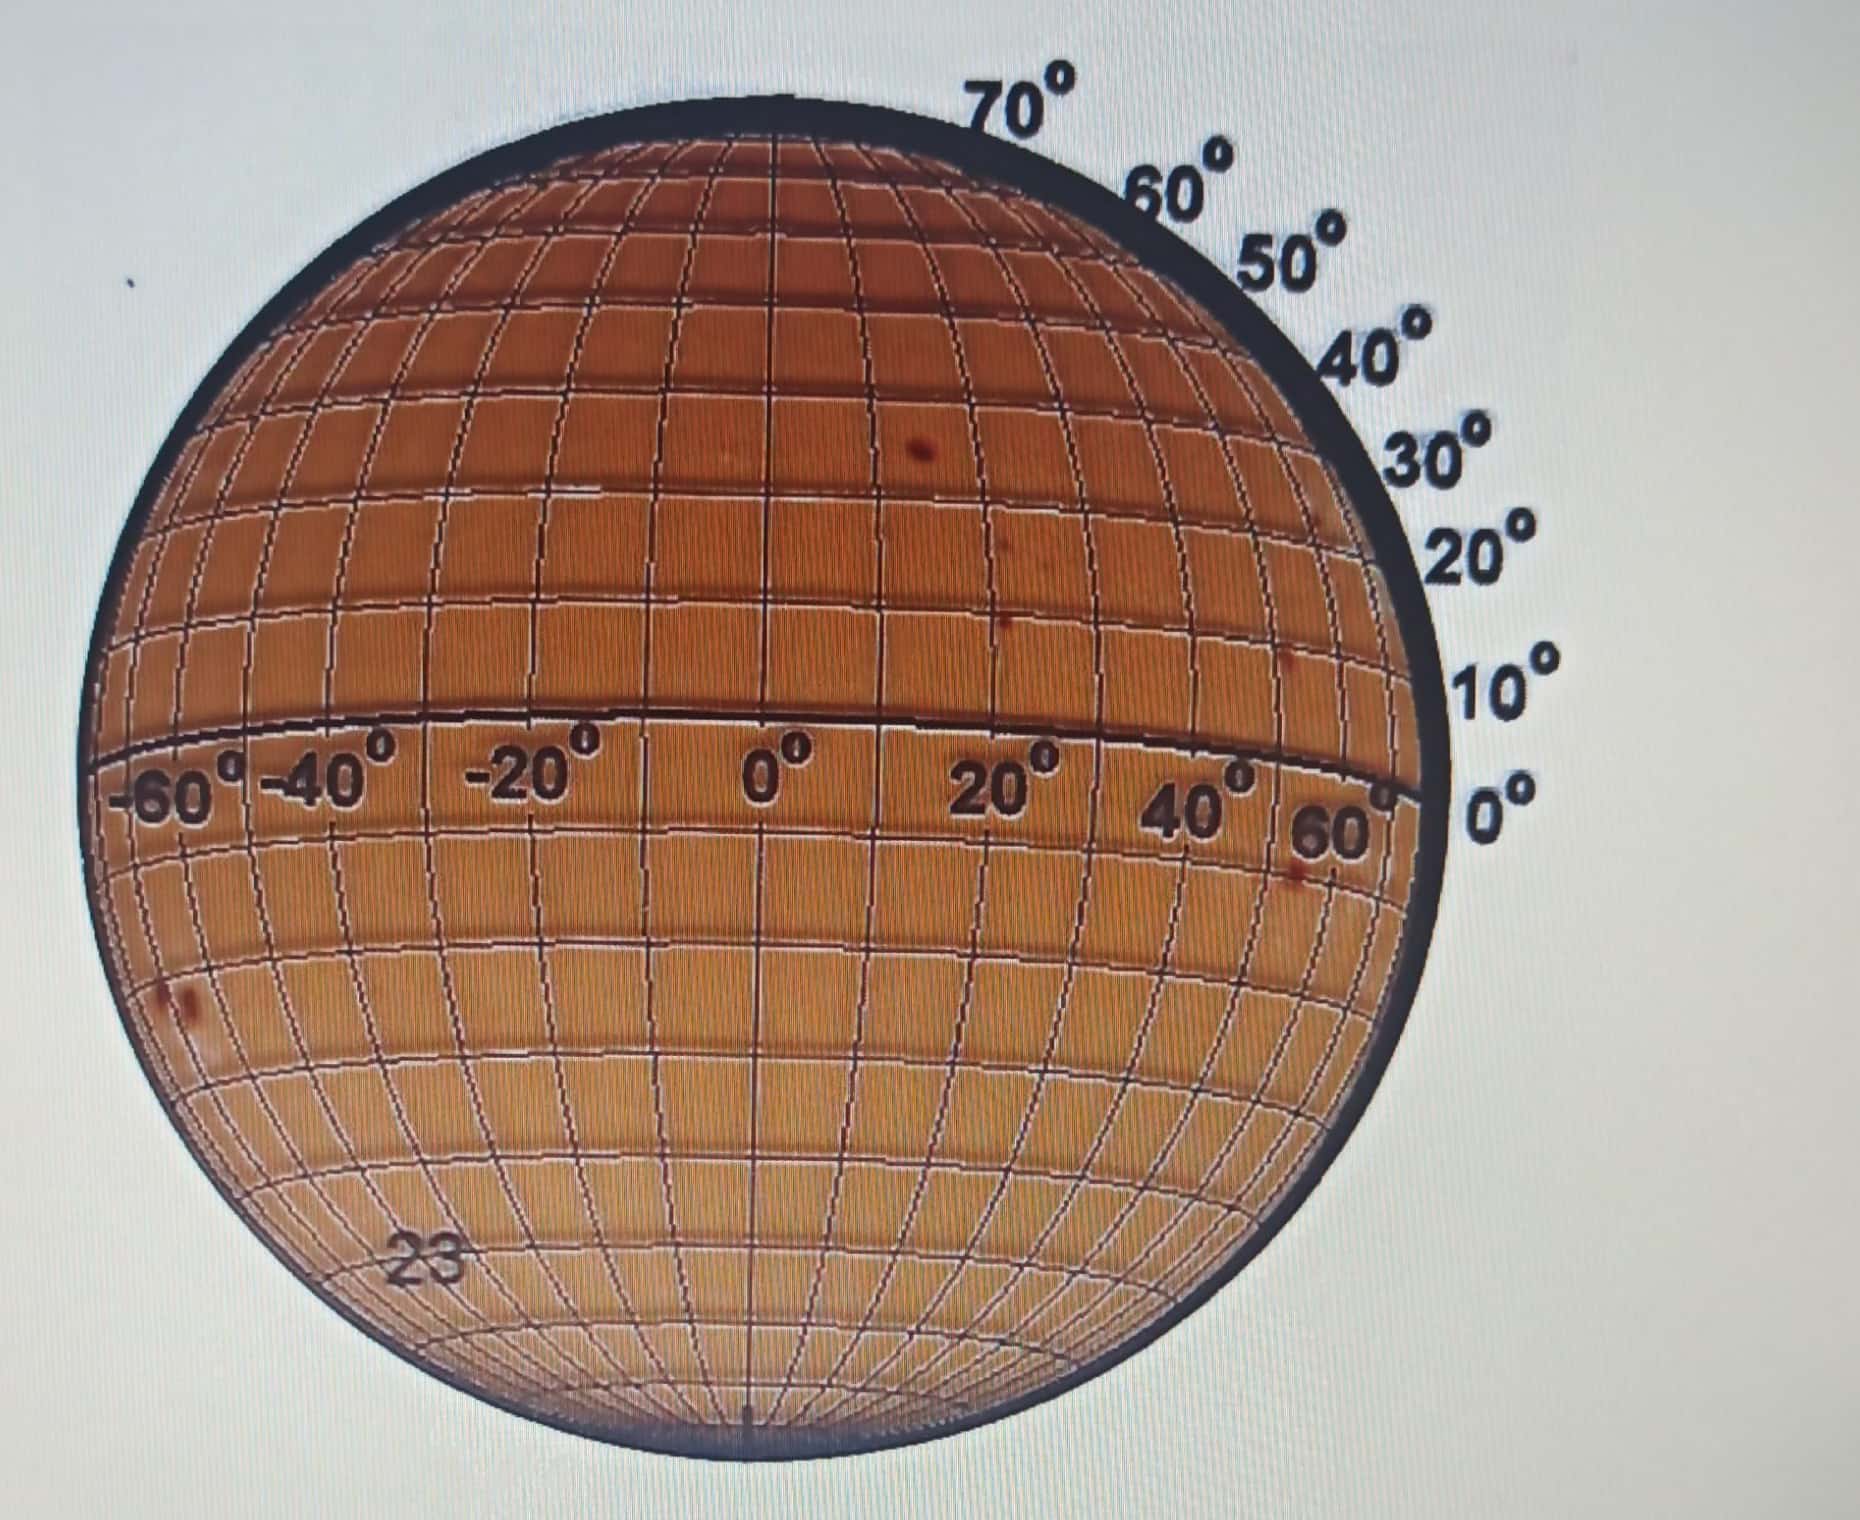
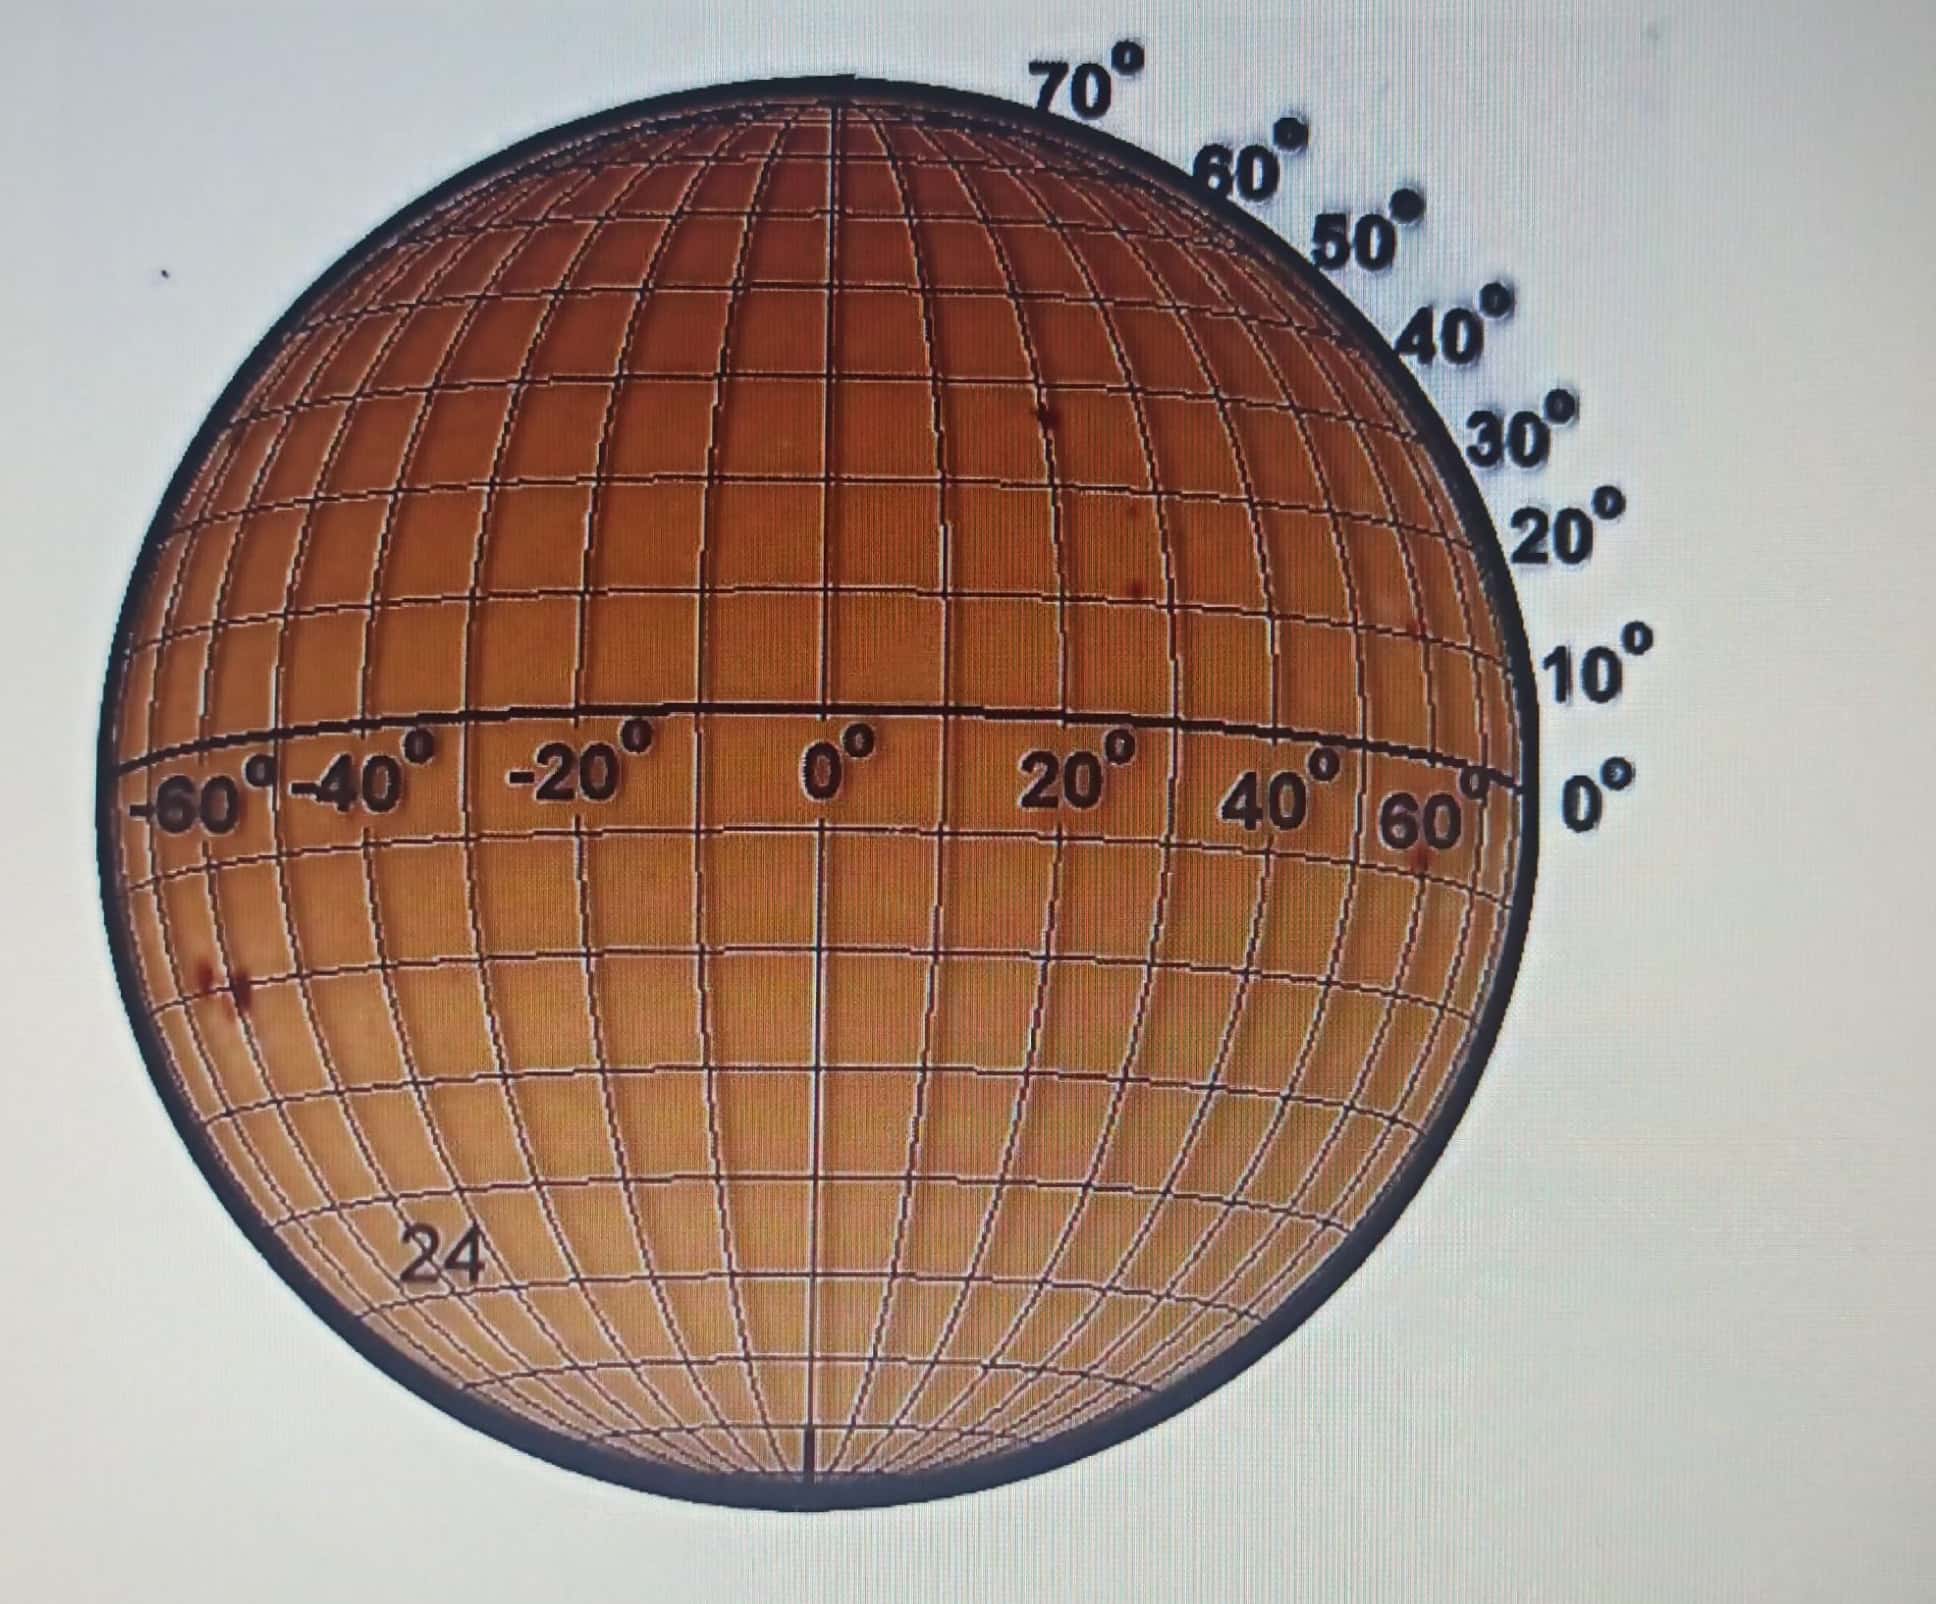
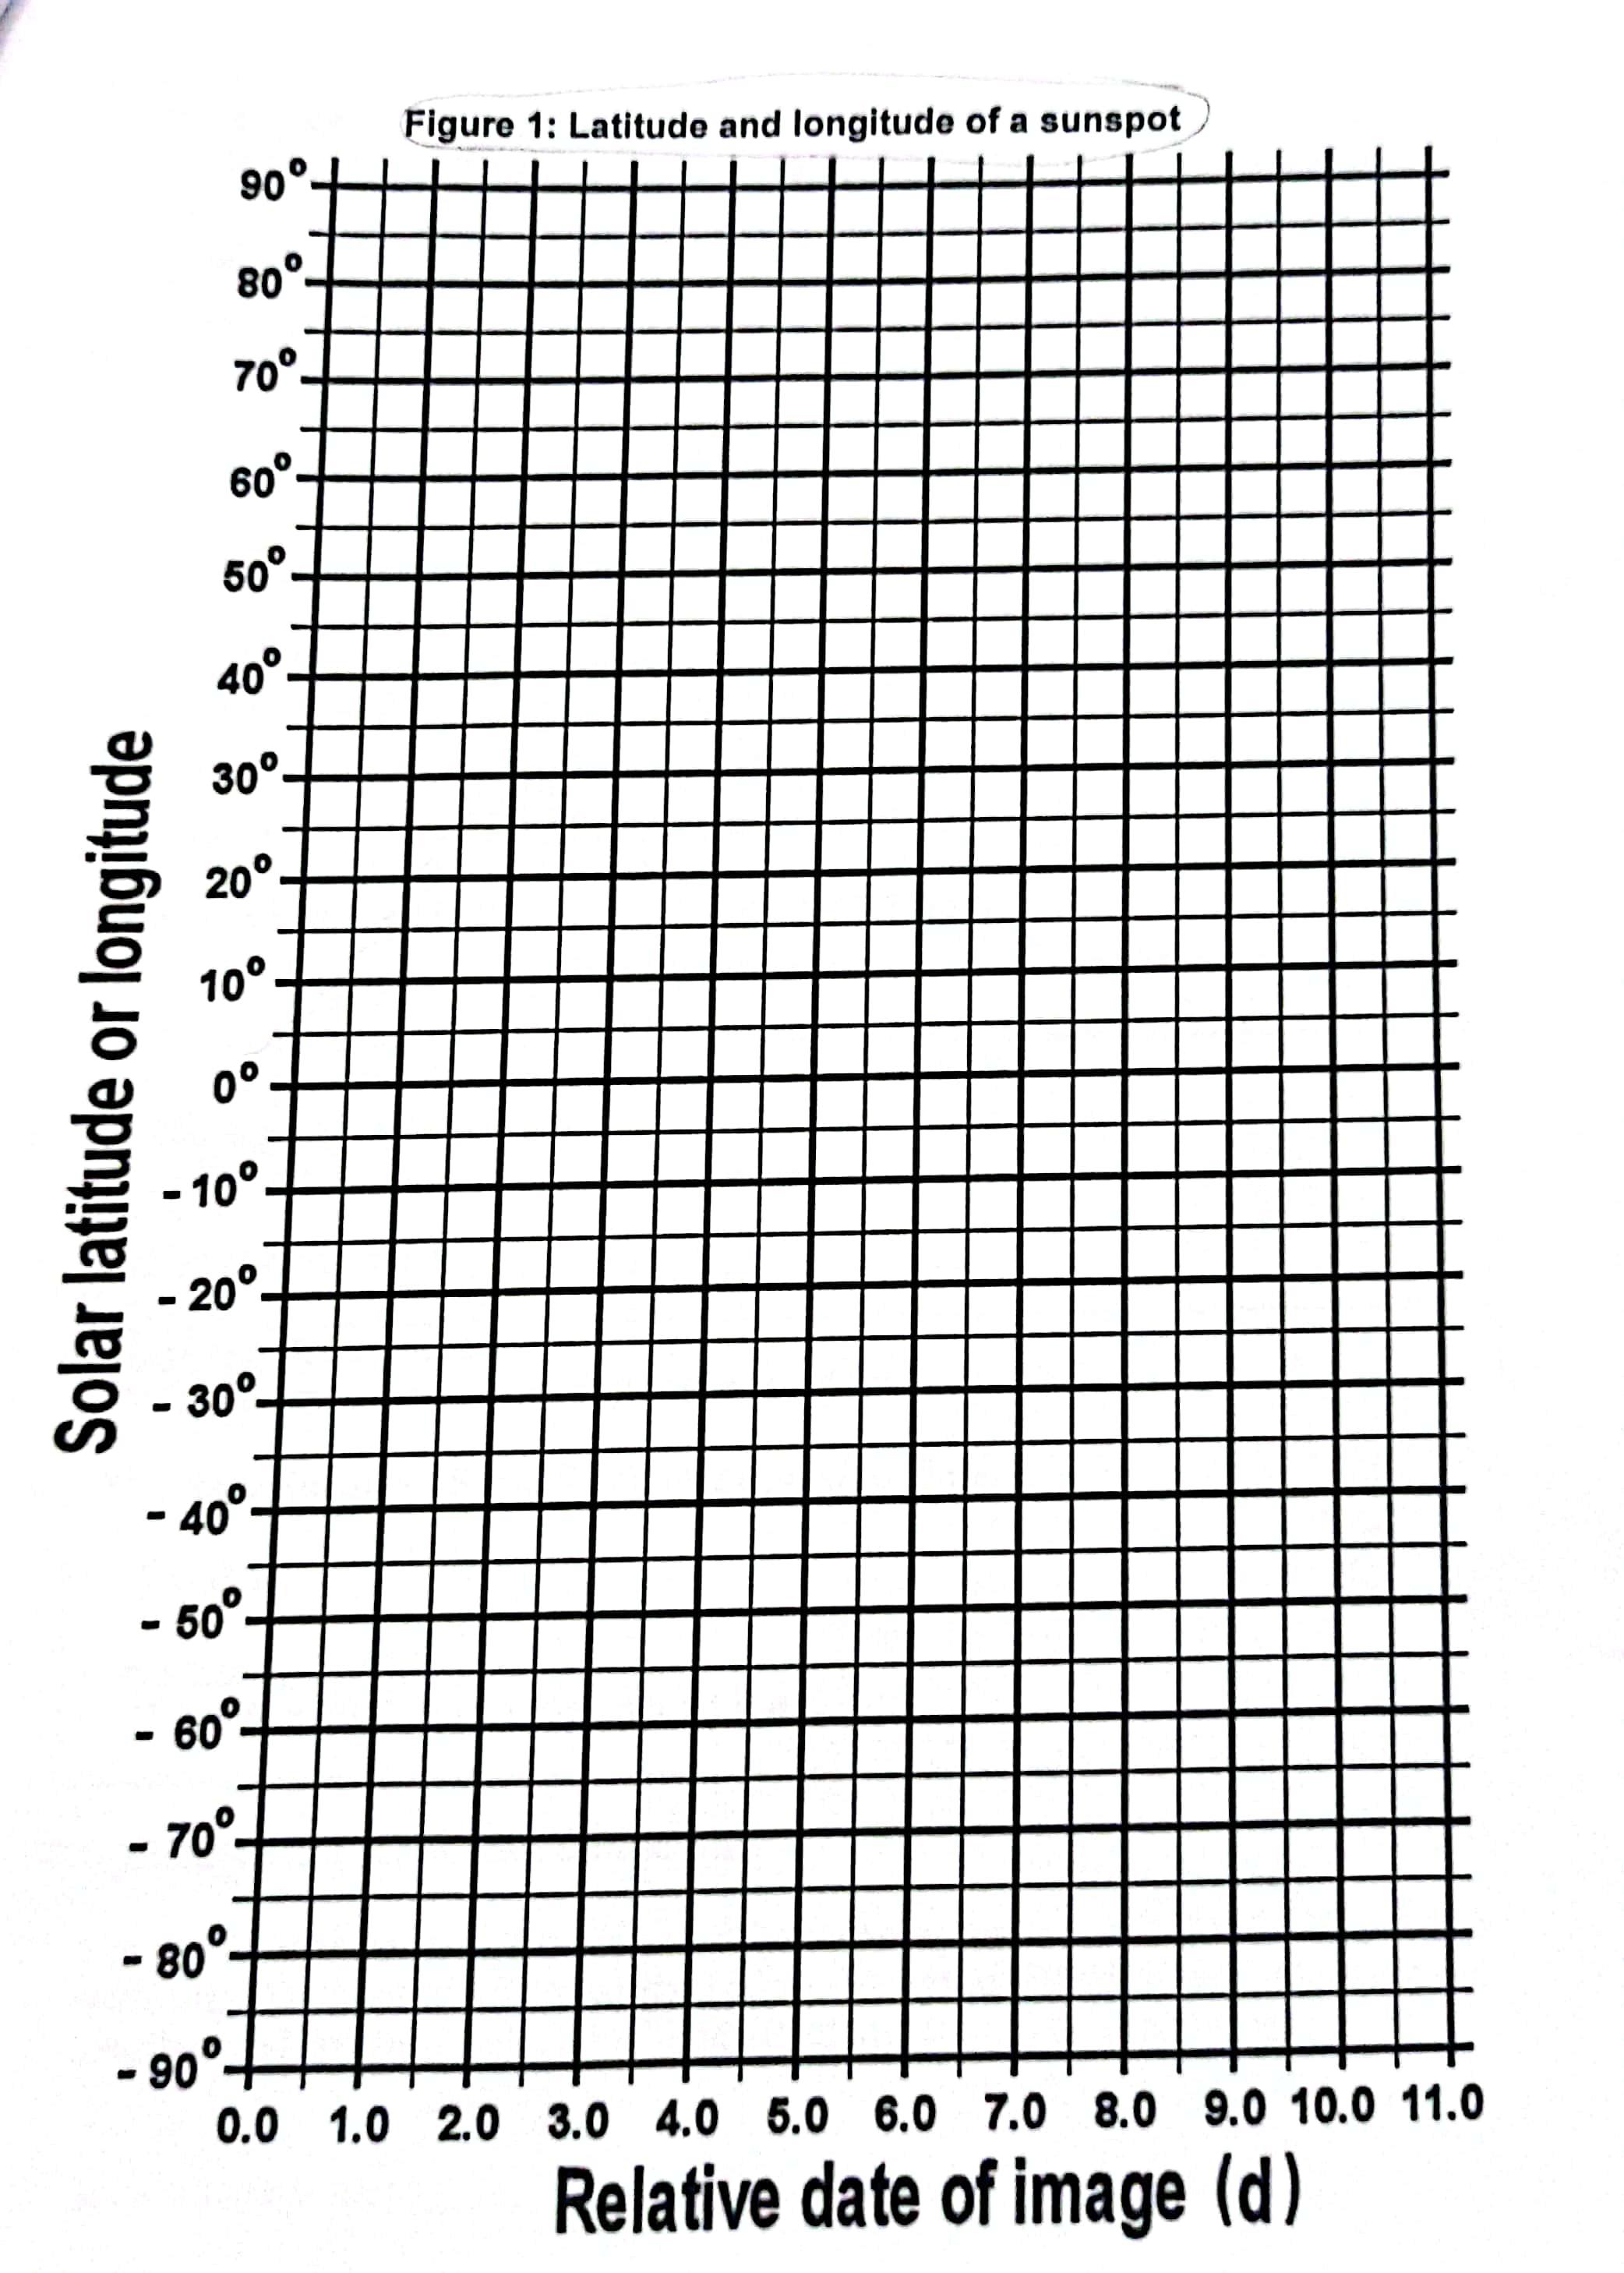
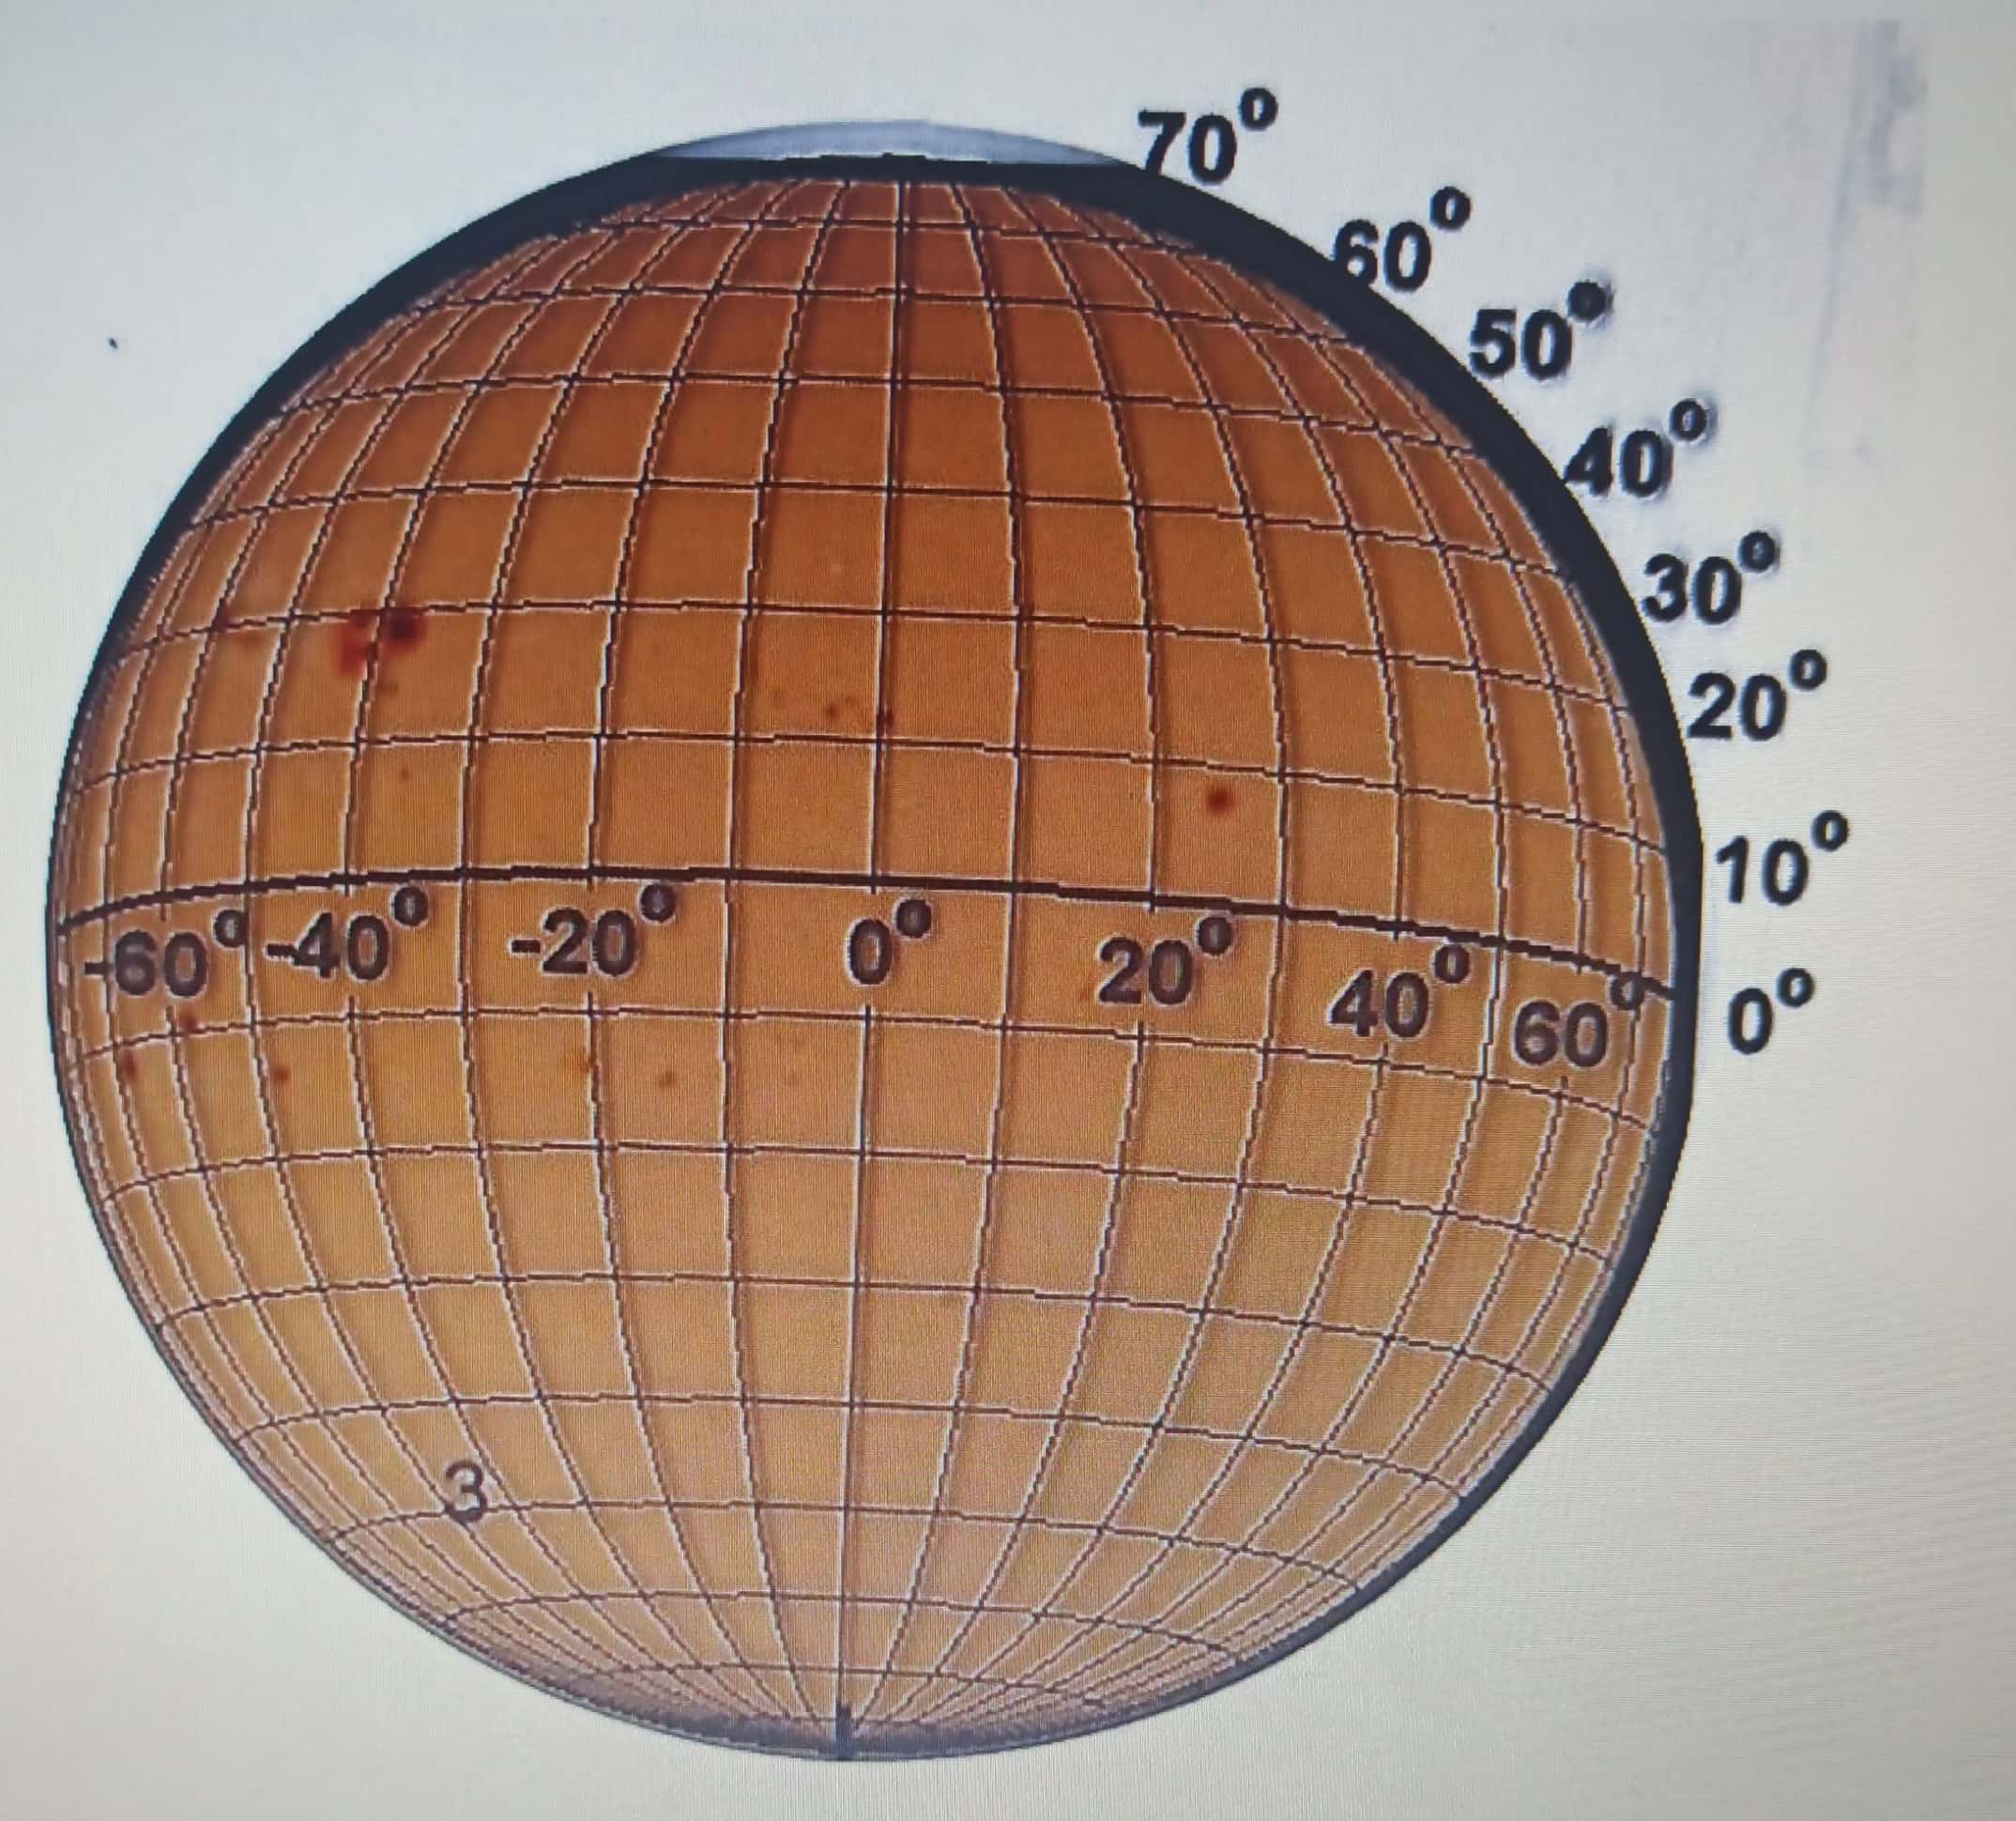
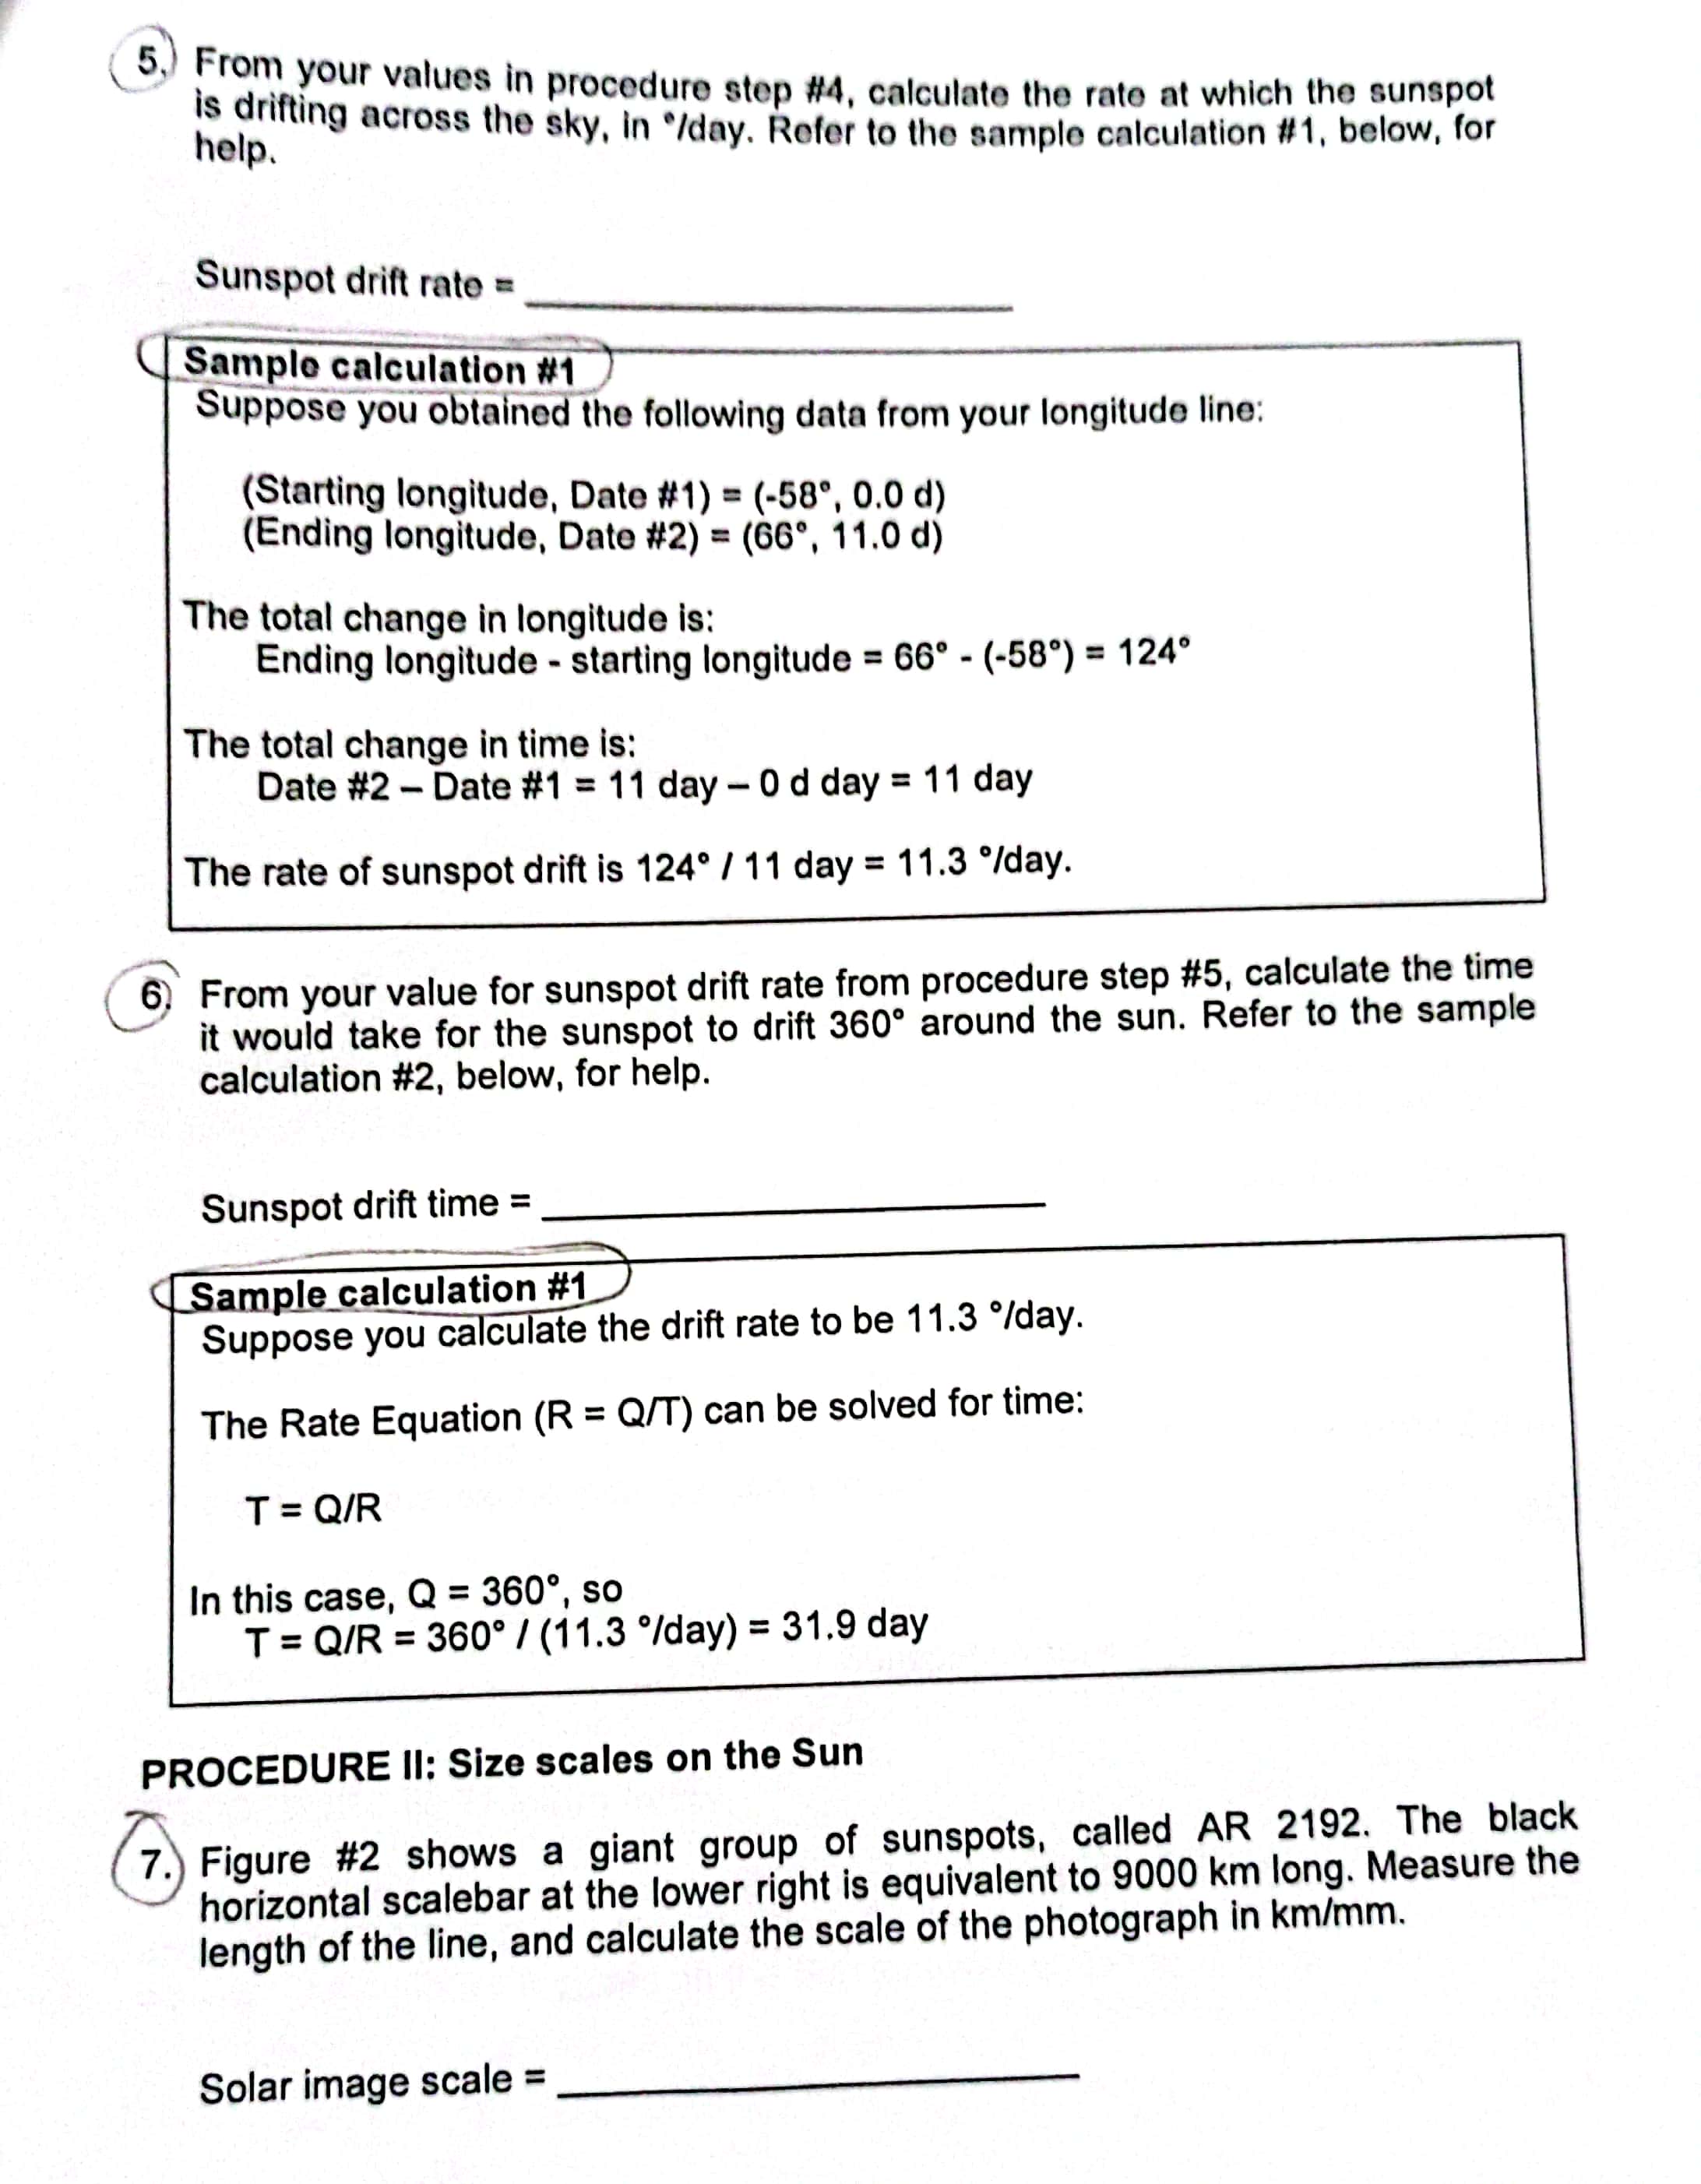
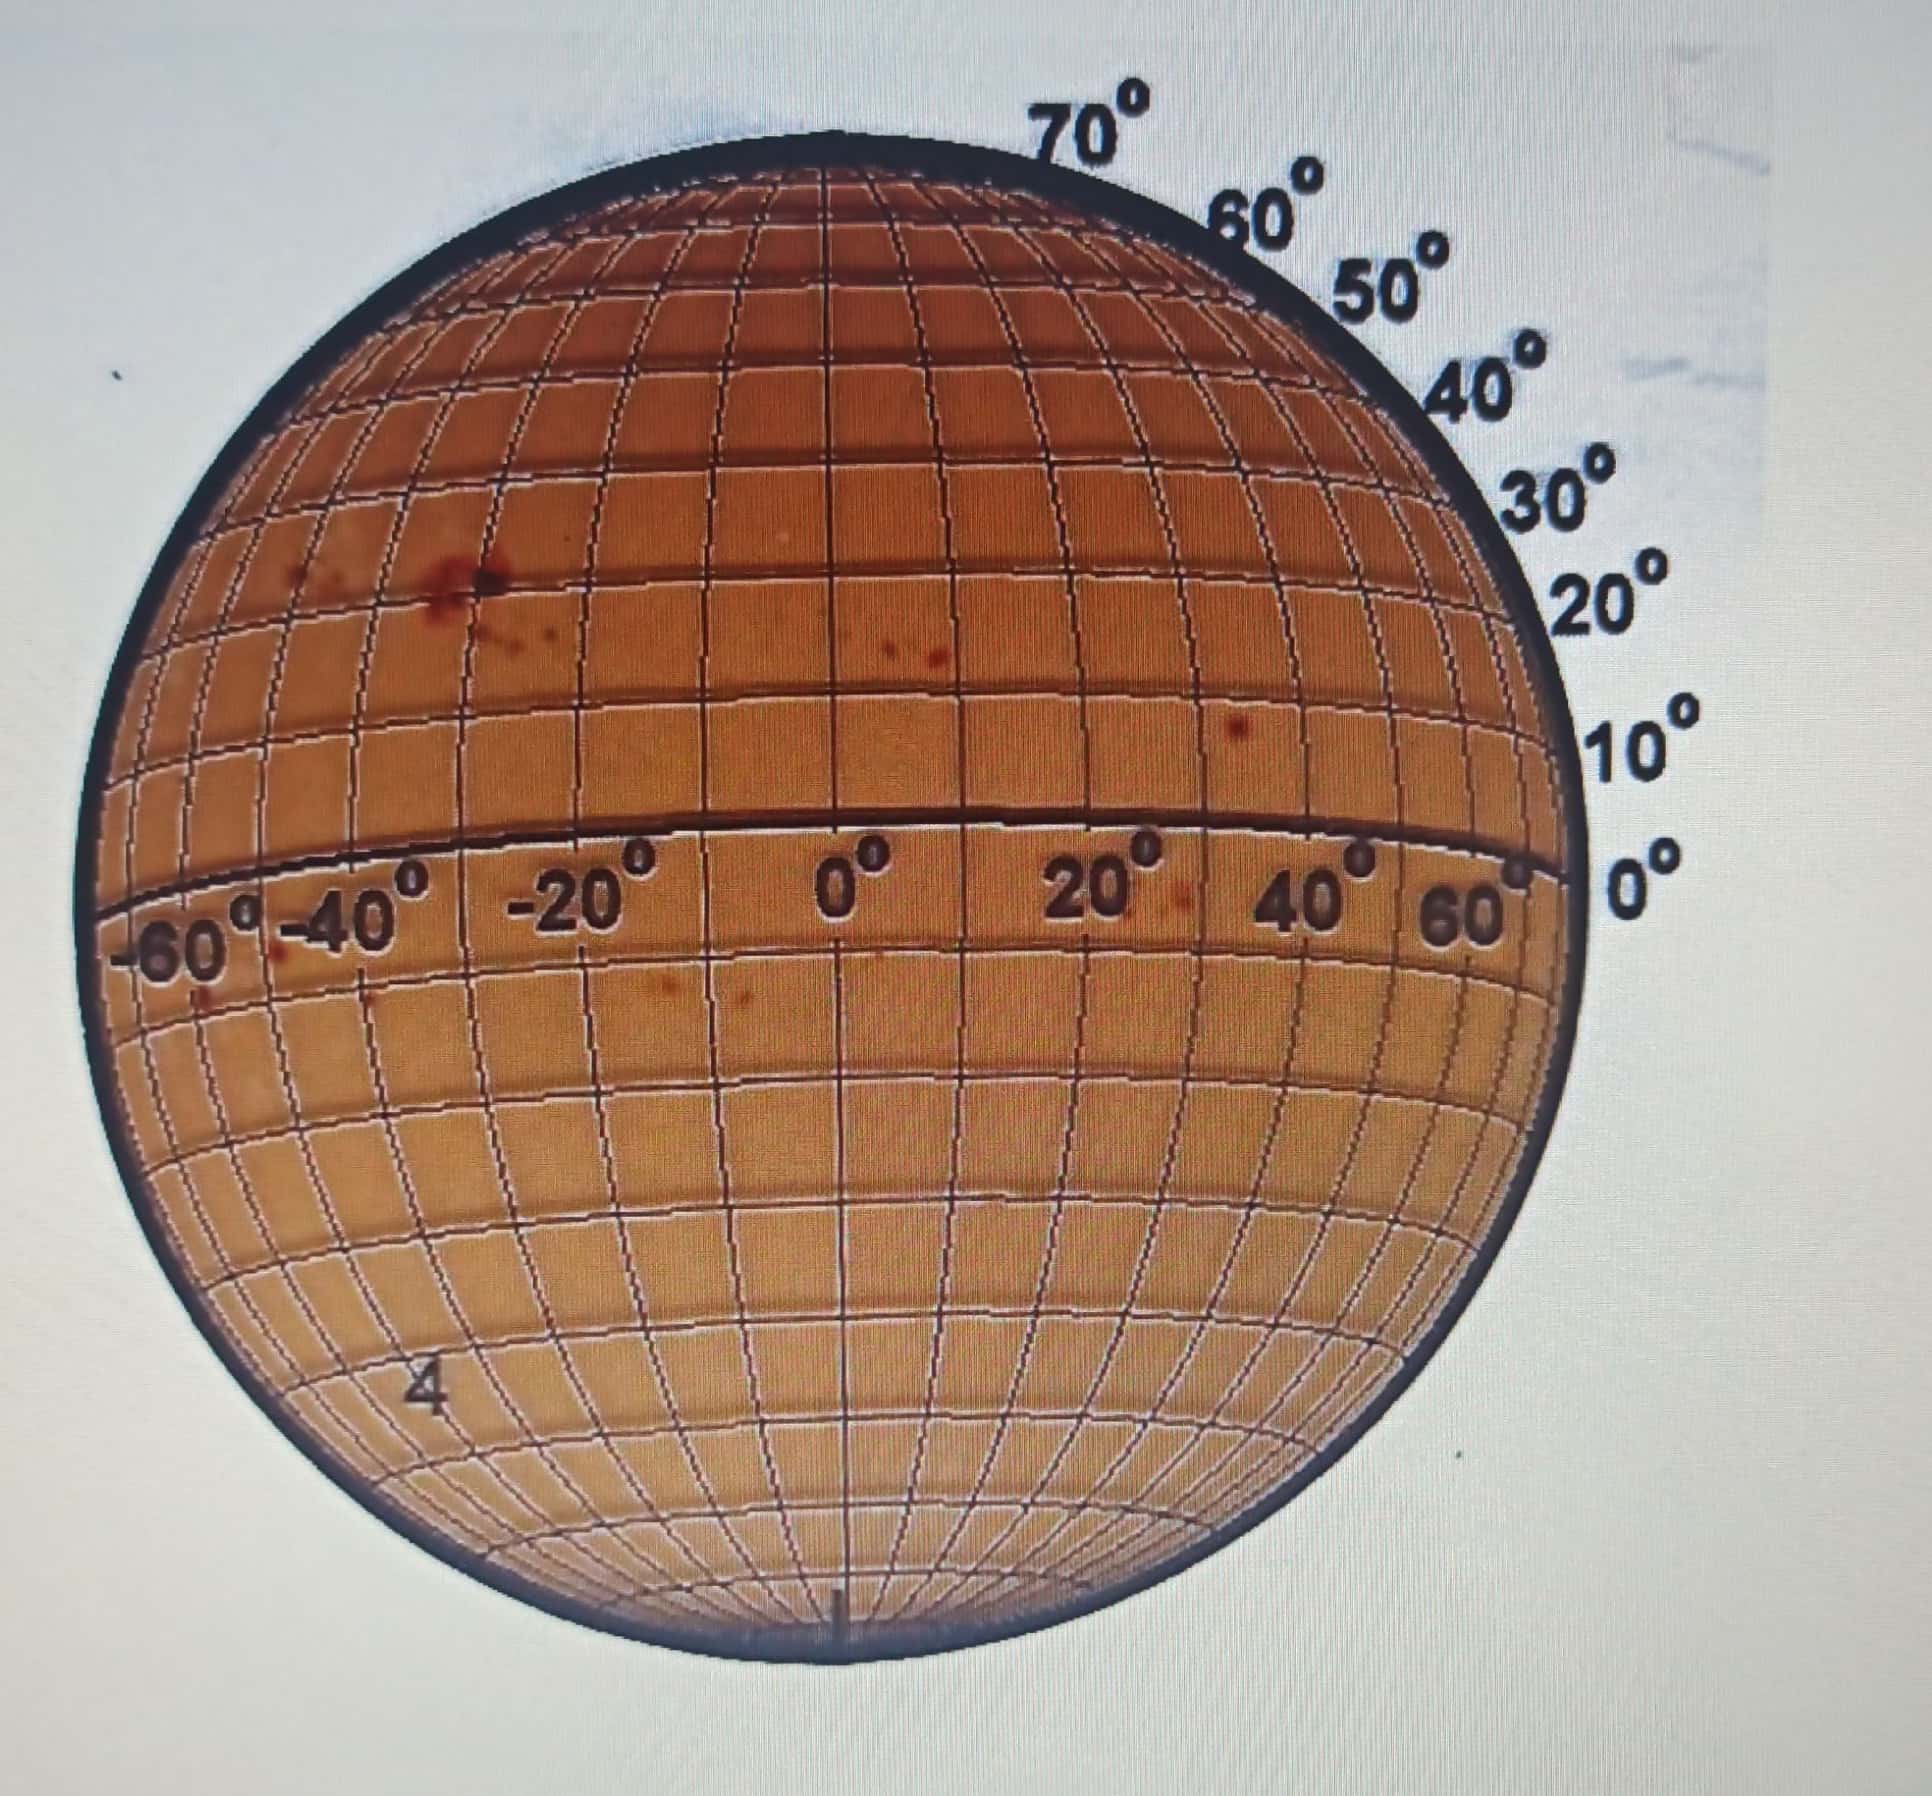
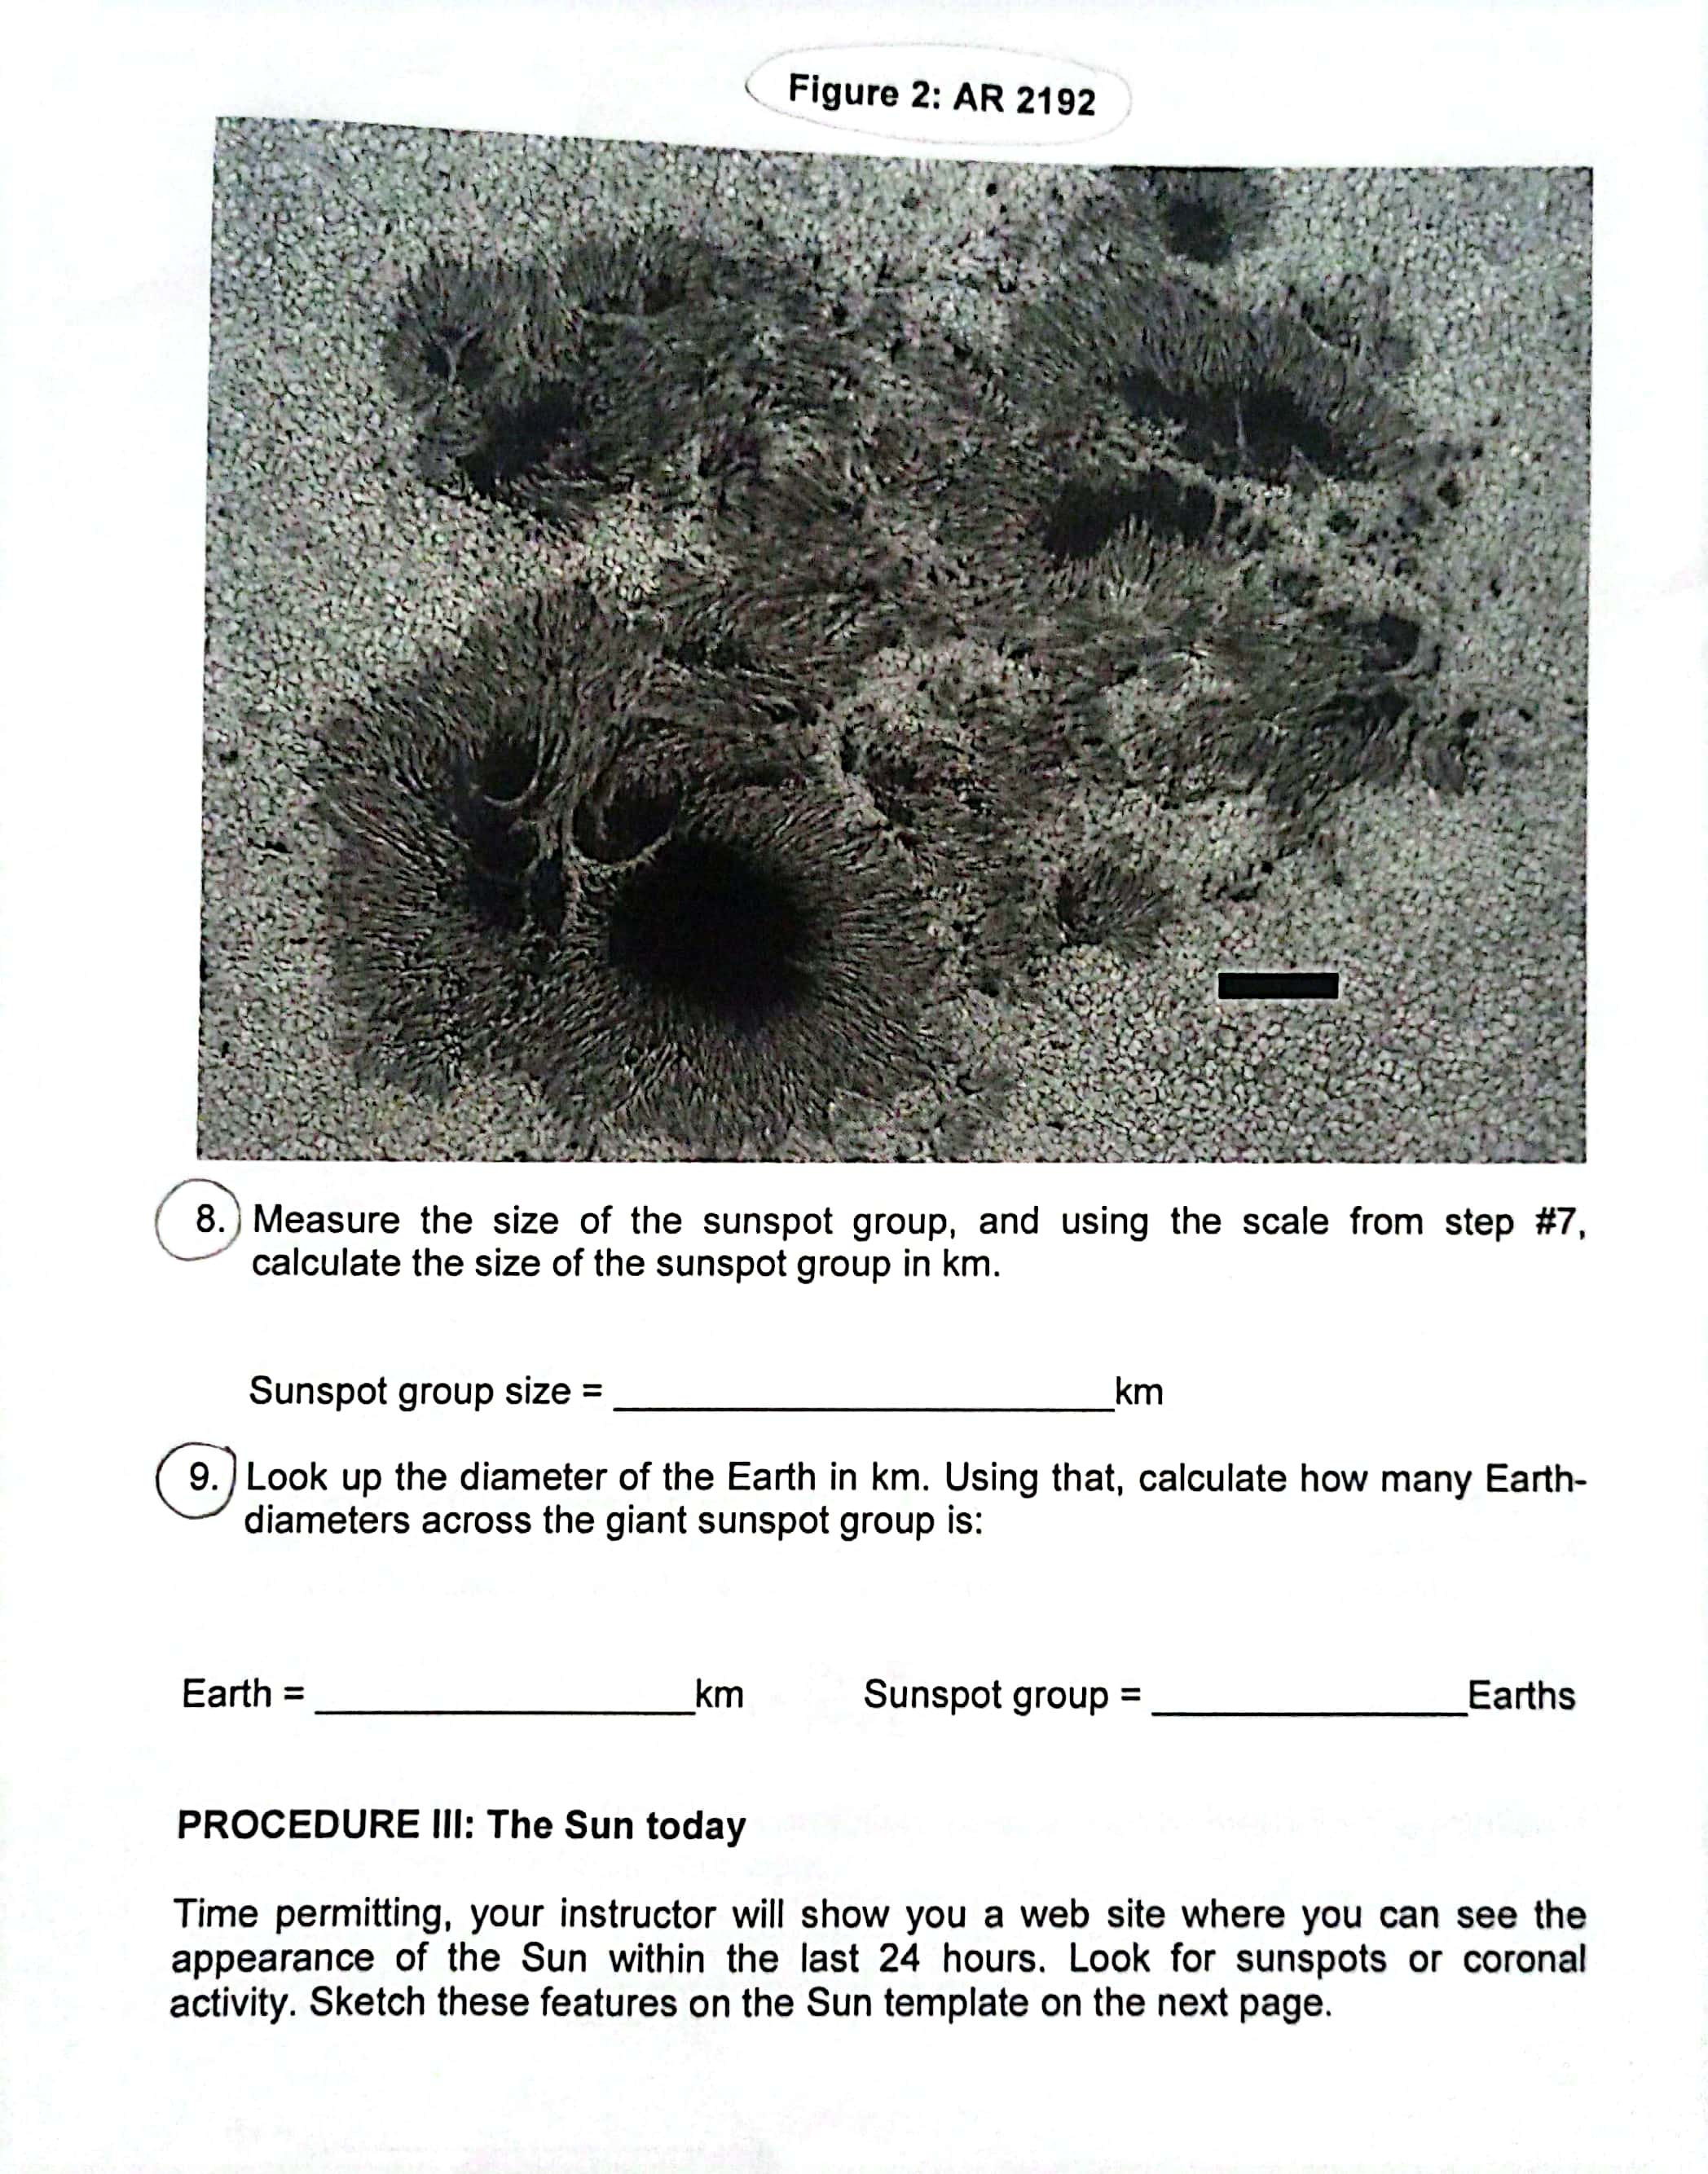
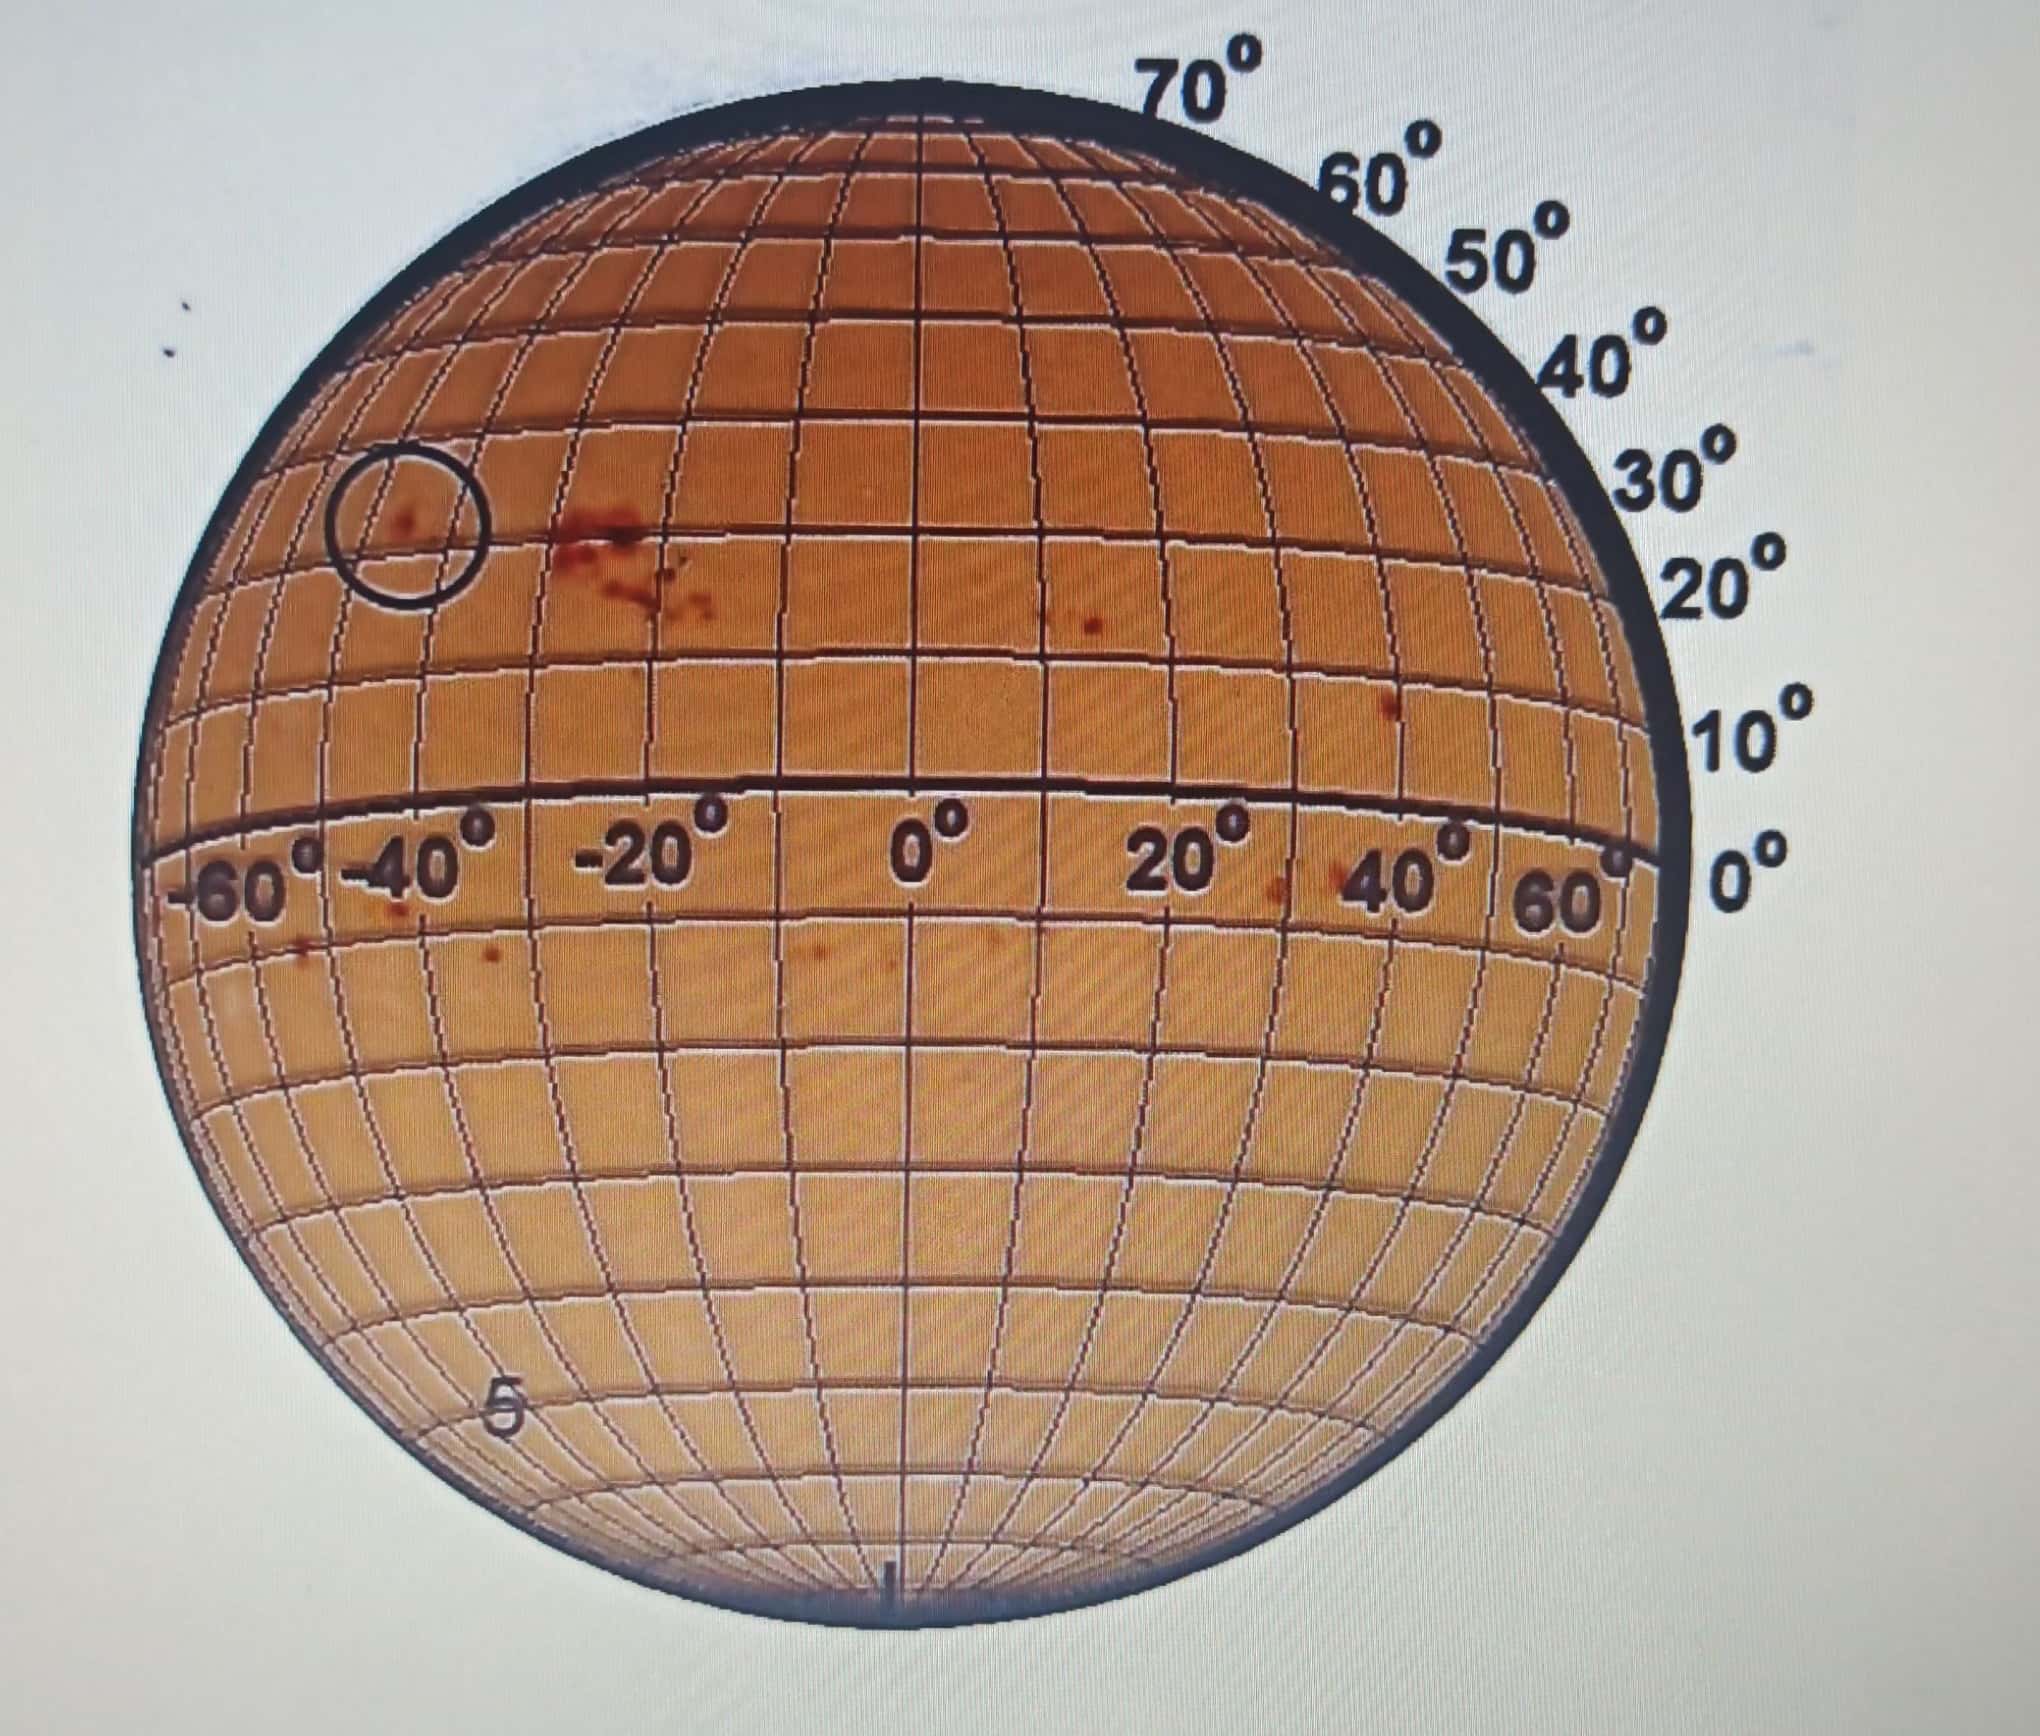
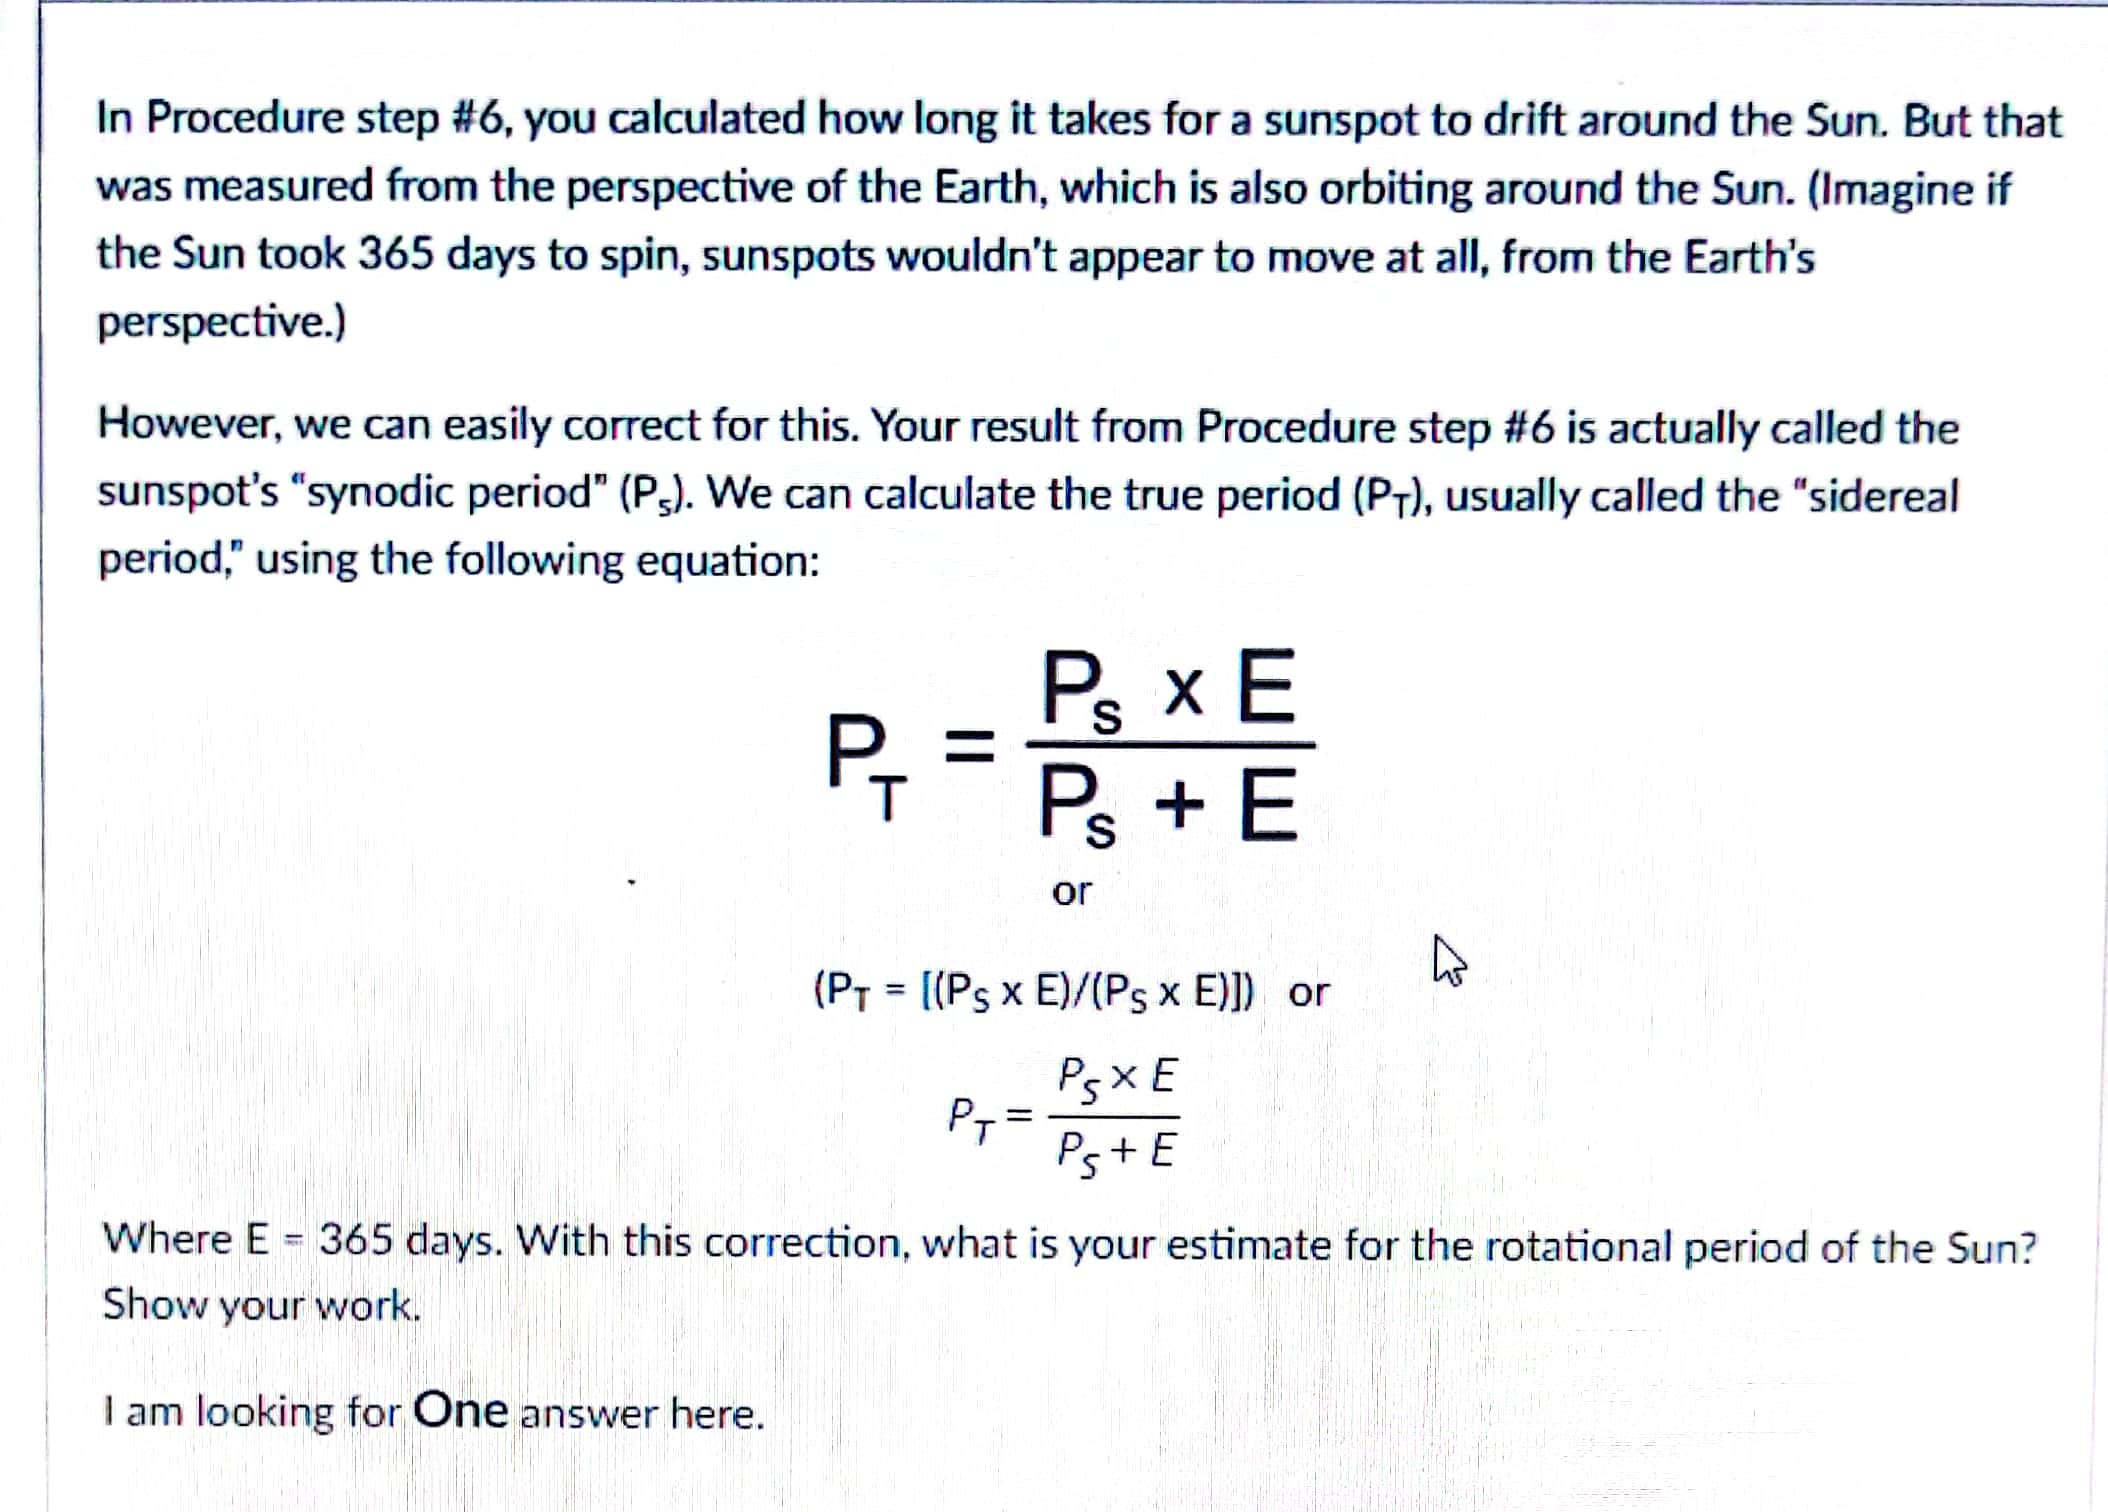
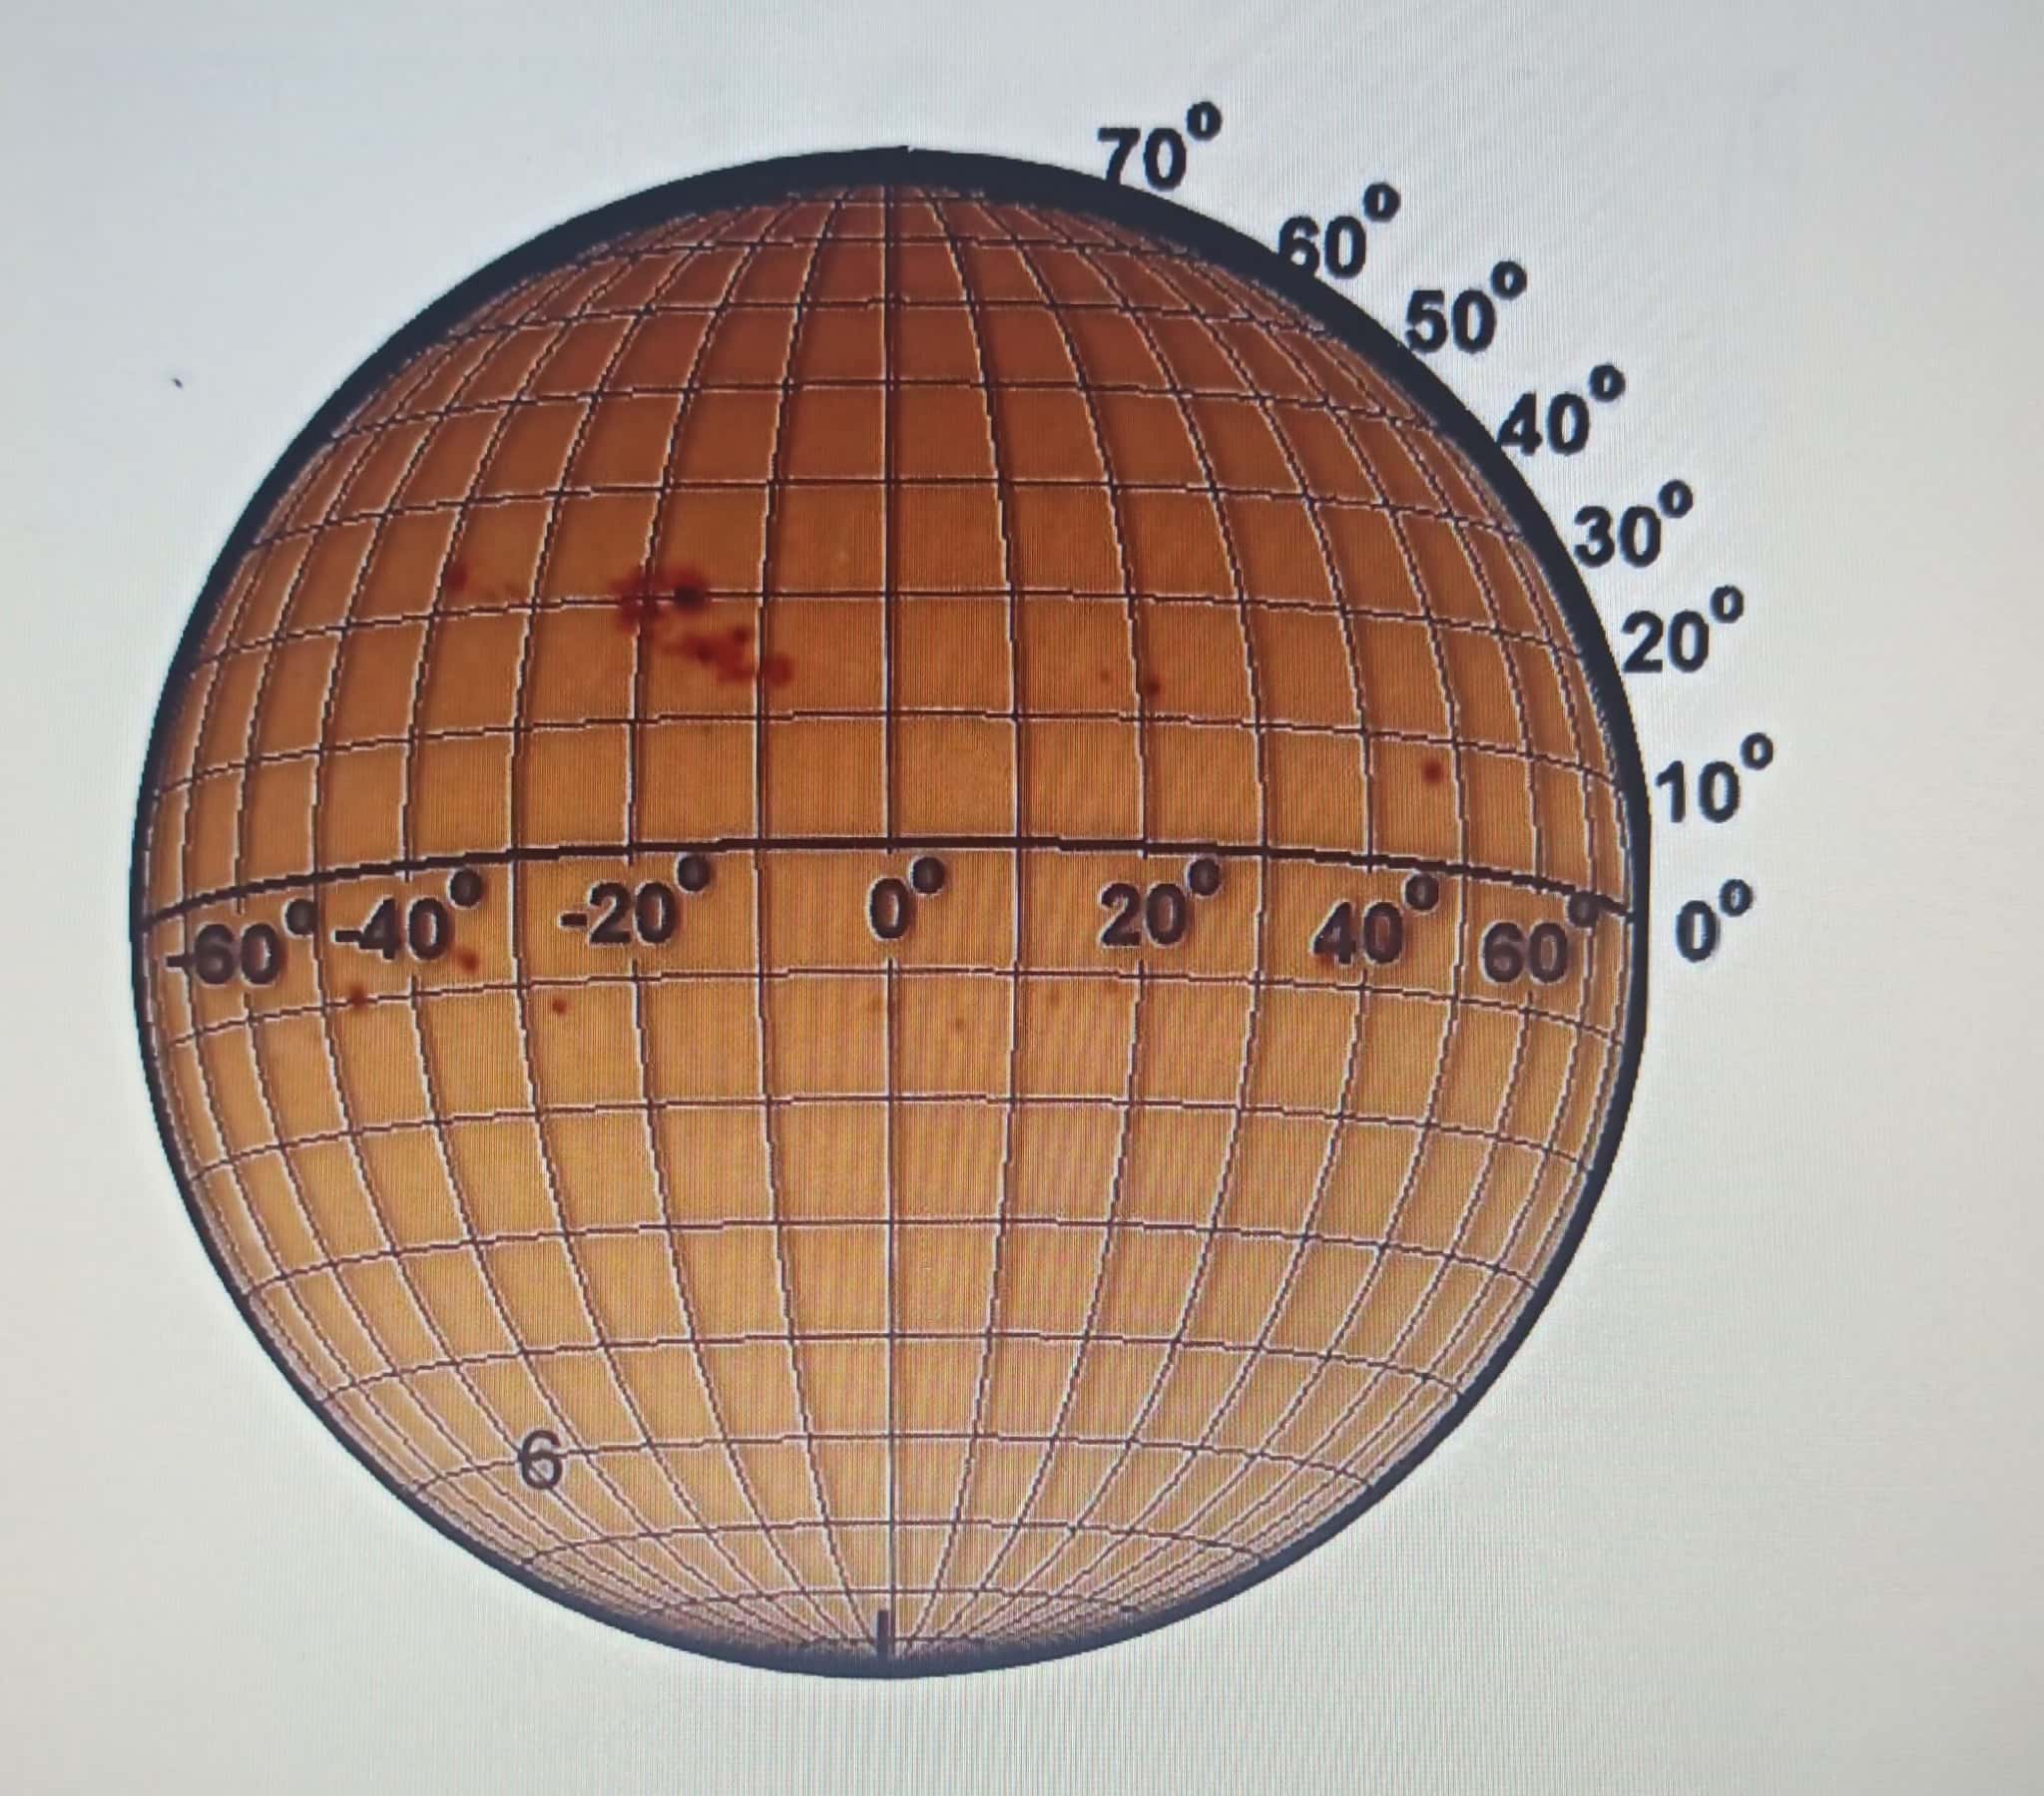
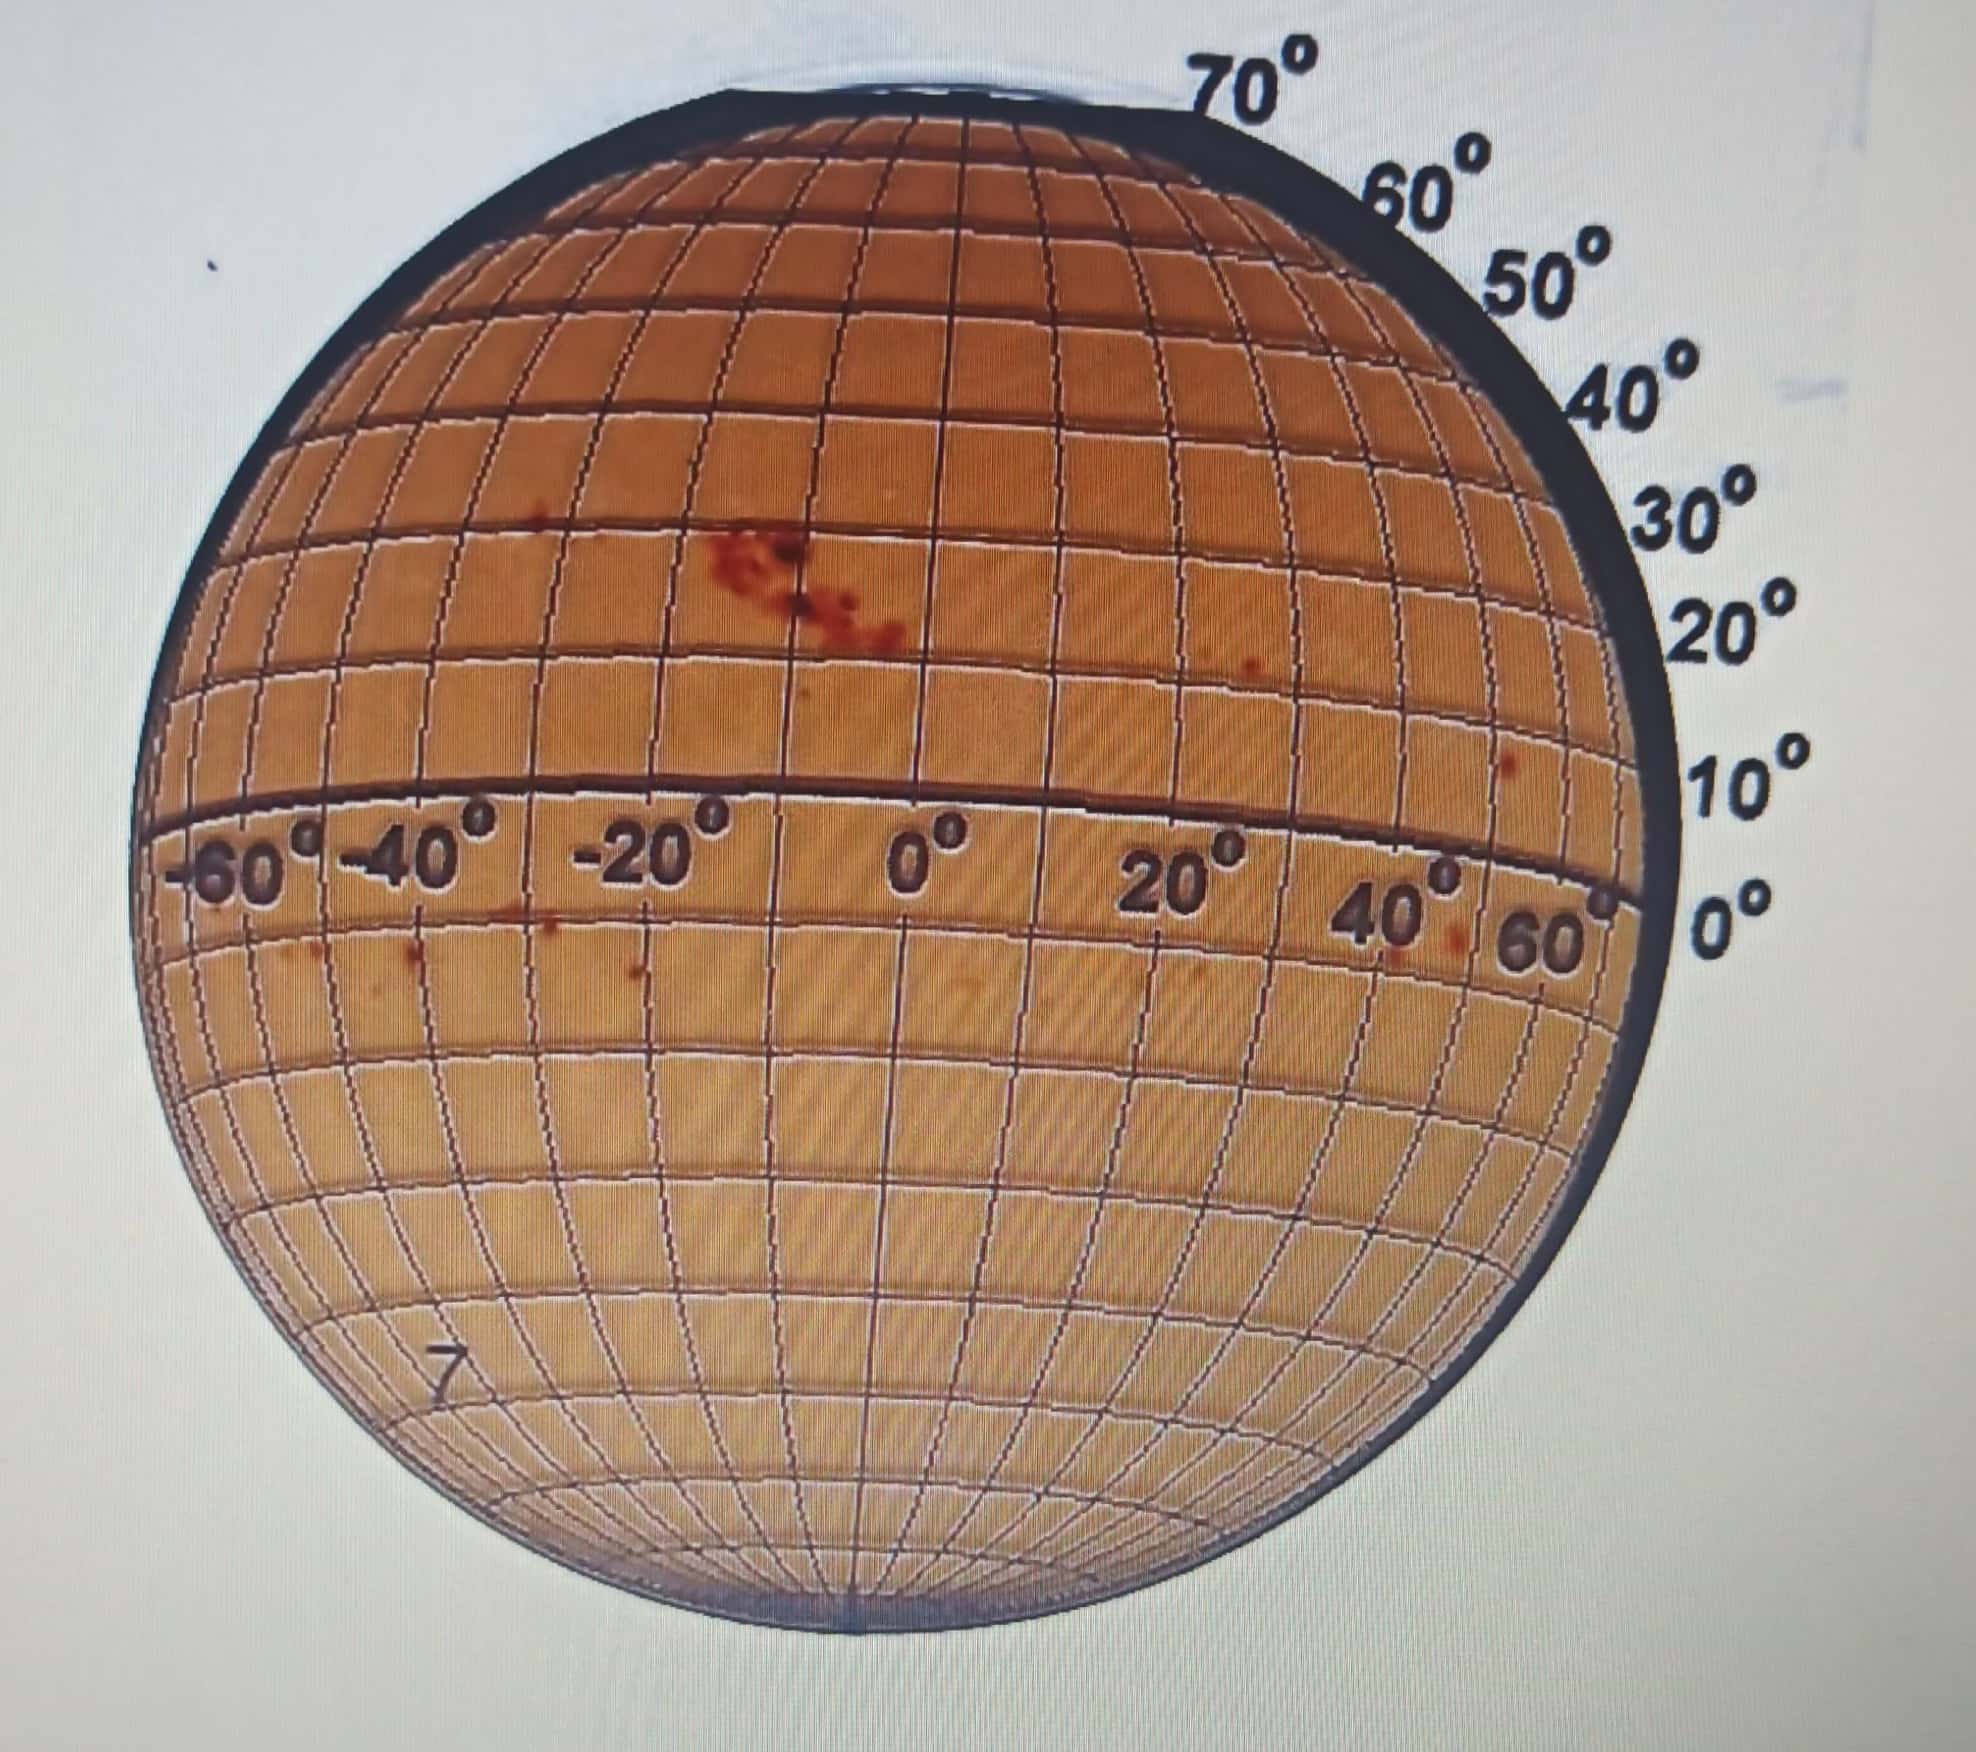
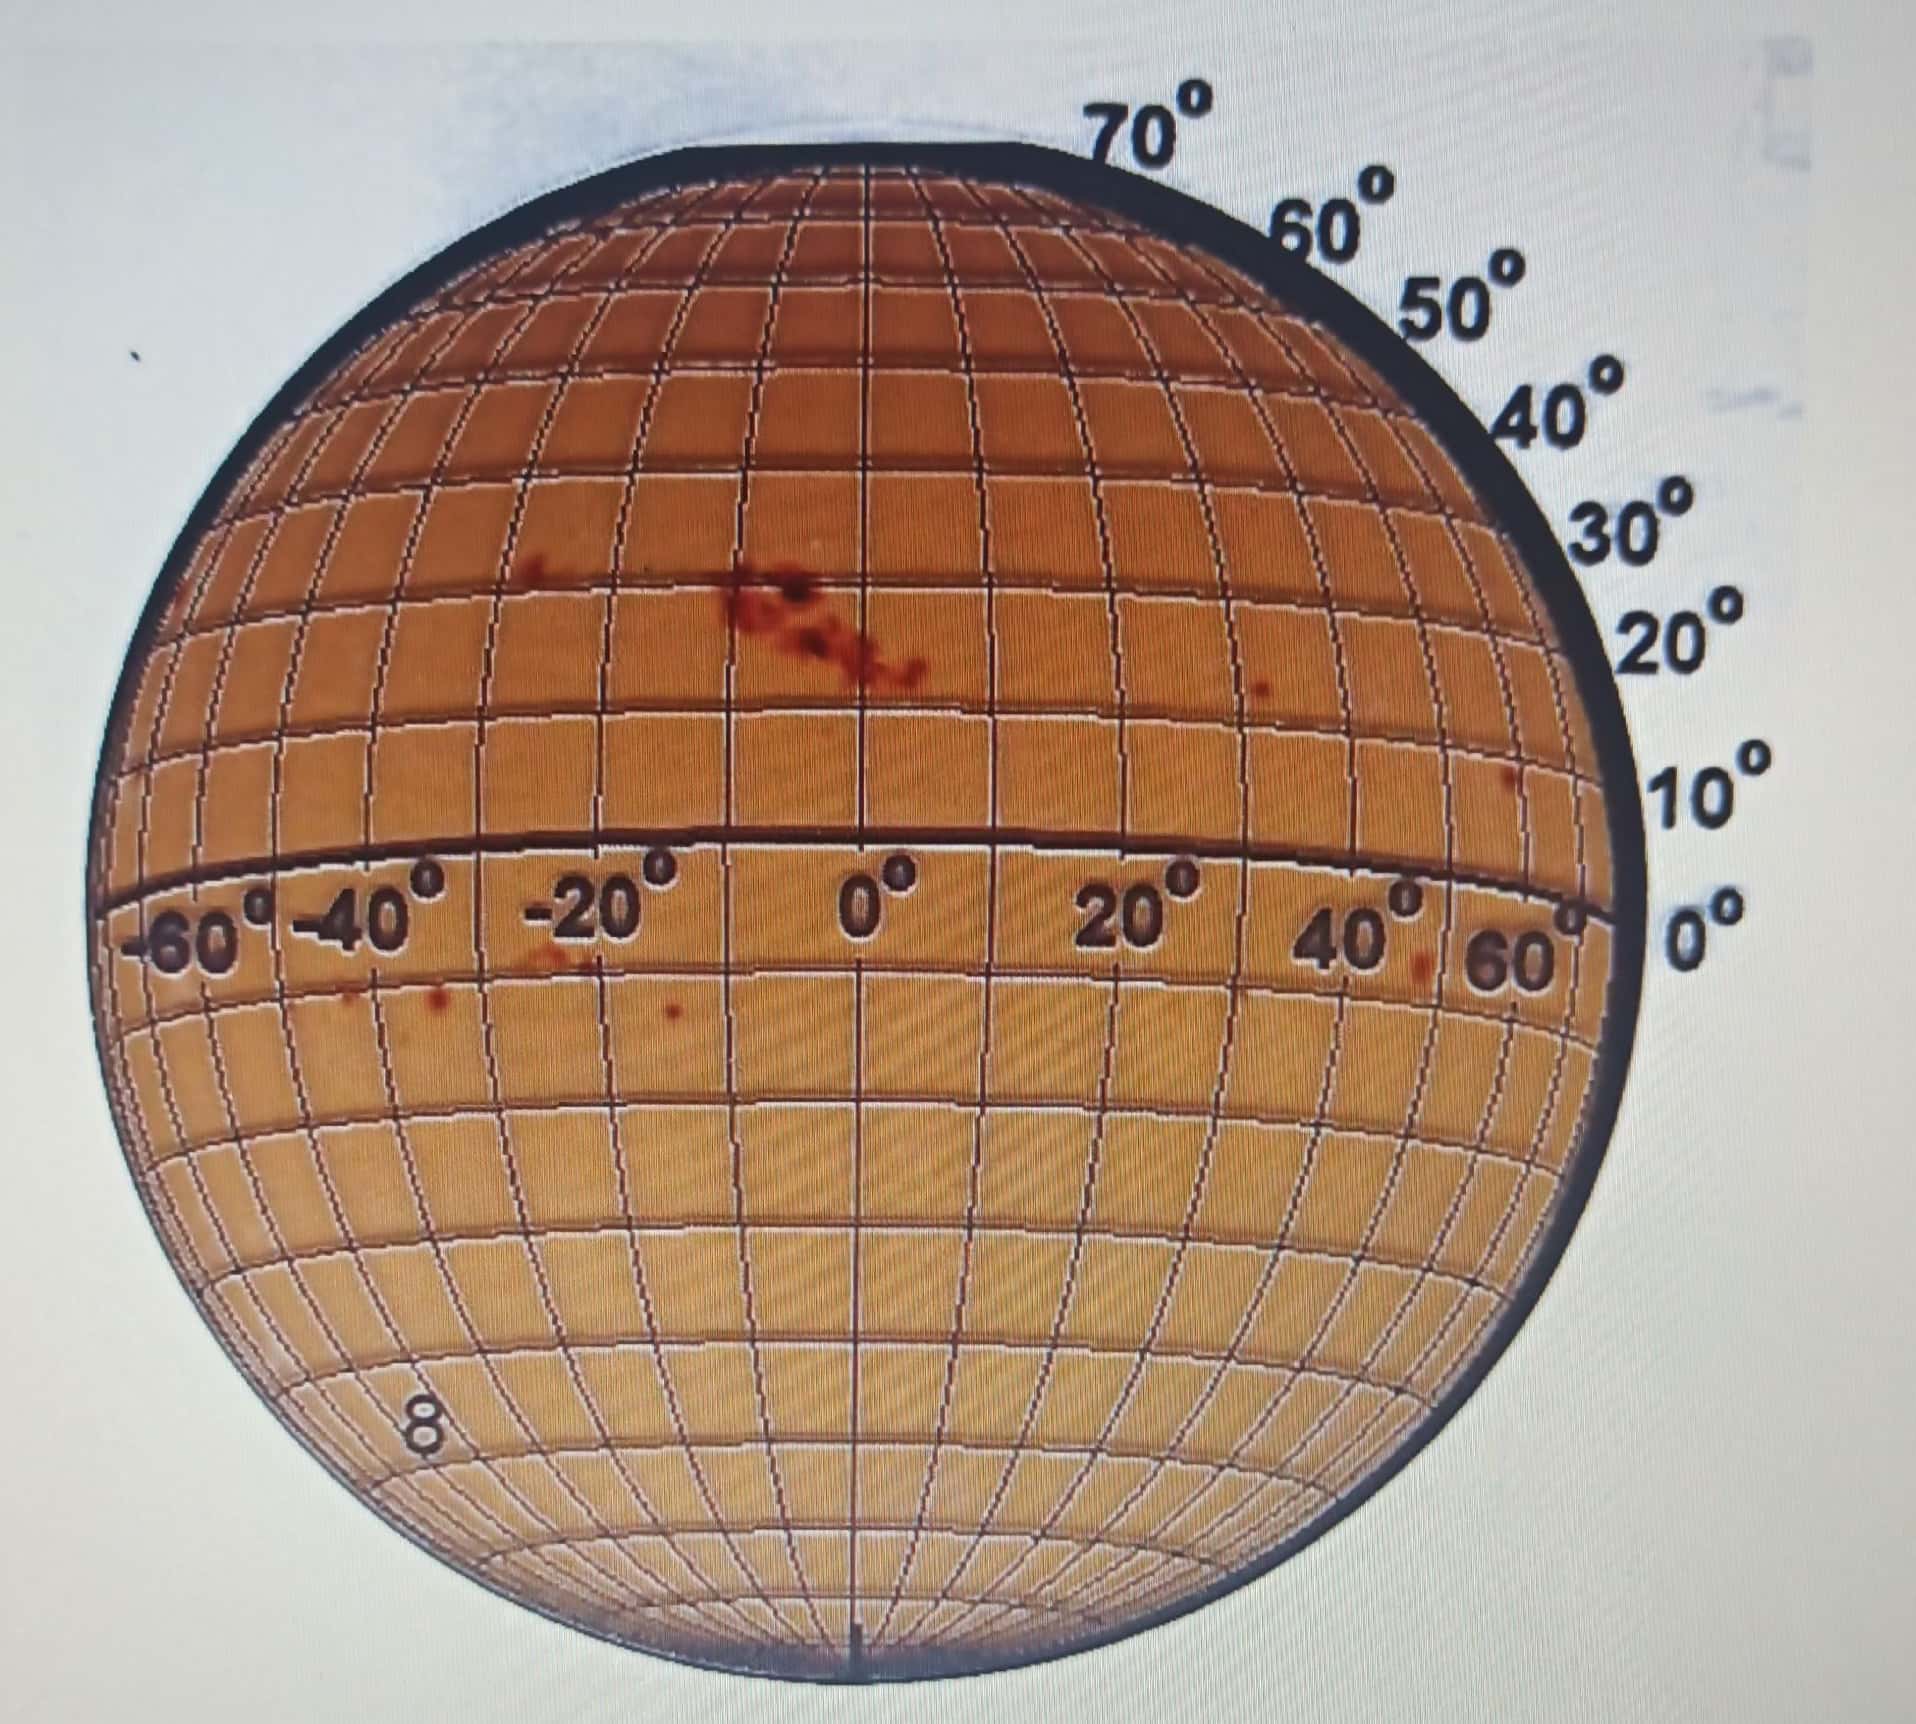
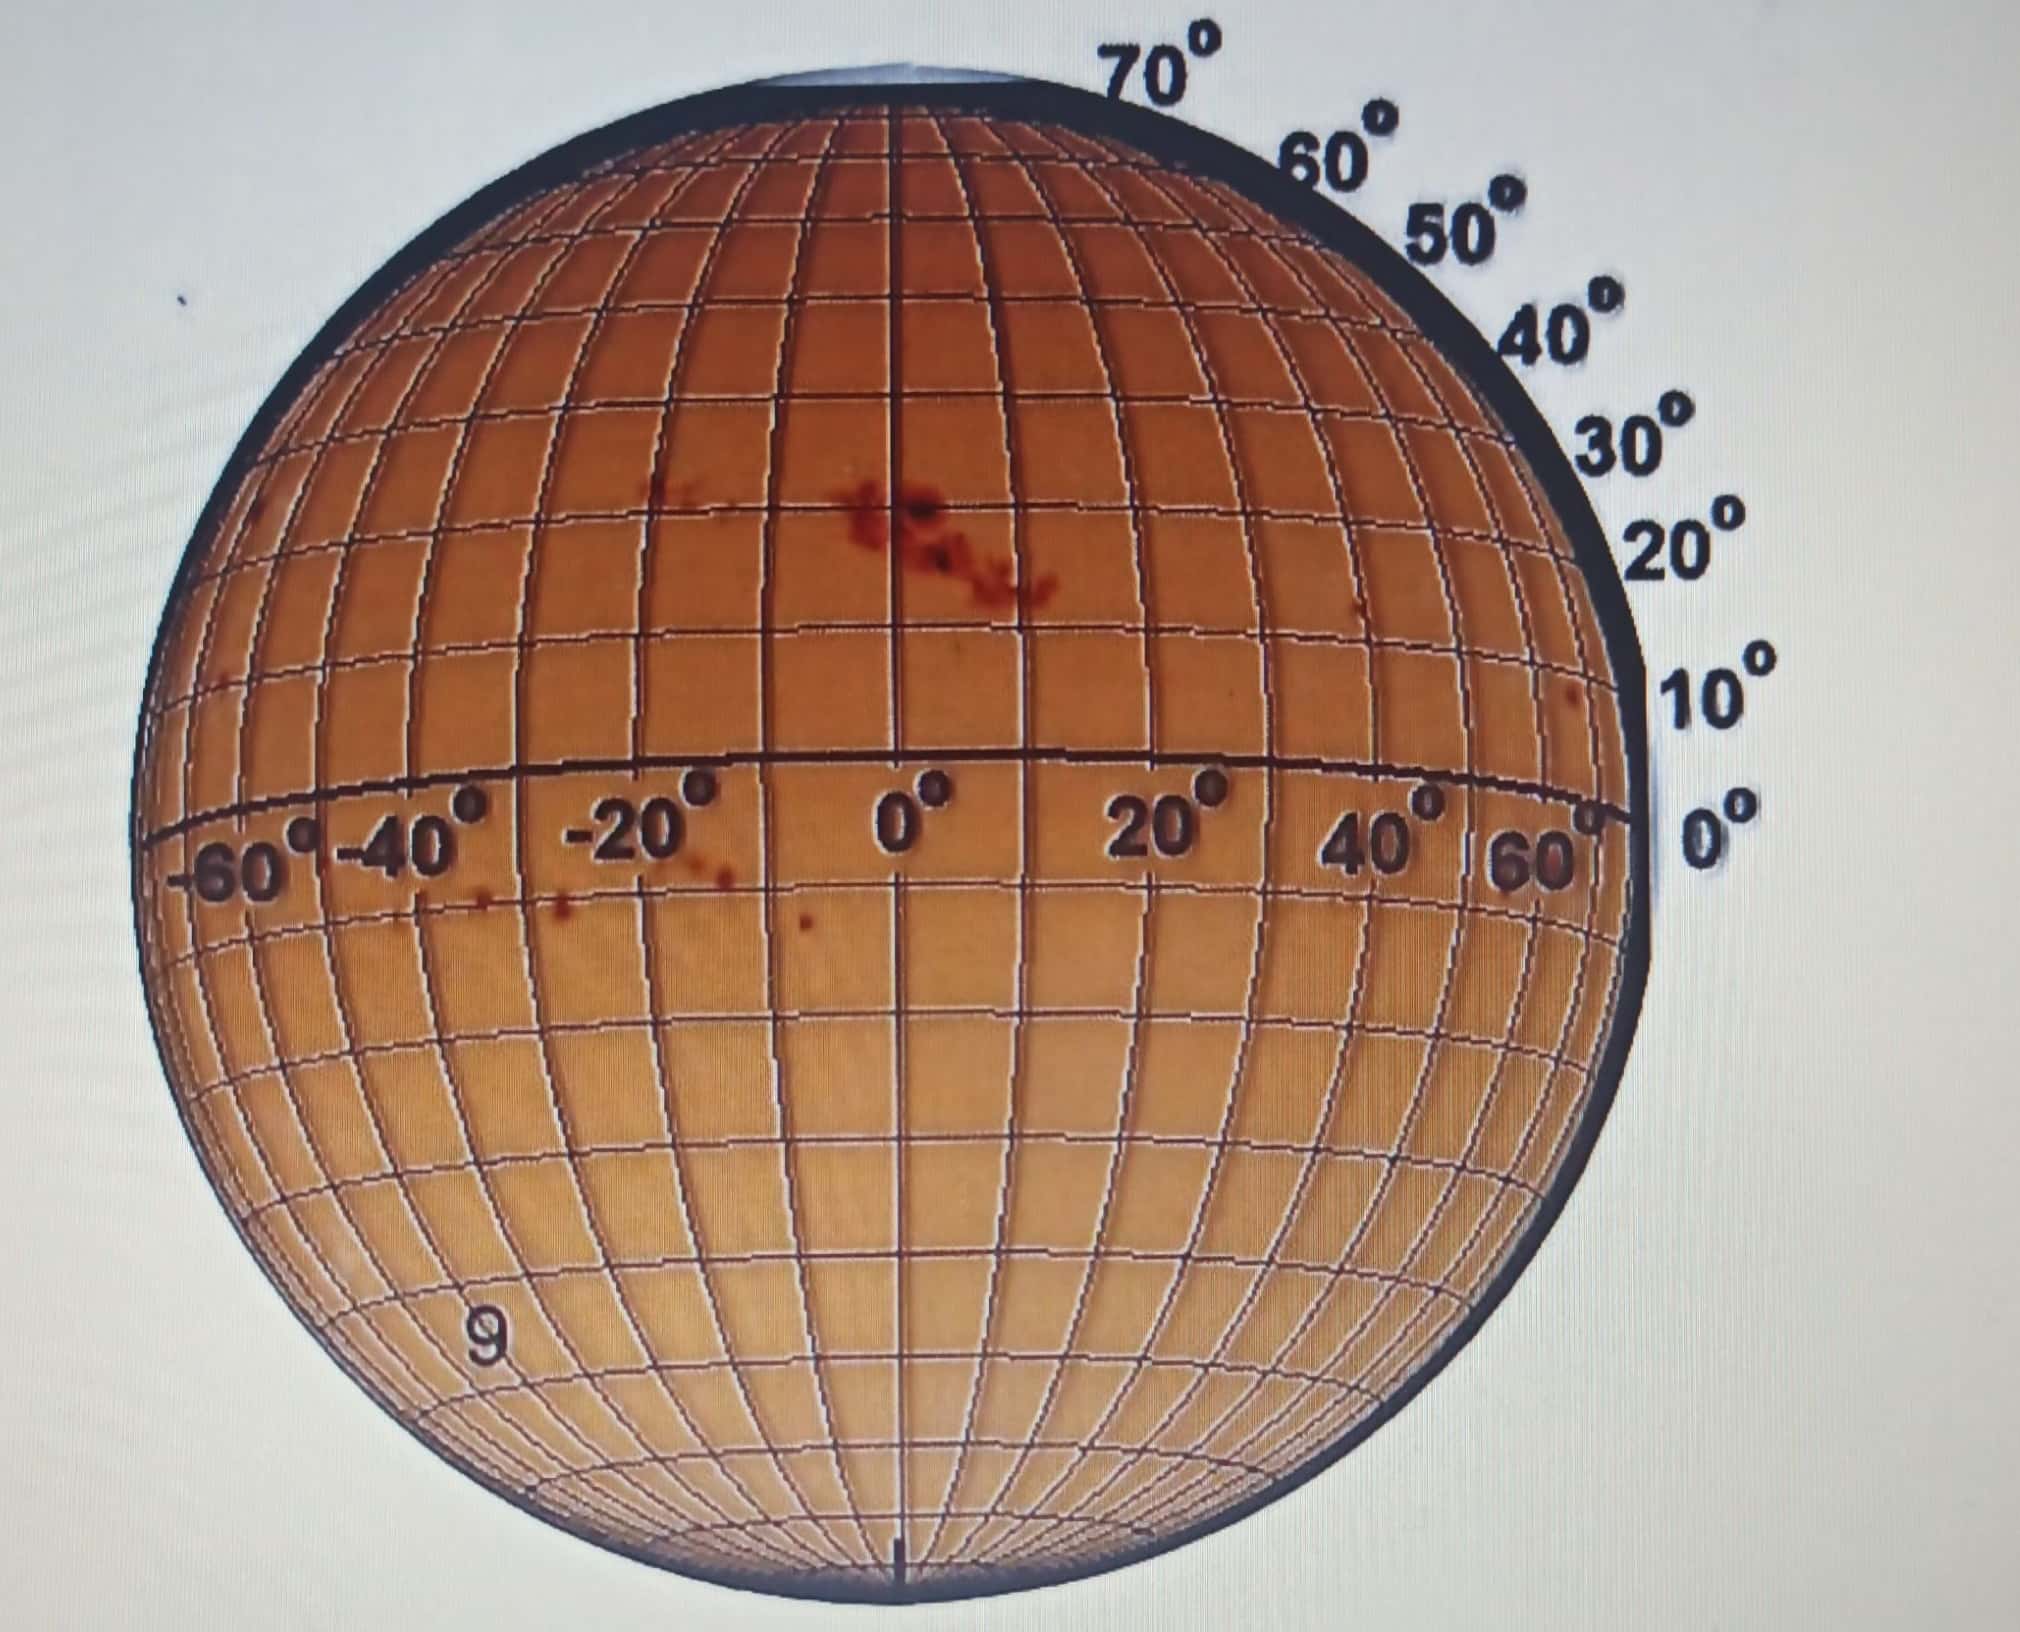
OBJECTIVE: . Learn about the basic functions of the Sun's rotation. - Determine an image scale. . See what the Sun looks like right now. INTRODUCTION: The Sun is the star at the center of our solar system. it is enormous apprOXImately 100 times as big as the Earthand generates its prodigious energy output via nuclear fusion in its core. The visible layer of the Sun is called its photosphere, which usually has dark marks on itsunspotswhich are cooler regions of strong magnetic activity. We can determine how quickly the Sun rotates by watching the sunspots move across the solar globe. Exterior to the photosphere is the chromospherea brightly colored region. Beyond that is the extended atmosphere of the Sun, called the corona. When interpreting photographs of objects. we can often learn about them by calculating the photograph's image scale. The image scale tells you how many km of real distance on an object is represented by the mm on the photograph. Image Scale Example: If a photograph of the Moon shows a crater 200 km across, but the crater is only 50 mm across in the photo, then the image scale is 200 km per 50 mm, or 4 km/mm. If you measure something else in the photograph that is 3 mm long, then you know that in real life the size of the object is: Size = 3 mm x 4 km/mm =12 km. PROCEDURE l: Solar rotation ' 1. \\You have sheets of solar images, showing the sunspots on the Sun during a few h solar image is numbered, and ' ., weeks of a recent spring season. Notice that eac 'cated with a small black tick mark. that the south polar region of the Sun is ind: Image number 5 has a sunspot circledthis will be our study object. Your transparent solar overlay indicates solar longitudes (ranging from -90 to +90) and solar latitudes (labelled only for northern latitudes). Place the transparent overlay over solar image #1. Carefully make sure the south pole of the overlay is positioned over the tick mark on the photograph. Measure the solar v EL \"Inc I 70 60 50 30 200 1609-40 -20 10 20 40 60 0 7270 50 40 30 200 10 0 609-40 -20" 20 40' 60 15latitude and longitude of the sunspot, recording your data in Table 1. Repeat this for all the images. ,'"' ""'\\- . ...,_,___J _ " \"a\". \\sTable A: Suns . at coordinates) 2. Plot the values of the sunspot's latitude on Figure 1, as a function of relative date from the date of the rst image. Fit the data with a straight line using a ruler. Label the line, \"latitude of sunspot." 3. Using a different pen color (but not red), plot the values of the sunspot's longitude on Figure 1, as a function of relative date from the date of the rst image. Fit the data with a straight line using a ruler. Make sure your line extends from the "0.0d" line on the left border of the graph, to the \"11.0 d" on the right graph border. Label the line. \"longitude of sunspot." Referring to the longitude line for your data on Figure 1, read off the data from your line. to complete the following (x,y) coordinates for your line. (Starting longitude, Date #1) = ( . 0.0 d) (Ending longitude, Date #2) = ( , 11.0 d) 70 50 40 30 20 609-40 -20 10 20 40 6070 50 40 30 609-40 20 -20 20 10 40 60 0 20Figure 1: Latitude and longitude of a sunspot Solar latitude or longitude 0.0 1.0 2.0 3.0 4.0 5.0 6.0 7.0 8.0 9.0 10.0 11.0 Relative date of image (d)70 60 50 40 30 0 200 609-40 -20 20" 10 40 60 0o WO5, From your values in procedure step #4, calculate the rate at which the sunspot help. is drifting across the sky, in "/day. Refer to the sample calculation #1, below, for Sunspot drift rate = Sample calculation #1 Suppose you obtained the following data from your longitude line: (Starting longitude, Date #1) = (-58, 0.0 d) (Ending longitude, Date #2) = (66, 11.0 d) The total change in longitude is: Ending longitude - starting longitude = 66 - (-58) = 124 The total change in time is: Date #2 - Date #1 = 11 day - 0 d day = 11 day The rate of sunspot drift is 124 / 11 day = 11.3 /day. 6, From your value for sunspot drift rate from procedure step #5, calculate the time it would take for the sunspot to drift 360 around the sun. Refer to the sample calculation #2, below, for help. Sunspot drift time = Sample calculation #1 Suppose you calculate the drift rate to be 11.3 /day. The Rate Equation (R = Q/T) can be solved for time: T = Q/R In this case, Q = 360, so T = Q/R = 360 / (11.3 /day) = 31.9 day PROCEDURE II: Size scales on the Sun 7. Figure #2 shows a giant group of sunspots, called AR 2192. The black horizontal scalebar at the lower right is equivalent to 9000 km long. Measure the length of the line, and calculate the scale of the photograph in km/mm. Solar image scale =70 60 50 30 20 609-40 -20 10 0 20 40 60\\ F'Qure 2: AR 2192 a Measure the size of the sunspot group. and using the scale from step #7, calculate the size of the sunspot group in km. Sunspot group size = km a Look up the diameter of the Earth in km. Using that. calculate how many Earth- diameters across the giant sunspot group is: Earth = km Sunspot group = Earths PROCEDURE Ill: The Sun today Time permitting, your instructor will show you a web site where you can see the appearance of the Sun within the last 24 hours. Look for sunspots or coronal activity. Sketch these features on the Sun template on the next page. 70 50 50 400 300 200 609-40 -20 10 20 40 60 5En Procedure step #6. you calculated how long it takes for a sunspot to drift around the Sun. But that was measured from the perspective of the Earth, which is also orbiting around the Sun. (Imagine if the Sun took 365 days to spin, sunspot; wouldn't appear to move at all, from the Earth's perspective.) However. we can easily correct for this. Your result from Procedure step #6 is actually called the sunspot's \"synodic period\" (PS). We can calculate the true period (PT), usually called the 'sidereal period," using the following equation: _PSXE T Ps + E or lpr=llPsXE)/(PSXE)D or E? l :0st l! I '37 P5+E 1 i l Where E w 365 dayerith this correction, what is your estimate for the rotational period of the Sun? Show your work. l am looking torIOhe answer here. 70 60 50 40 30 200 1609-40 -20 10 20 40 60
Step by Step Solution
There are 3 Steps involved in it

Get step-by-step solutions from verified subject matter experts