

Question: Hello! I need some help coming up with the analysis points for this. Would you be able to help me? The excel sheet is already
Hello! I need some help coming up with the analysis points for this. Would you be able to help me? The excel sheet is already done, I just need to answer each question but I am not an accounting major person. This is a MBA Class.
Please see the Module 2 folder in Resources for the spreadsheet that accompanies this problem. Using the spreadsheet and the information presented, extend the forecast for this company through 2016.
a. What is the company's projected external financing required in 2016? How does this number compare to the 2015 projection?
b. Perform a sensitivity analysis on this projection. How does the company's projected external financing required change if the ratio of cost of goods sold to net sales declines from 86 percent to 84 percent? If you link your assumptions in the pro forma to the cells containing the assumptions in the spreadsheet, it will be easy to change one number and see the resulting change.
c. Perform a scenario analysis on this projection. How does the company's projected external financing required change if a severe recession occurs in 2016? Assume net sales decline 5 percent, cost of goods sold rises to 88 percent of net sales due to price cutting, and current assets increase to 35 percent of net sales as management fails to cut purchases promptly in response to declining sales.
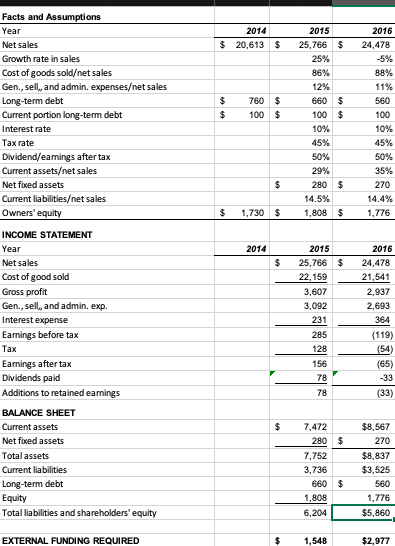
2014 20.613 $ $ $ 2016 24,478 -5% 88% 11% $ 560 Facts and Assumptions Year Net sales Growth rate in sales Cost of goods soldet sales Gen., sell, and admin. expenseset sales Long-term debt Current portion long-term debt Interest rate Tax rate Dividend/earnings after tax Current assetset sales Net foxed assets Current liabilitieset sales Owners' equity $ $ 760 100 $ $ 2015 25,766 25% 86% 12% 660 100 10% 45% 50% 29% 280 14.5% 1,808 100 10% 45% 50% 35% 270 14.4% 1,776 $ $ 1,730 $ $ 2014 $ 2015 25,766 22,159 3,607 3,092 231 285 128 2016 24,478 21,541 2,937 2,693 364 (119) (54) (65) 156 INCOME STATEMENT Year Net sales Cost of good sold Gross profit Gen., sell, and admin. exp. Interest expense Earnings before tax Tax Earnings after tax Dividends paid Additions to retained earnings BALANCE SHEET Current assets Net foxed assets Total assets Current liabilities Long-term debt Equity Total liabilities and shareholders' equity (33) 7.472 $8.567 280 $ 270 7.752 $8,837 3,736 $3,525 660 $ 560 1.808 1,776 6,2043520 EXTERNAL FUNDING REQUIRED 1,548 $2,977 2014 20.613 $ $ $ 2016 24,478 -5% 88% 11% $ 560 Facts and Assumptions Year Net sales Growth rate in sales Cost of goods soldet sales Gen., sell, and admin. expenseset sales Long-term debt Current portion long-term debt Interest rate Tax rate Dividend/earnings after tax Current assetset sales Net foxed assets Current liabilitieset sales Owners' equity $ $ 760 100 $ $ 2015 25,766 25% 86% 12% 660 100 10% 45% 50% 29% 280 14.5% 1,808 100 10% 45% 50% 35% 270 14.4% 1,776 $ $ 1,730 $ $ 2014 $ 2015 25,766 22,159 3,607 3,092 231 285 128 2016 24,478 21,541 2,937 2,693 364 (119) (54) (65) 156 INCOME STATEMENT Year Net sales Cost of good sold Gross profit Gen., sell, and admin. exp. Interest expense Earnings before tax Tax Earnings after tax Dividends paid Additions to retained earnings BALANCE SHEET Current assets Net foxed assets Total assets Current liabilities Long-term debt Equity Total liabilities and shareholders' equity (33) 7.472 $8.567 280 $ 270 7.752 $8,837 3,736 $3,525 660 $ 560 1.808 1,776 6,2043520 EXTERNAL FUNDING REQUIRED 1,548 $2,977
Step by Step Solution
There are 3 Steps involved in it

Get step-by-step solutions from verified subject matter experts