

Question: Hello i need the answer as soon as possible please: Use the below cumulative frequency graph to determine if the data is normally distributed or
Hello i need the answer as soon as possible please:
Use the below cumulative frequency graph to determine if the data is normally distributed or not. Explain your reasoning????????
please give me correct answer and in X-axis why put the classes not the upper class boundary ?
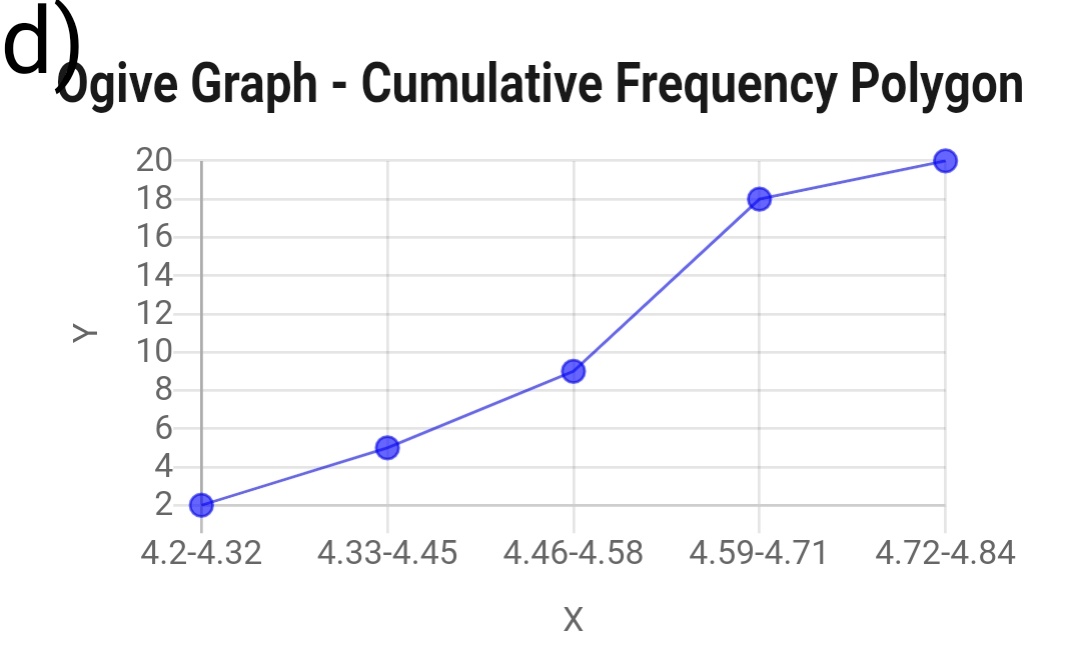
d Ogive Graph - Cumulative Frequency Polygon 20 18 16 14 12 10 NAO. OOC 4.2-4.32 4.33-4.45 4.46-4.58 4.59-4.71 4.72-4.84 X
Step by Step Solution
There are 3 Steps involved in it
1 Expert Approved Answer
Step: 1 Unlock

Question Has Been Solved by an Expert!
Get step-by-step solutions from verified subject matter experts
Step: 2 Unlock
Step: 3 Unlock