

Question: Hello! I need the formulas for this problem! Im trying to learn how to put in the formulas so I would appriciate it if someone
Hello! I need the formulas for this problem! Im trying to learn how to put in the formulas so I would appriciate it if someone could give me the formulas. Below is the directions stated and the 2nd photo is the assignment
can someone tell me how this isn't clear?
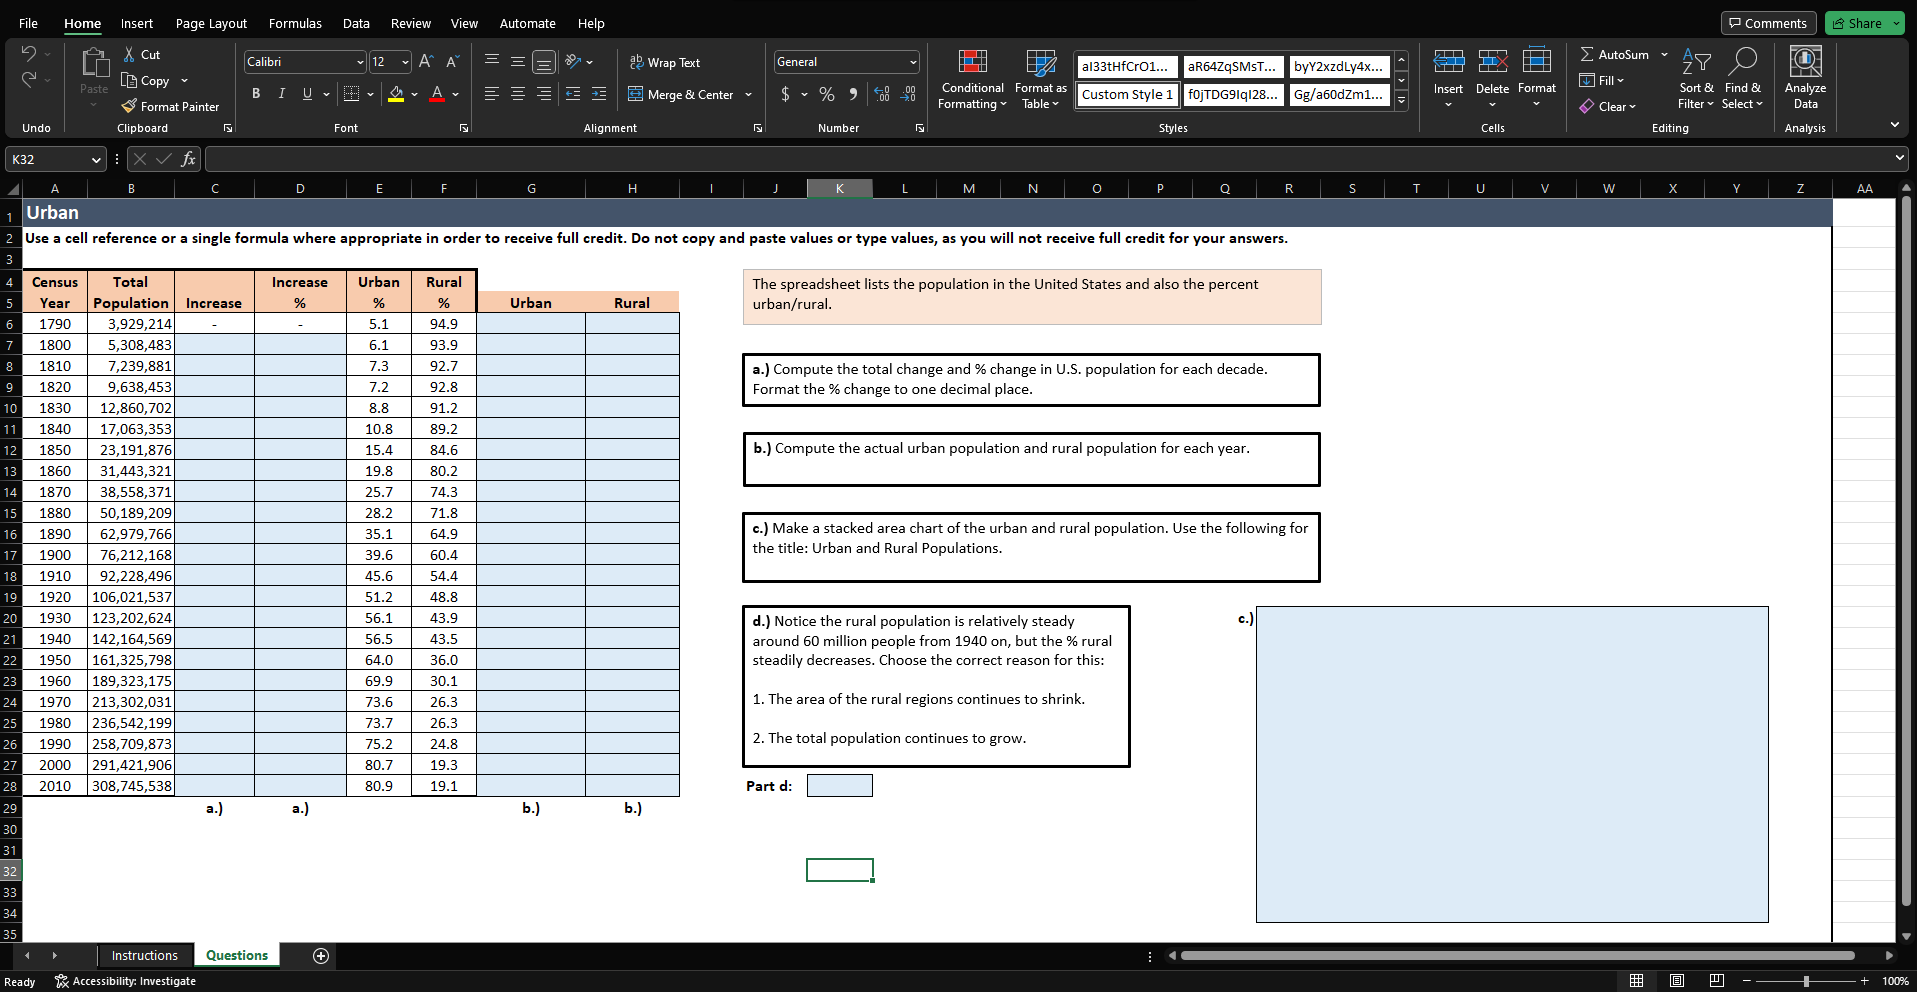
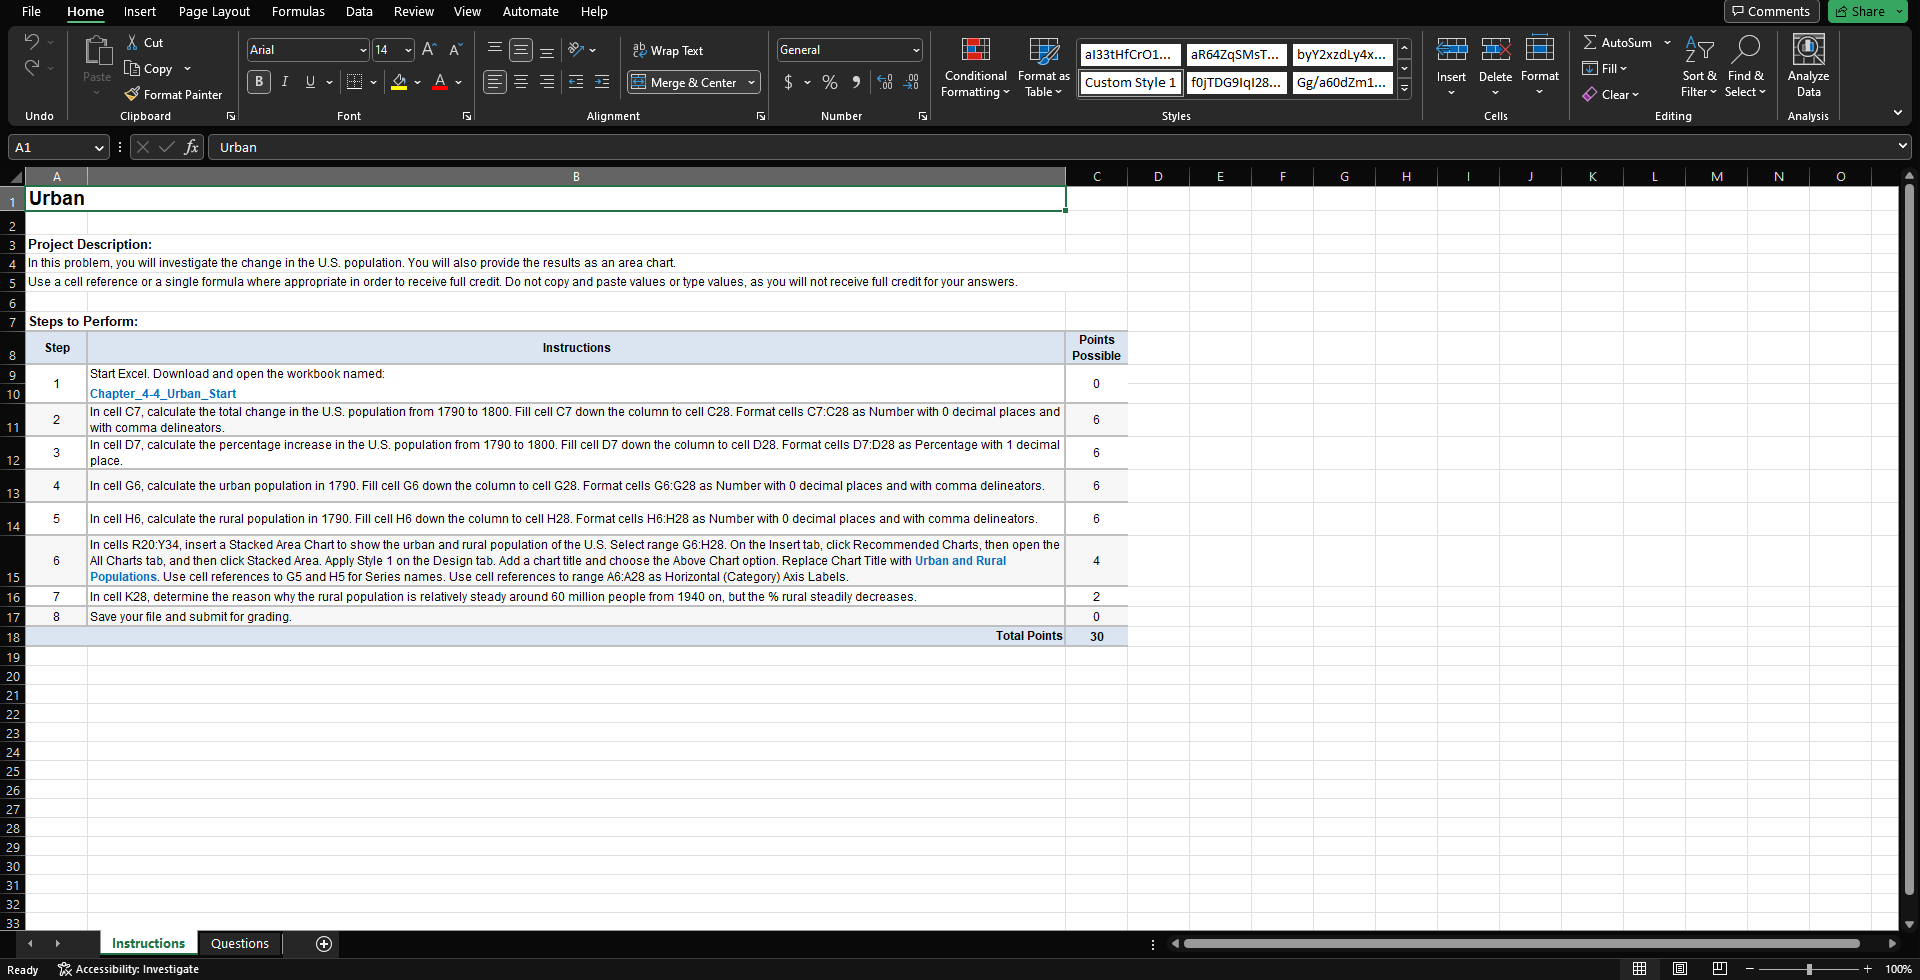 File Home Data Review View Automate Help Comments Share ~ Insert Page Layout Formulas & Cut _ AutoSum Calibri 12 ~ A 207 B Wrap Text General al33tHfCro1... aR64ZqSMsT... byY2xzdLy4X... AY O Sort & Find & Analyze Paste Copy Insert Delete Format Fill ~ B A E Merge & Center ~ $ ~ % " 08 398 Conditional Format as Table v Custom Style 1 fojTDG91q128... Gg/a60dzml... Format Painter Formatting v Clear Filter ~ Select v Data Cells Editing Undo Clipboard Font Alignment Number Styles Analysis K32 fx D G M N O P Q R S U V W AA Urban Use a cell reference or a single formula where appropriate in order to receive full credit. Do not copy and paste values or type values, as you will not receive full credit for your answers. Census Total Increase Urban Rural The spreadsheet lists the population in the United States and also the percent Year Population Increase % % % Urban Rural urban/rural. 1790 3,929,214 5.1 94.9 1800 5,308,483 6.1 93.9 1810 7,239,881 7.3 92.7 a.) Compute the total change and % change in U.S. population for each decade 1820 9,638,453 7.2 92.8 Format the % change to one decimal place. 1830 12,860,702 8.8 91.2 1840 17,063,353 10.8 89.2 1850 23,191,876 15.4 84.6 b.) Compute the actual urban population and rural population for each year. 1860 31,443,321 19.8 30.2 1870 38,558,371 25.7 74.3 1880 50,189,209 28.2 71.8 1890 62,979,766 35.1 64.9 c.) Make a stacked area chart of the urban and rural population. Use the following for 1900 76,212,168 39.6 60.4 the title: Urban and Rural Populations. 1910 92,228,496 45.6 54.4 1920 106,021,537 51.2 48.8 1930 123,202,624 56.1 43.9 d.) Notice the rural population is relatively steady 1940 142,164,569 56.5 43.5 around 60 million people from 1940 on, but the % rural 1950 161,325,798 64.0 36.0 steadily decreases. Choose the correct reason for this: 1960 189,323,175 69.9 30.1 1970 213,302,031 73.6 26.3 1. The area of the rural regions continues to shrink. 1980 236,542,199 73.7 26.3 1990 258,709,873 75.2 24.8 2. The total population continues to grow. 2000 291,421,906 80.7 19.3 2010 308,745,538 80.9 19. Part d: 29 a.) a. ) b.) b. ) 35 Instructions Questions + Ready Accessibility: Investigate 100%File Home Insert Page Layout Formulas Data Review View Automate Help Comments Share K Cut Arial 14 29 Wrap Text General 2 AutoSum 133tHfCro1... aR64ZqSMST... byY2xzdLy4x... AY O Past Copy BI UVV MV Merge & Center Conditional Format as Fill A Custom Style 1 OjTDG91q128... Sort & Find & Analyze Formatting Table v g/a60dzml... Insert Delete Format Format Painter Clear Filter * Select v Data Undo Clipboard Font Alignment Number Styles Cells Editing Analysis A1 X fx Urban B D E G H M N O Urban W Project Description: In this problem, you will investigate the change in the U.S. population. You will also provide the results as an area chart. Use a cell reference or a single formula where appropriate in order to receive full credit. Do not copy and paste values or type values, as you will not receive full credit for your answers. Steps to Perform: Points Step Instructions 100 Possible Start Excel. Download and open the workbook named: 10 Chapter_4-4_Urban_Start 2 In cell C7, calculate the total change in the U.S. population from 1790 to 1800. Fill cell C7 down the column to cell C28. Format cells C7:C28 as Number with 0 decimal places and 11 with comma delineators 6 3 In cell D7, calculate the percentage increase in the U.S. population from 1790 to 1800. Fill cell D7 down the column to cell D28. Format cells D7:D28 as Percentage with 1 decimal 6 12 place 4 13 In cell G6, calculate the urban population in 1790. Fill cell G6 down the column to cell G28. Format cells G6:G28 as Number with 0 decimal places and with comma delineators. 6 5 6 14 In cell H6, calculate the rural population in 1790. Fill cell H6 down the column to cell H28. Format cells H6:H28 as Number with 0 decimal places and with comma delineators. In cells R20:Y34, insert a Stacked Area Chart to show the urban and rural population of the U.S. Select range G6:H28. On the Insert tab, click Recommended Charts, then open the 6 All Charts tab, and then click Stacked Area. Apply Style 1 on the Design tab. Add a chart title and choose the Above Chart option. Replace Chart Title with Urban and Rural 4 15 Populations. Use cell references to G5 and H5 for Series names. Use cell references to range A6:A28 as Horizontal (Category) Axis Labels. 16 7 In cell K28, determine the reason why the rural population is relatively steady around 60 million people from 1940 on, but the % rural steadily decreases. 2 8 Save your file and submit for grading. 0 18 Total Points 30 Instructions Questions + Ready 1% Accessibility: Investigate 100%
 Step by Step Solution
There are 3 Steps involved in it
1 Expert Approved Answer
Step: 1 Unlock

Question Has Been Solved by an Expert!
Get step-by-step solutions from verified subject matter experts
Step: 2 Unlock
Step: 3 Unlock