

Question: Hello !! I need this statistic problem's solution ( code ) in python. Thank you !! 25. The following sample data are the midterm examination
Hello !! I need this statistic problem's solution ( code ) in python. Thank you !! 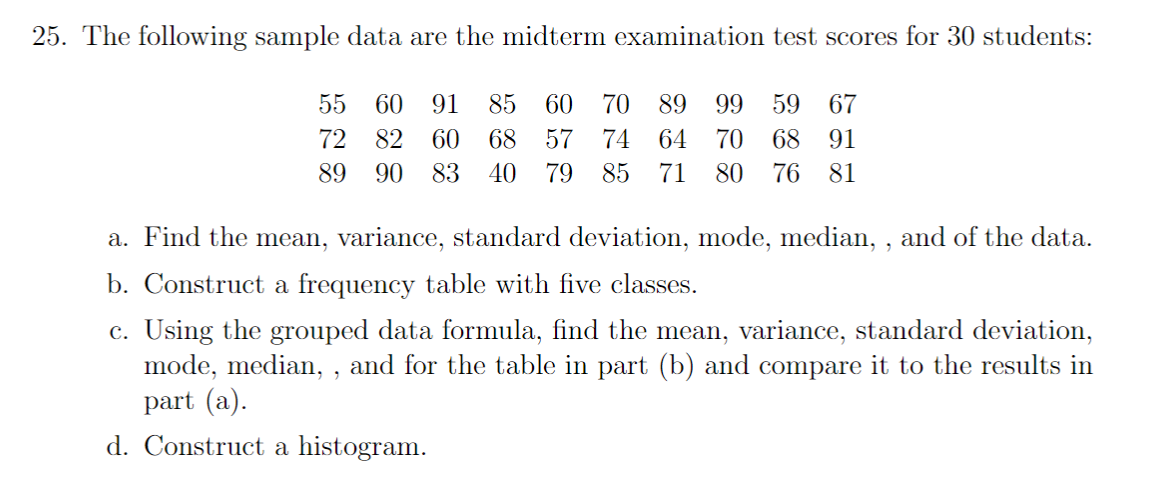
25. The following sample data are the midterm examination test scores for 30 students: 55 60 72 89 60 91 85 82 60 68 90 83 40 57 79 70 89 99 74 64 70 85 71 80 59 67 68 91 76 81 9 a. Find the mean, variance, standard deviation, mode, median, , and of the data. b. Construct a frequency table with five classes. c. Using the grouped data formula, find the mean, variance, standard deviation, mode, median, , and for the table in part (b) and compare it to the results in part (a). d. Construct a histogram
Step by Step Solution
There are 3 Steps involved in it
1 Expert Approved Answer
Step: 1 Unlock

Question Has Been Solved by an Expert!
Get step-by-step solutions from verified subject matter experts
Step: 2 Unlock
Step: 3 Unlock