

Question: Hello, I need to make a script that will create a scatterplot using seaborn as sns. I DONT have to use matplotlib. Only SEABORN for
Hello, I need to make a script that will create a scatterplot using seaborn as sns. I DONT have to use matplotlib. Only SEABORN for scatterplot. I already have a script that reads a fasta file and generates a C VS G score and gives me a list of integers. I need to make a graph that will use that given list of integers as a value on Y-AXIS. There are two ways this can be done, I can either write those integers to a file, then read the file for graphing, or graph straight away using the list of integers for the y-axis. Can you please write a script where this works and creates a Scatterplot? I don't know what the x axis should be, maybe index position but I don't know exactly. I have attached my scripts that works, I just need to graph(scatterplot) the fasta file c vs g score it reads.
I already asked this question one Time and and I only got people replying with matplotlib. I don't have to use matplotlib. I have to use seaborn as sns. 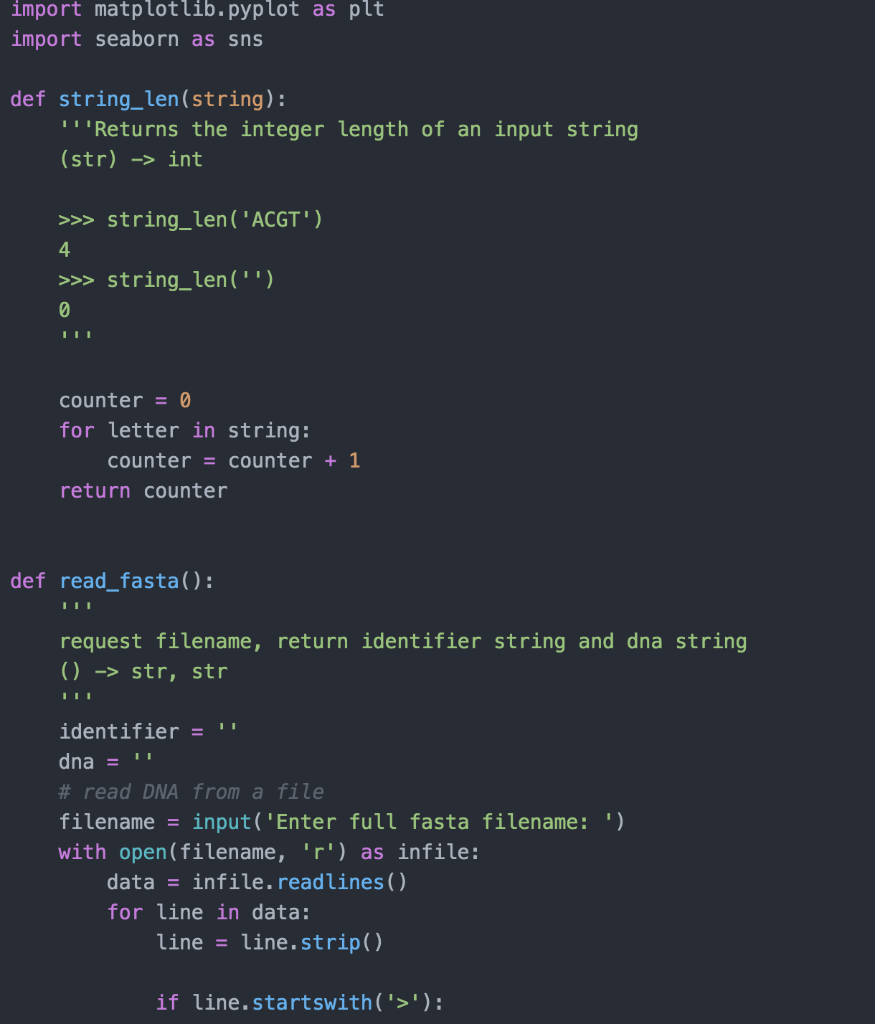
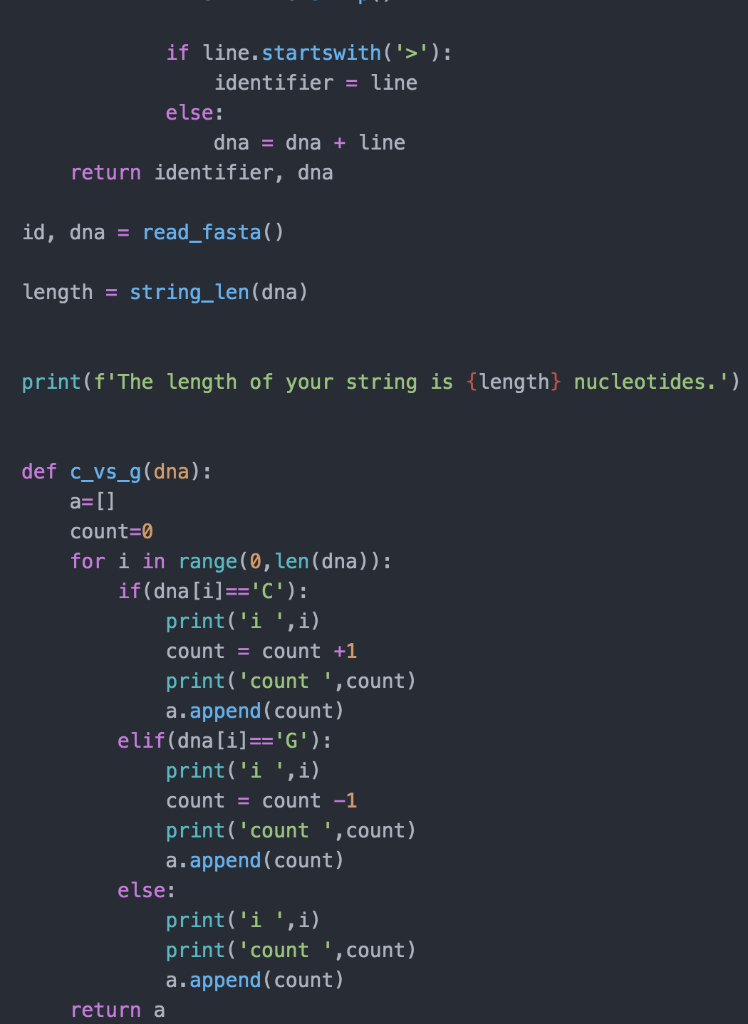
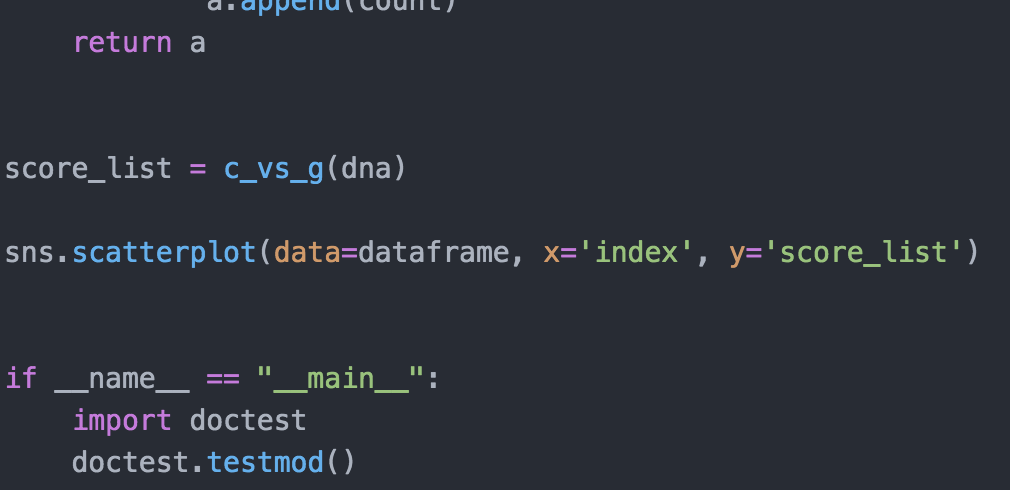
import matplotlib.pyplot as plt import seaborn as sns def string_len(string): "'Returns the integer length of an input string (str) -> int >>> string_len ('ACGT') 4 >>> string_len ('') 0 counter = 0 for letter in string: counter = counter + 1 return counter def read_fasta(): request filename, return identifier string and dna string ( > str, str identifier = 1 dna = 1 # read DNA from a file filename = input('Enter full fasta filename: ') with open(filename, 'r') as infile: data = infile. readlines (). for line in data: line = line.strip() if line.startswith('>'): if line.startswith('>'): identifier = line else: dna = dna + line return identifier, dna id, dna = read_fasta() length = string_len(dna) print(f'The length of your string is {length} nucleotides.') def c_vs_g(dna): a=[] count=0 for i in range(0, len(dna)): if(dna[i]=='C'): print('i ',i) count = count +1 print('count ', count) a.append(count) elif(dna[i]=='G'): print('i ',i) count = count -1 print('count ', count) a.append(count) else: print('i ',i) print('count ', count) a.append(count) return a return a score_list C_vs_g(dna) sns.scatterplot(data=dataframe, x='index', y='score_list') if name "_main__": import doctest doctest. testmod()
Step by Step Solution
There are 3 Steps involved in it

Get step-by-step solutions from verified subject matter experts