

Question: Hello, i need your help please 82 11 The estimated variance of the mean is, 33 a 45.551 34 48.284 35 0.398 36 0.422 87
Hello, i need your help please
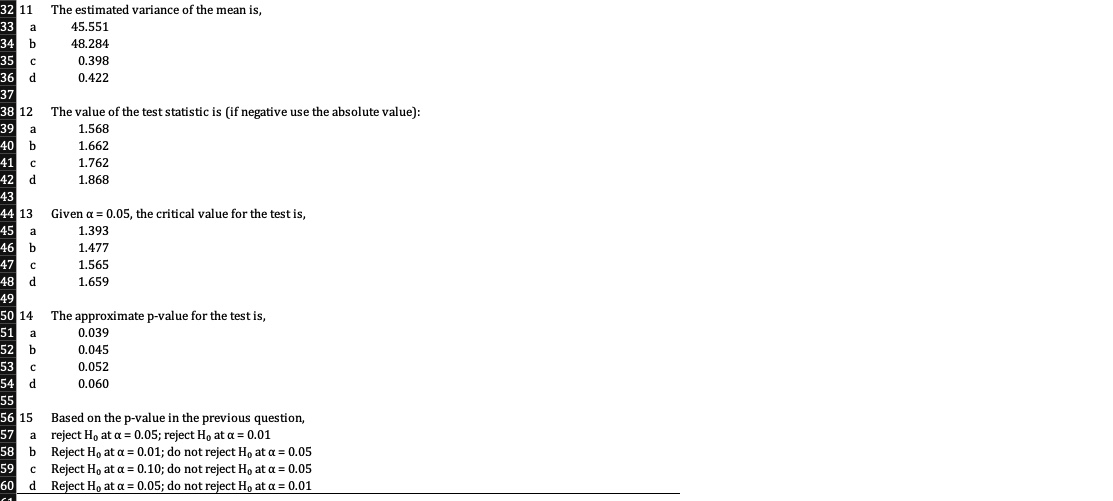
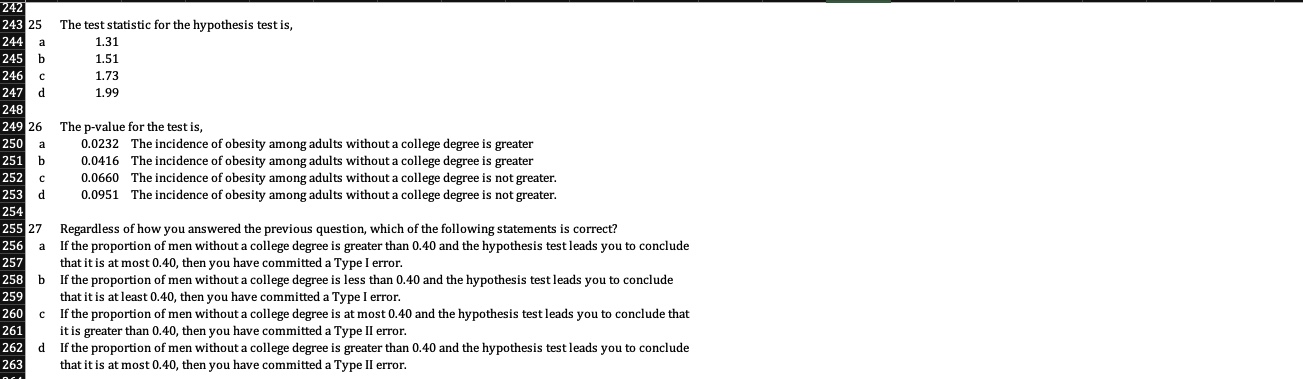
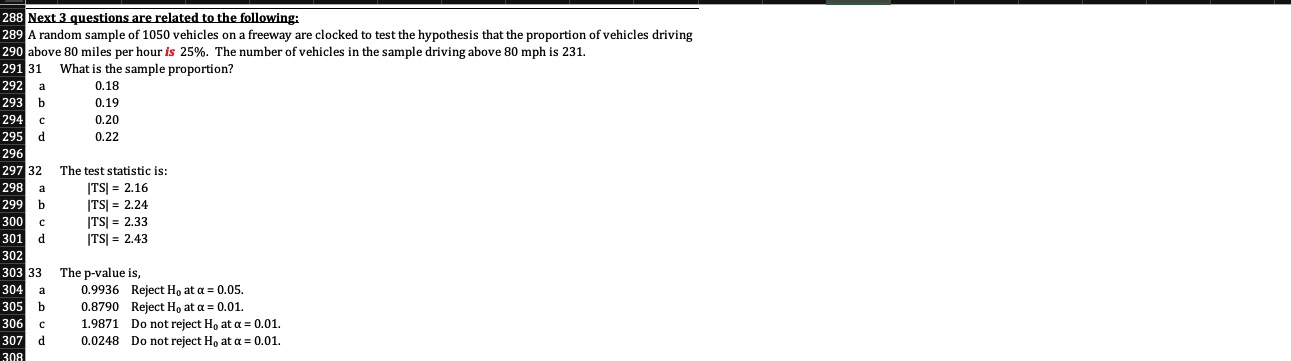
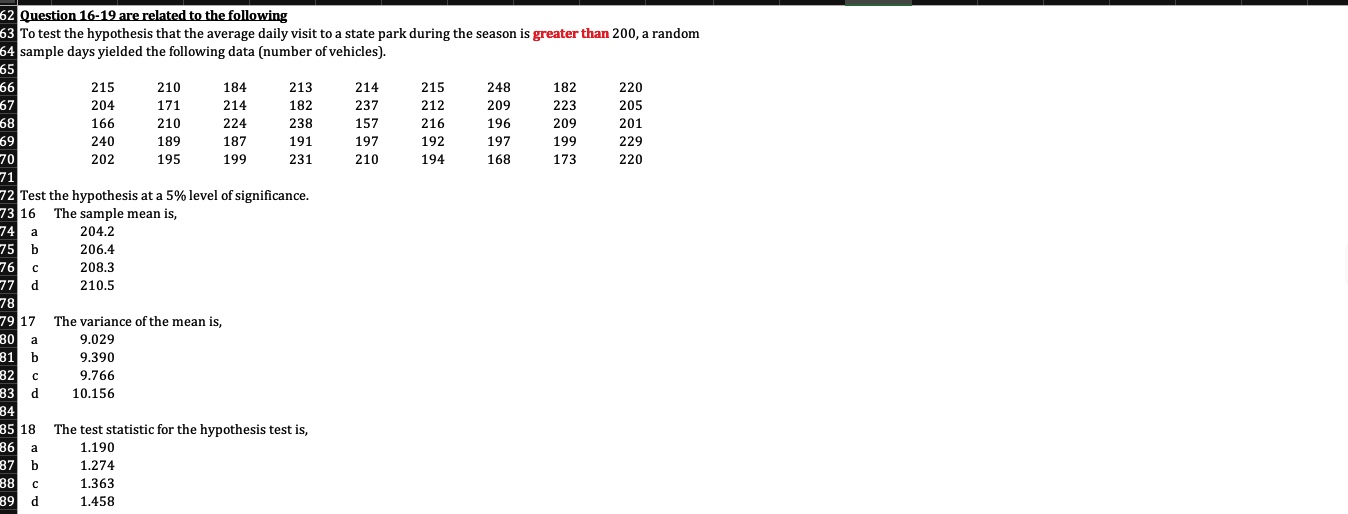
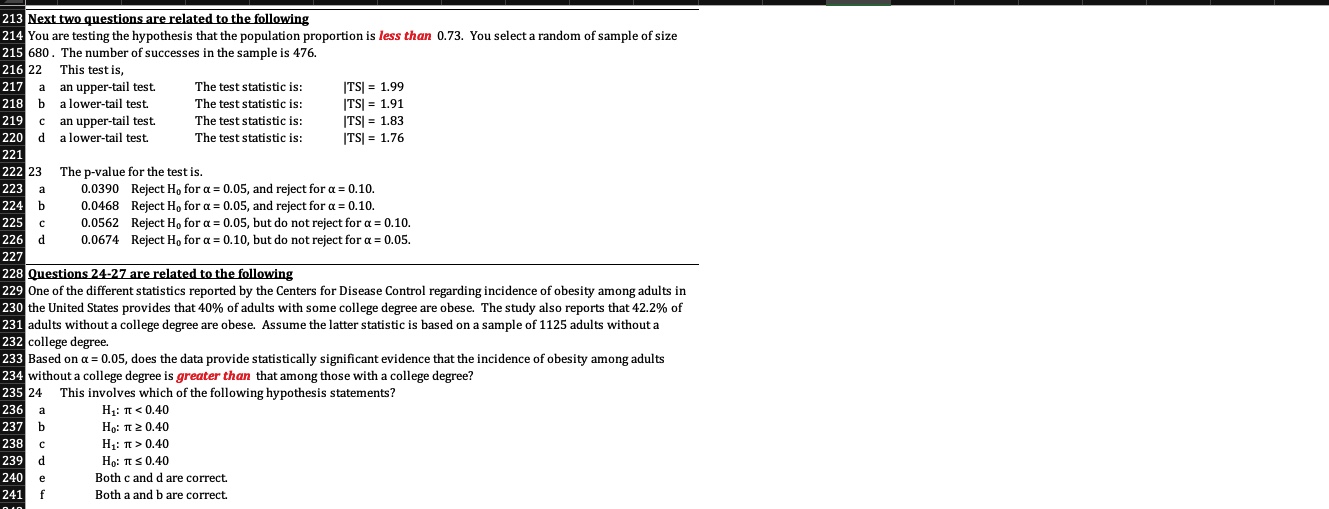
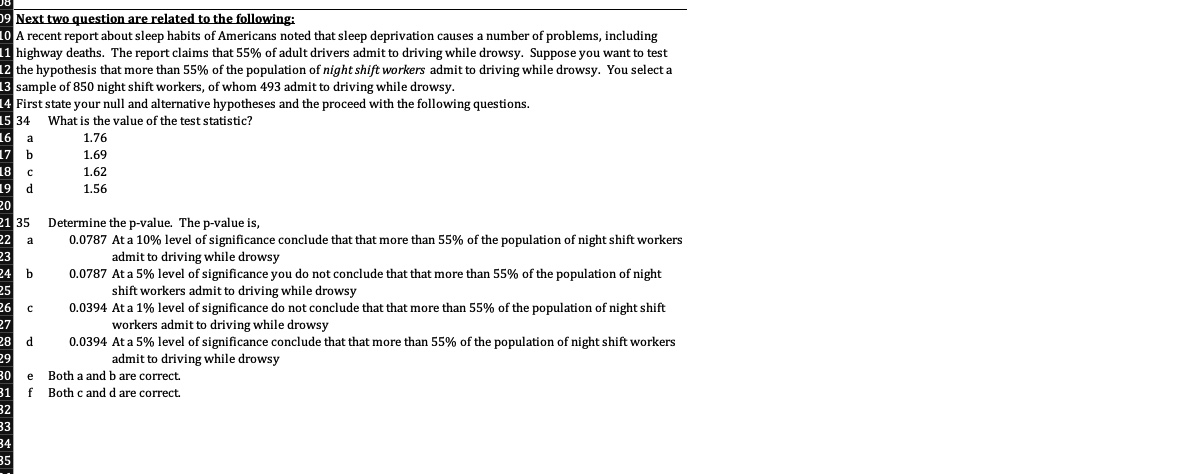
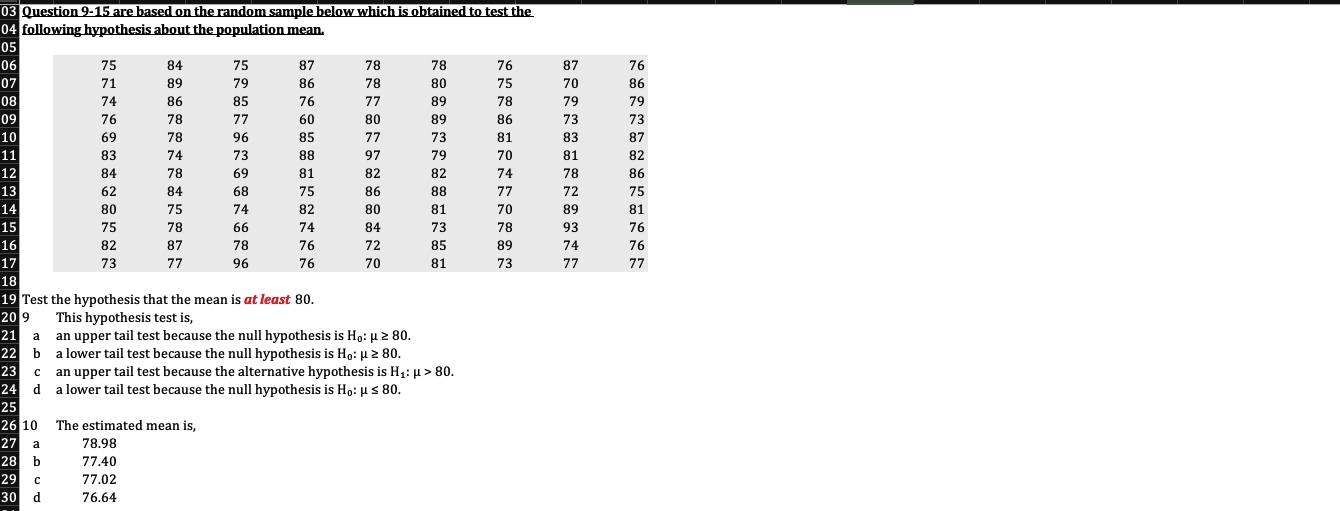
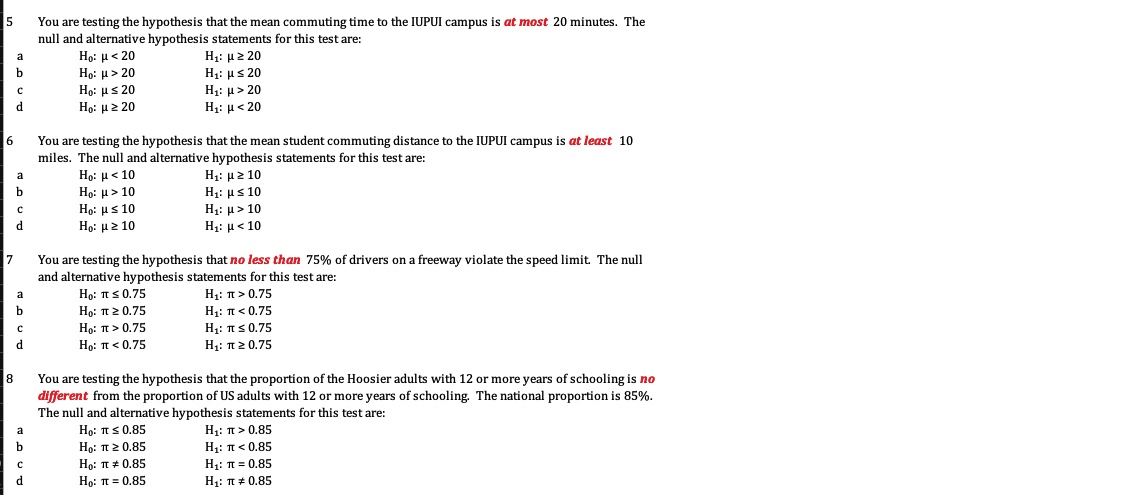
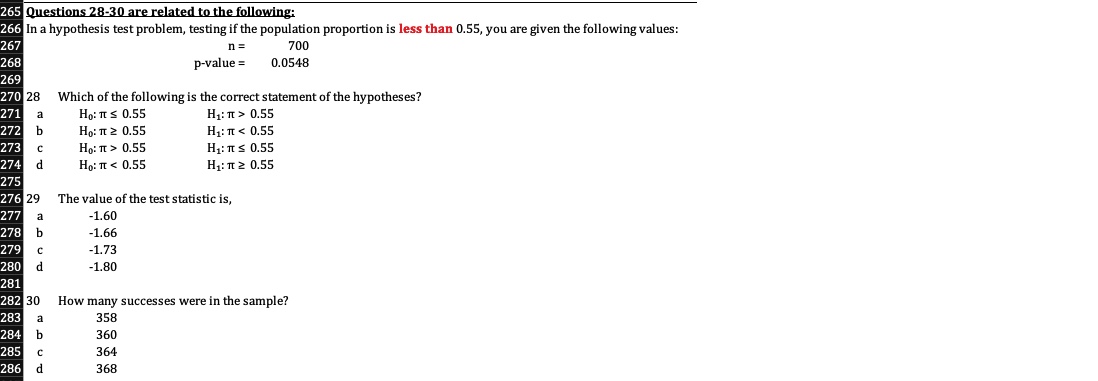
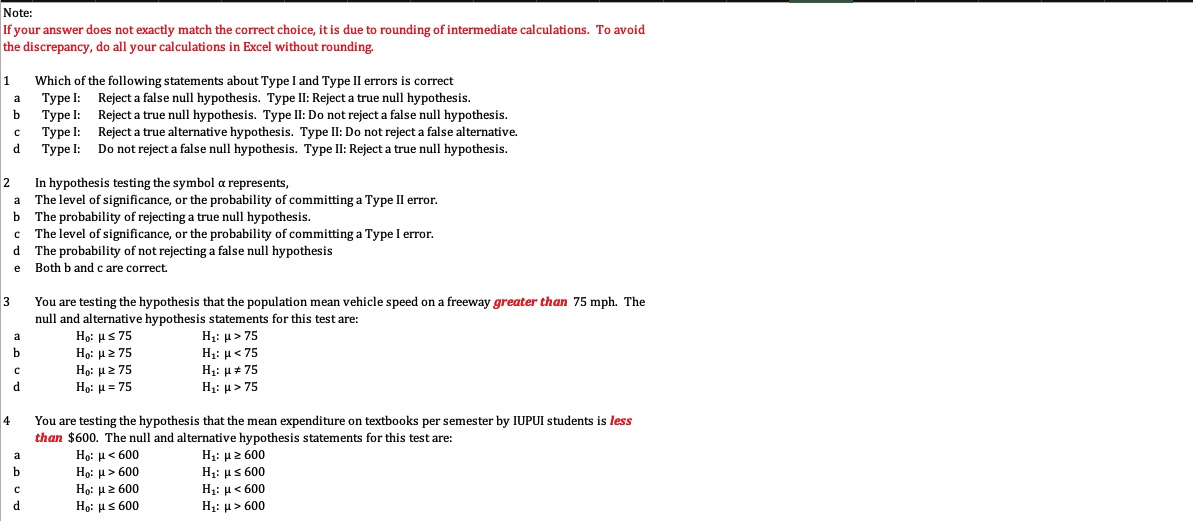
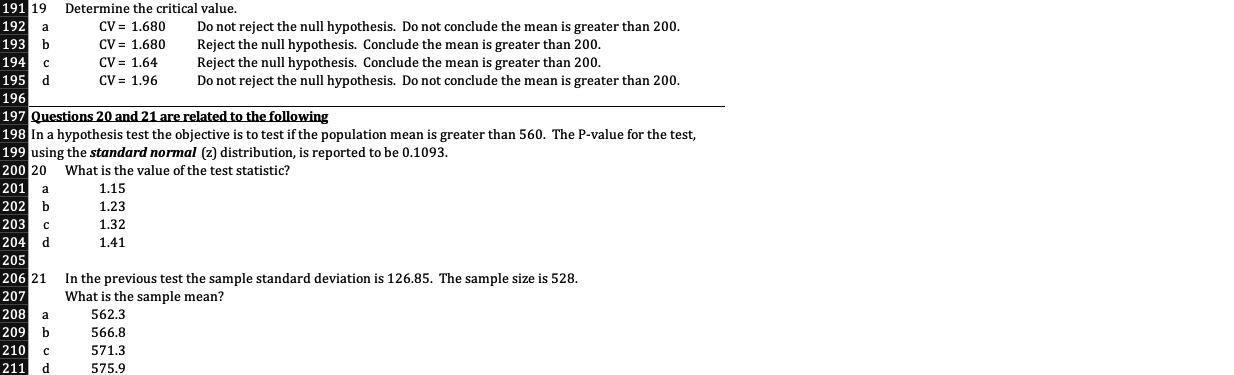
82 11 The estimated variance of the mean is, 33 a 45.551 34 48.284 35 0.398 36 0.422 87 38 12 The value of the test statistic is ( if negative use the absolute value): 39 1.568 40 b 1.662 41 1.762 12 1.868 13 14 13 Given a = 0.05, the critical value for the test is, 45 a 1.393 46 1.477 17 1.565 18 1.659 49 50 14 The approximate p-value for the test is, 51 0.039 52 0.045 53 0.052 54 0.060 56 15 Based on the p-value in the previous question, 57 a reject Ho at a = 0.05; reject Ho at a = 0.01 58 Reject Ho at a = 0.01; do not reject Ho at a = 0.05 59 c Reject Ho at a = 0.10; do not reject Ho at a = 0.05 60 d Reject Ho at a = 0.05; do not reject Ho at a = 0.01242 243 25 The test statistic for the hypothesis test is, 244 a 1.31 245 1.51 246 1.73 247 1.99 248 249 26 The p-value for the test is, 250 0.0232 The incidence of obesity among adults without a college degree is greater 251 0.0416 The incidence of obesity among adults without a college degree is greater 252 0.0660 The incidence of obesity among adults without a college degree is not greater. 253 0.0951 The incidence of obesity among adults without a college degree is not greater. 254 155 27 Regardless of how you answered the previous question, which of the following statements is correct? 256 a If the proportion of men without a college degree is greater than 0.40 and the hypothesis test leads you to conclude 257 that it is at most 0.40, then you have committed a Type I error. 258 b If the proportion of men without a college degree is less than 0.40 and the hypothesis test leads you to conclude 259 that it is at least 0.40, then you have committed a Type I error. 260 C If the proportion of men without a college degree is at most 0.40 and the hypothesis test leads you to conclude that 261 it is greater than 0.40, then you have committed a Type II error. 262 d If the proportion of men without a college degree is greater than 0.40 and the hypothesis test leads you to conclude 263 that it is at most 0.40, then you have committed a Type II error.288 Next 3 questions are related to the following: 289 A random sample of 1050 vehicles on a freeway are clocked to test the hypothesis that the proportion of vehicles driving 290 above 80 miles per hour is 25%. The number of vehicles in the sample driving above 80 mph is 231. 291 31 What is the sample proportion? 292 0.18 293 0.19 294 0.20 295 0.22 296 297 32 The test statistic is: 298 a ITS) = 2.16 299 ITS| = 2.24 300 ITS| = 2.33 301 ITS| = 2.43 302 303 33 The p-value is, 304 0.9936 Reject Ho at a = 0.05. 305 0.8790 Reject Ho at a = 0.01. 306 1.9871 Do not reject Ho at a = 0.01. 0.0248 Do not reject Ho at a = 0.01. BUZ62 Question 16-19 are related to the following 3 To test the hypothesis that the average daily visit to a state park during the season is greater than 200, a random sample days yielded the following data (number of vehicles). 215 210 184 213 214 215 248 182 220 204 171 214 182 237 212 209 223 205 166 210 224 238 157 216 196 209 201 69 240 189 187 191 197 192 197 199 229 202 195 199 231 210 194 168 173 220 2 Test the hypothesis at a 5% level of significance. 73 The sample mean is, a 204.2 75 206.4 208.3 210.5 78 79 17 The variance of the mean is, 30 9.029 9.390 82 9.766 10.156 35 18 The test statistic for the hypothesis test is, 86 a 1.190 1.274 38 1.363 39 1.458213 Next two questions are related to the following 214 You are testing the hypothesis that the population proportion is less than 0.73. You select a random of sample of size 215 680. The number of successes in the sample is 476. 216 22 This test is, 217 a an upper-tail test. The test statistic is: ITS| = 1.99 218 b a lower-tail test. The test statistic is: ITS| = 1.91 219 an upper-tail test. The test statistic is: ITS) = 1.83 220 a lower-tail test. The test statistic is: ITS| = 1.76 221 222 23 The p-value for the test is. 223 0.0390 Reject Ho for a = 0.05, and reject for a = 0.10. 224 0.0468 Reject Ho for a = 0.05, and reject for a = 0.10. 225 0.0562 Reject Ho for a = 0.05, but do not reject for a = 0.10. 226 0.0674 Reject Ho for a = 0.10, but do not reject for a = 0.05. 227 228 Questions 24-27 are related to the following 229 One of the different statistics reported by the Centers for Disease Control regarding incidence of obesity among adults in 230 the United States provides that 40% of adults with some college degree are obese. The study also reports that 42.2% of 231 adults without a college degree are obese. Assume the latter statistic is based on a sample of 1125 adults without a 232 college degree. 233 Based on a = 0.05, does the data provide statistically significant evidence that the incidence of obesity among adults 234 without a college degree is greater than that among those with a college degree? 235 24 This involves which of the following hypothesis statements? 236 H1: TT 0.40 239 Ho: TT $ 0.40 240 Both c and d are correct. 241 Both a and b are correct.19 Next two question are related to the following: 0 A recent report about sleep habits of Americans noted that sleep deprivation causes a number of problems, including 1 highway deaths. The report claims that 55% of adult drivers admit to driving while drowsy. Suppose you want to test the hypothesis that more than 55% of the population of night shift workers admit to driving while drowsy. You select a sample of 850 night shift workers, of whom 493 admit to driving while drowsy. First state your null and alternative hypotheses and the proceed with the following questions. 34 What is the value of the test statistic? 1.76 1.69 1.62 1.56 35 Determine the p-value. The p-value is, 0.0787 At a 10% level of significance conclude that that more than 55% of the population of night shift workers admit to driving while drowsy 0.0787 At a 5% level of significance you do not conclude that that more than 55% of the population of night shift workers admit to driving while drowsy 6 C 0.0394 At a 1% level of significance do not conclude that that more than 55% of the population of night shift workers admit to driving while drowsy d 0.0394 At a 5% level of significance conclude that that more than 55% of the population of night shift workers admit to driving while drowsy 0 e Both a and b are correct. f Both c and d are correct.03 Question 9-15 are based on the random sample below which is obtained to test the 04 following hypothesis about the population mean. 05 06 75 84 75 87 78 78 76 87 76 07 71 89 79 86 78 80 75 70 86 79 08 74 86 85 76 77 89 78 79 09 76 78 77 60 80 89 86 73 73 69 78 96 85 77 73 81 83 87 83 74 73 88 97 79 70 81 82 84 78 69 81 82 82 74 78 86 62 84 68 75 86 88 77 72 75 80 75 74 82 80 81 70 89 81 75 78 66 74 84 73 78 93 76 82 87 78 76 72 85 89 74 76 73 77 96 76 70 81 73 77 77 19 Test the hypothesis that the mean is at least 80. 20 9 This hypothesis test is, 21 a an upper tail test because the null hypothesis is Ho: p 2 80. 22 a lower tail test because the null hypothesis is Ho: p 2 80. 23 an upper tail test because the alternative hypothesis is H,: u > 80. 24 d a lower tail test because the null hypothesis is Ho: p s 80. 25 26 10 The estimated mean is, 27 78.98 28 77.40 Inup 29 77.02 30 76.645 You are testing the hypothesis that the mean commuting time to the IUPUI campus is at most 20 minutes. The null and alternative hypothesis statements for this test are: Ho: p 20 Hi: us 20 Ho: H S 20 H1: p > 20 Ho: H 2 20 Hi: p 10 Hi: us 10 Ho: HS 10 Hi: H > 10 Ho: H 2 10 Hi: p 0.75 Ho: It 2 0.75 H1: It 0.75 H1: IT S 0.75 Ho: It 0.85 Ho: It 2 0.85 H1: It 0.55 272 b Ho: 11 2 0.55 Hi:It 0.55 HI:Its 0.55 274 Ho: It 75 Ho: H 2 75 Hi: p 75 4 You are testing the hypothesis that the mean expenditure on textbooks per semester by IUPUI students is less than $600. The null and alternative hypothesis statements for this test are: Ho: u 600 Hi: us 600 Ho: H 2 600 H1: p 600191 19 Determine the critical value. 192 a CV = 1.680 Do not reject the null hypothesis. Do not conclude the mean is greater than 200. 193 CV = 1.680 Reject the null hypothesis. Conclude the mean is greater than 200. 194 CV = 1.64 Reject the null hypothesis. Conclude the mean is greater than 200. 195 CV = 1.96 Do not reject the null hypothesis. Do not conclude the mean is greater than 200. 196 197 Questions 20 and 21 are related to the following 198 In a hypothesis test the objective is to test if the population mean is greater than 560. The P-value for the test, 199 using the standard normal (z) distribution, is reported to be 0.1093. 200 20 What is the value of the test statistic? 201 a 1.15 202 1.23 203 1.32 204 1.41 205 206 21 In the previous test the sample standard deviation is 126.85. The sample size is 528. 207 What is the sample mean? 208 562.3 209 566.8 210 571.3 211 575.9
Step by Step Solution
There are 3 Steps involved in it

Get step-by-step solutions from verified subject matter experts