

Question: Hello I really need help figuring this out, is there other information that i am missing? I need to use excel to find the answers
Hello I really need help figuring this out, is there other information that i am missing? I need to use excel to find the answers and i need a scatter plot that needs to be made for them but i am not sure where I get the data from to use on excel. 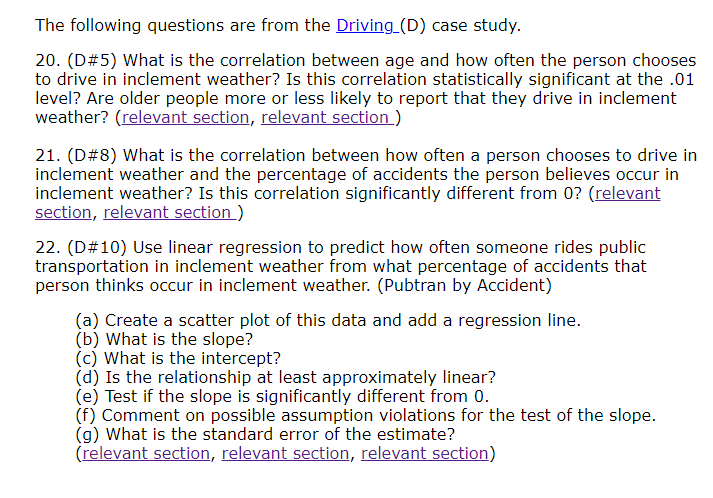
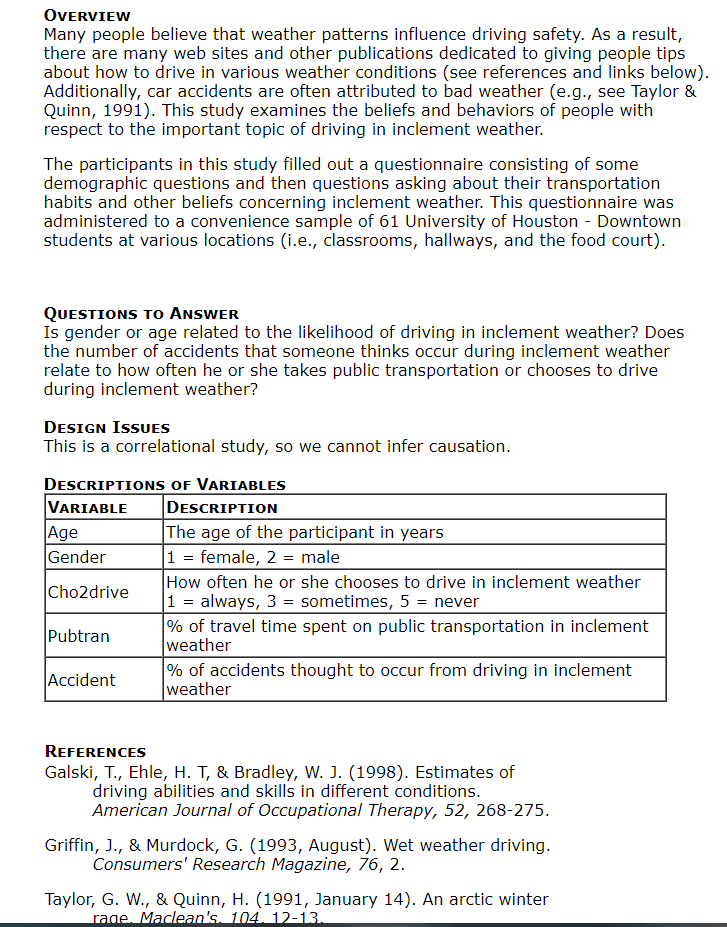
The following questions are from the Driving_(D) case study. 20. ( D#5) What is the correlation between age and how often the person chooses to drive in inclement weather? Is this correlation statistically significant at the .01 level? Are older people more or less likely to report that they drive in inclement weather? (relevant section, relevant section) 21. ( D#8) What is the correlation between how often a person chooses to drive in inclement weather and the percentage of accidents the person believes occur in inclement weather? Is this correlation significantly different from 0 ? (relevant section, relevant section) 22. ( D#10 ) Use linear regression to predict how often someone rides public transportation in inclement weather from what percentage of accidents that person thinks occur in inclement weather. (Pubtran by Accident) (a) Create a scatter plot of this data and add a regression line. (b) What is the slope? (c) What is the intercept? (d) Is the relationship at least approximately linear? (e) Test if the slope is significantly different from 0 . (f) Comment on possible assumption violations for the test of the slope. (g) What is the standard error of the estimate? (relevant section, relevant section, relevant section) Overview Many people believe that weather patterns influence driving safety. As a result, there are many web sites and other publications dedicated to giving people tips about how to drive in various weather conditions (see references and links below). Additionally, car accidents are often attributed to bad weather (e.g., see Taylor \& Quinn, 1991). This study examines the beliefs and behaviors of people with respect to the important topic of driving in inclement weather. The participants in this study filled out a questionnaire consisting of some demographic questions and then questions asking about their transportation habits and other beliefs concerning inclement weather. This questionnaire was administered to a convenience sample of 61 University of Houston - Downtown students at various locations (i.e., classrooms, hallways, and the food court). QUestions to Answer Is gender or age related to the likelihood of driving in inclement weather? Does the number of accidents that someone thinks occur during inclement weather relate to how often he or she takes public transportation or chooses to drive during inclement weather? Design Issues This is a correlational study, so we cannot infer causation. DESCRIPTIONS OF VARIABLES REFERENCES Galski, T., Ehle, H. T, \& Bradley, W. J. (1998). Estimates of driving abilities and skills in different conditions. American Journal of Occupational Therapy, 52, 268-275. Griffin, J., \& Murdock, G. (1993, August). Wet weather driving. Consumers' Research Magazine, 76, 2. Taylor, G. W., \& Quinn, H. (1991, January 14). An arctic winter rane Maclean's 104 12-13. The following questions are from the Driving_(D) case study. 20. ( D#5) What is the correlation between age and how often the person chooses to drive in inclement weather? Is this correlation statistically significant at the .01 level? Are older people more or less likely to report that they drive in inclement weather? (relevant section, relevant section) 21. ( D#8) What is the correlation between how often a person chooses to drive in inclement weather and the percentage of accidents the person believes occur in inclement weather? Is this correlation significantly different from 0 ? (relevant section, relevant section) 22. ( D#10 ) Use linear regression to predict how often someone rides public transportation in inclement weather from what percentage of accidents that person thinks occur in inclement weather. (Pubtran by Accident) (a) Create a scatter plot of this data and add a regression line. (b) What is the slope? (c) What is the intercept? (d) Is the relationship at least approximately linear? (e) Test if the slope is significantly different from 0 . (f) Comment on possible assumption violations for the test of the slope. (g) What is the standard error of the estimate? (relevant section, relevant section, relevant section) Overview Many people believe that weather patterns influence driving safety. As a result, there are many web sites and other publications dedicated to giving people tips about how to drive in various weather conditions (see references and links below). Additionally, car accidents are often attributed to bad weather (e.g., see Taylor \& Quinn, 1991). This study examines the beliefs and behaviors of people with respect to the important topic of driving in inclement weather. The participants in this study filled out a questionnaire consisting of some demographic questions and then questions asking about their transportation habits and other beliefs concerning inclement weather. This questionnaire was administered to a convenience sample of 61 University of Houston - Downtown students at various locations (i.e., classrooms, hallways, and the food court). QUestions to Answer Is gender or age related to the likelihood of driving in inclement weather? Does the number of accidents that someone thinks occur during inclement weather relate to how often he or she takes public transportation or chooses to drive during inclement weather? Design Issues This is a correlational study, so we cannot infer causation. DESCRIPTIONS OF VARIABLES REFERENCES Galski, T., Ehle, H. T, \& Bradley, W. J. (1998). Estimates of driving abilities and skills in different conditions. American Journal of Occupational Therapy, 52, 268-275. Griffin, J., \& Murdock, G. (1993, August). Wet weather driving. Consumers' Research Magazine, 76, 2. Taylor, G. W., \& Quinn, H. (1991, January 14). An arctic winter rane Maclean's 104 12-13
Step by Step Solution
There are 3 Steps involved in it

Get step-by-step solutions from verified subject matter experts