

Question: Hello I was wondering how I would interpret a KS (Kolmogorov Smirnov) in these types of charts. As well an explanation of the threshold (0.2402)
Hello
I was wondering how I would interpret a KS (Kolmogorov Smirnov) in these types of charts.
As well an explanation of the threshold (0.2402) and ways I can interpret that on the visual graph to the left. (the line with the ball at the top is the threshold indicator).
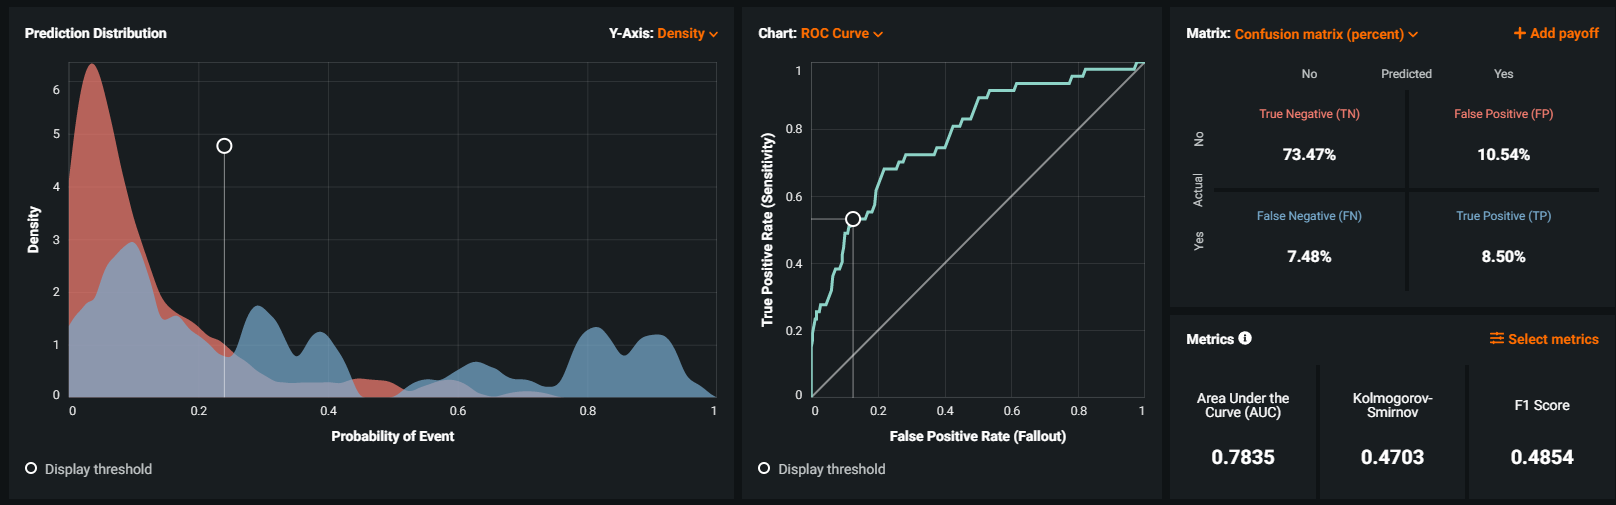
Prediction Distribution Y-Axis: Density v Chart: ROC Curve v Matrix: Confusion matrix (percent) v + Add payoff No Predicted Yes 6 True Negative (TN) False Positive (FP) 5 0.8 O 73.47% 10.54% 4 Actual 0.6 False Negative (FN) True Positive (TP) Density True Positive Rate (Sensitivity) 3 Yes 0.4 7.48% 8.50% 2 0.2 Metrics O Select metrics 7 Area Under the Kolmogorov- 0.2 0.4 0.6 0.8 0.2 0.4 0.6 0.8 Curve (AUC) Smirnov F1 Score Probability of Event False Positive Rate (Fallout) 0.7835 0.4703 0.4854 O Display threshold O Display threshold
Step by Step Solution
There are 3 Steps involved in it

Get step-by-step solutions from verified subject matter experts