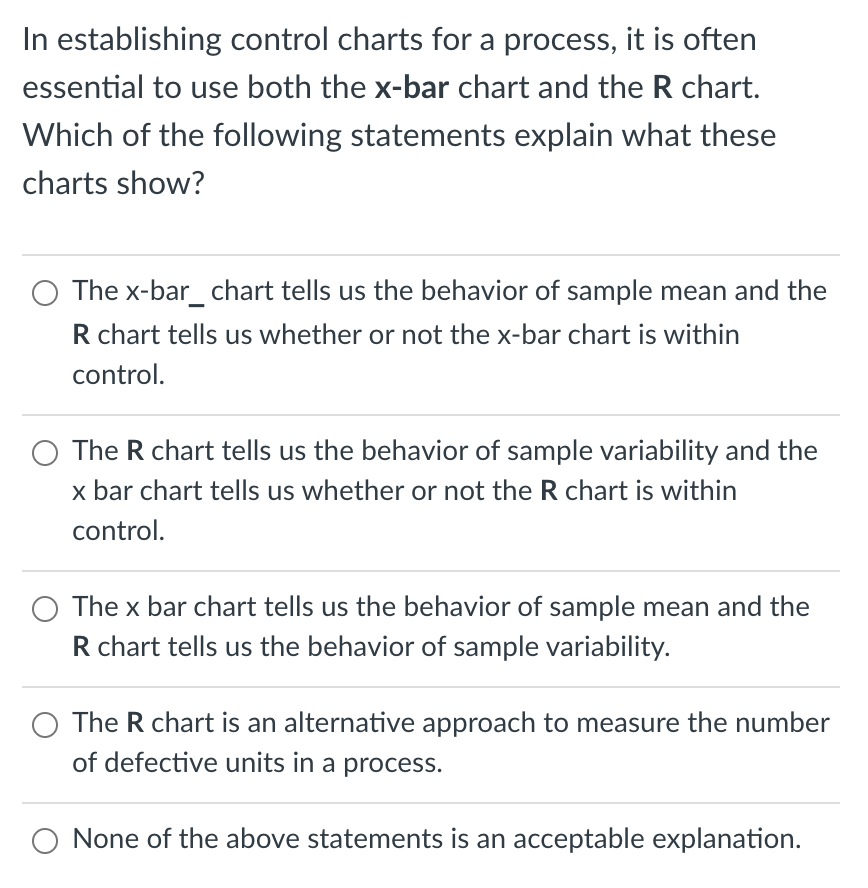
Question: Hello, I would appreciate any help on this question. In establishing control charts for a process, it is often essential to use both the x-bar

Hello, I would appreciate any help on this question.

Hello, I would appreciate any help on this
In establishing control charts for a process, it is often essential to use both the x-bar chart and the R chart. Which of the following statements explain what these charts show? 0 The x-bar_ chart tells us the behavior of sample mean and the R chart tells us whether or not the x-bar chart is within control. 0 The R chart tells us the behavior of sample variability and the x bar chart tells us whether or not the R chart is within control. 0 The x bar chart tells us the behavior of sample mean and the R chart tells us the behavior of sample variability. O The R chart is an alternative approach to measure the number of defective units in a process. 0 None of the above statements is an acceptable explanation

Step by Step Solution

There are 3 Steps involved in it

1 Expert Approved Answer
Step: 1 Unlock blur-text-image
Question Has Been Solved by an Expert!

Get step-by-step solutions from verified subject matter experts

Step: 2 Unlock
Step: 3 Unlock

Students Have Also Explored These Related General Management Questions!