

Question: Hello, I'd like question 2b and 2g answered using the formula in the image. Thank you 258 CHAPTER 6 Name a follow-up test that could
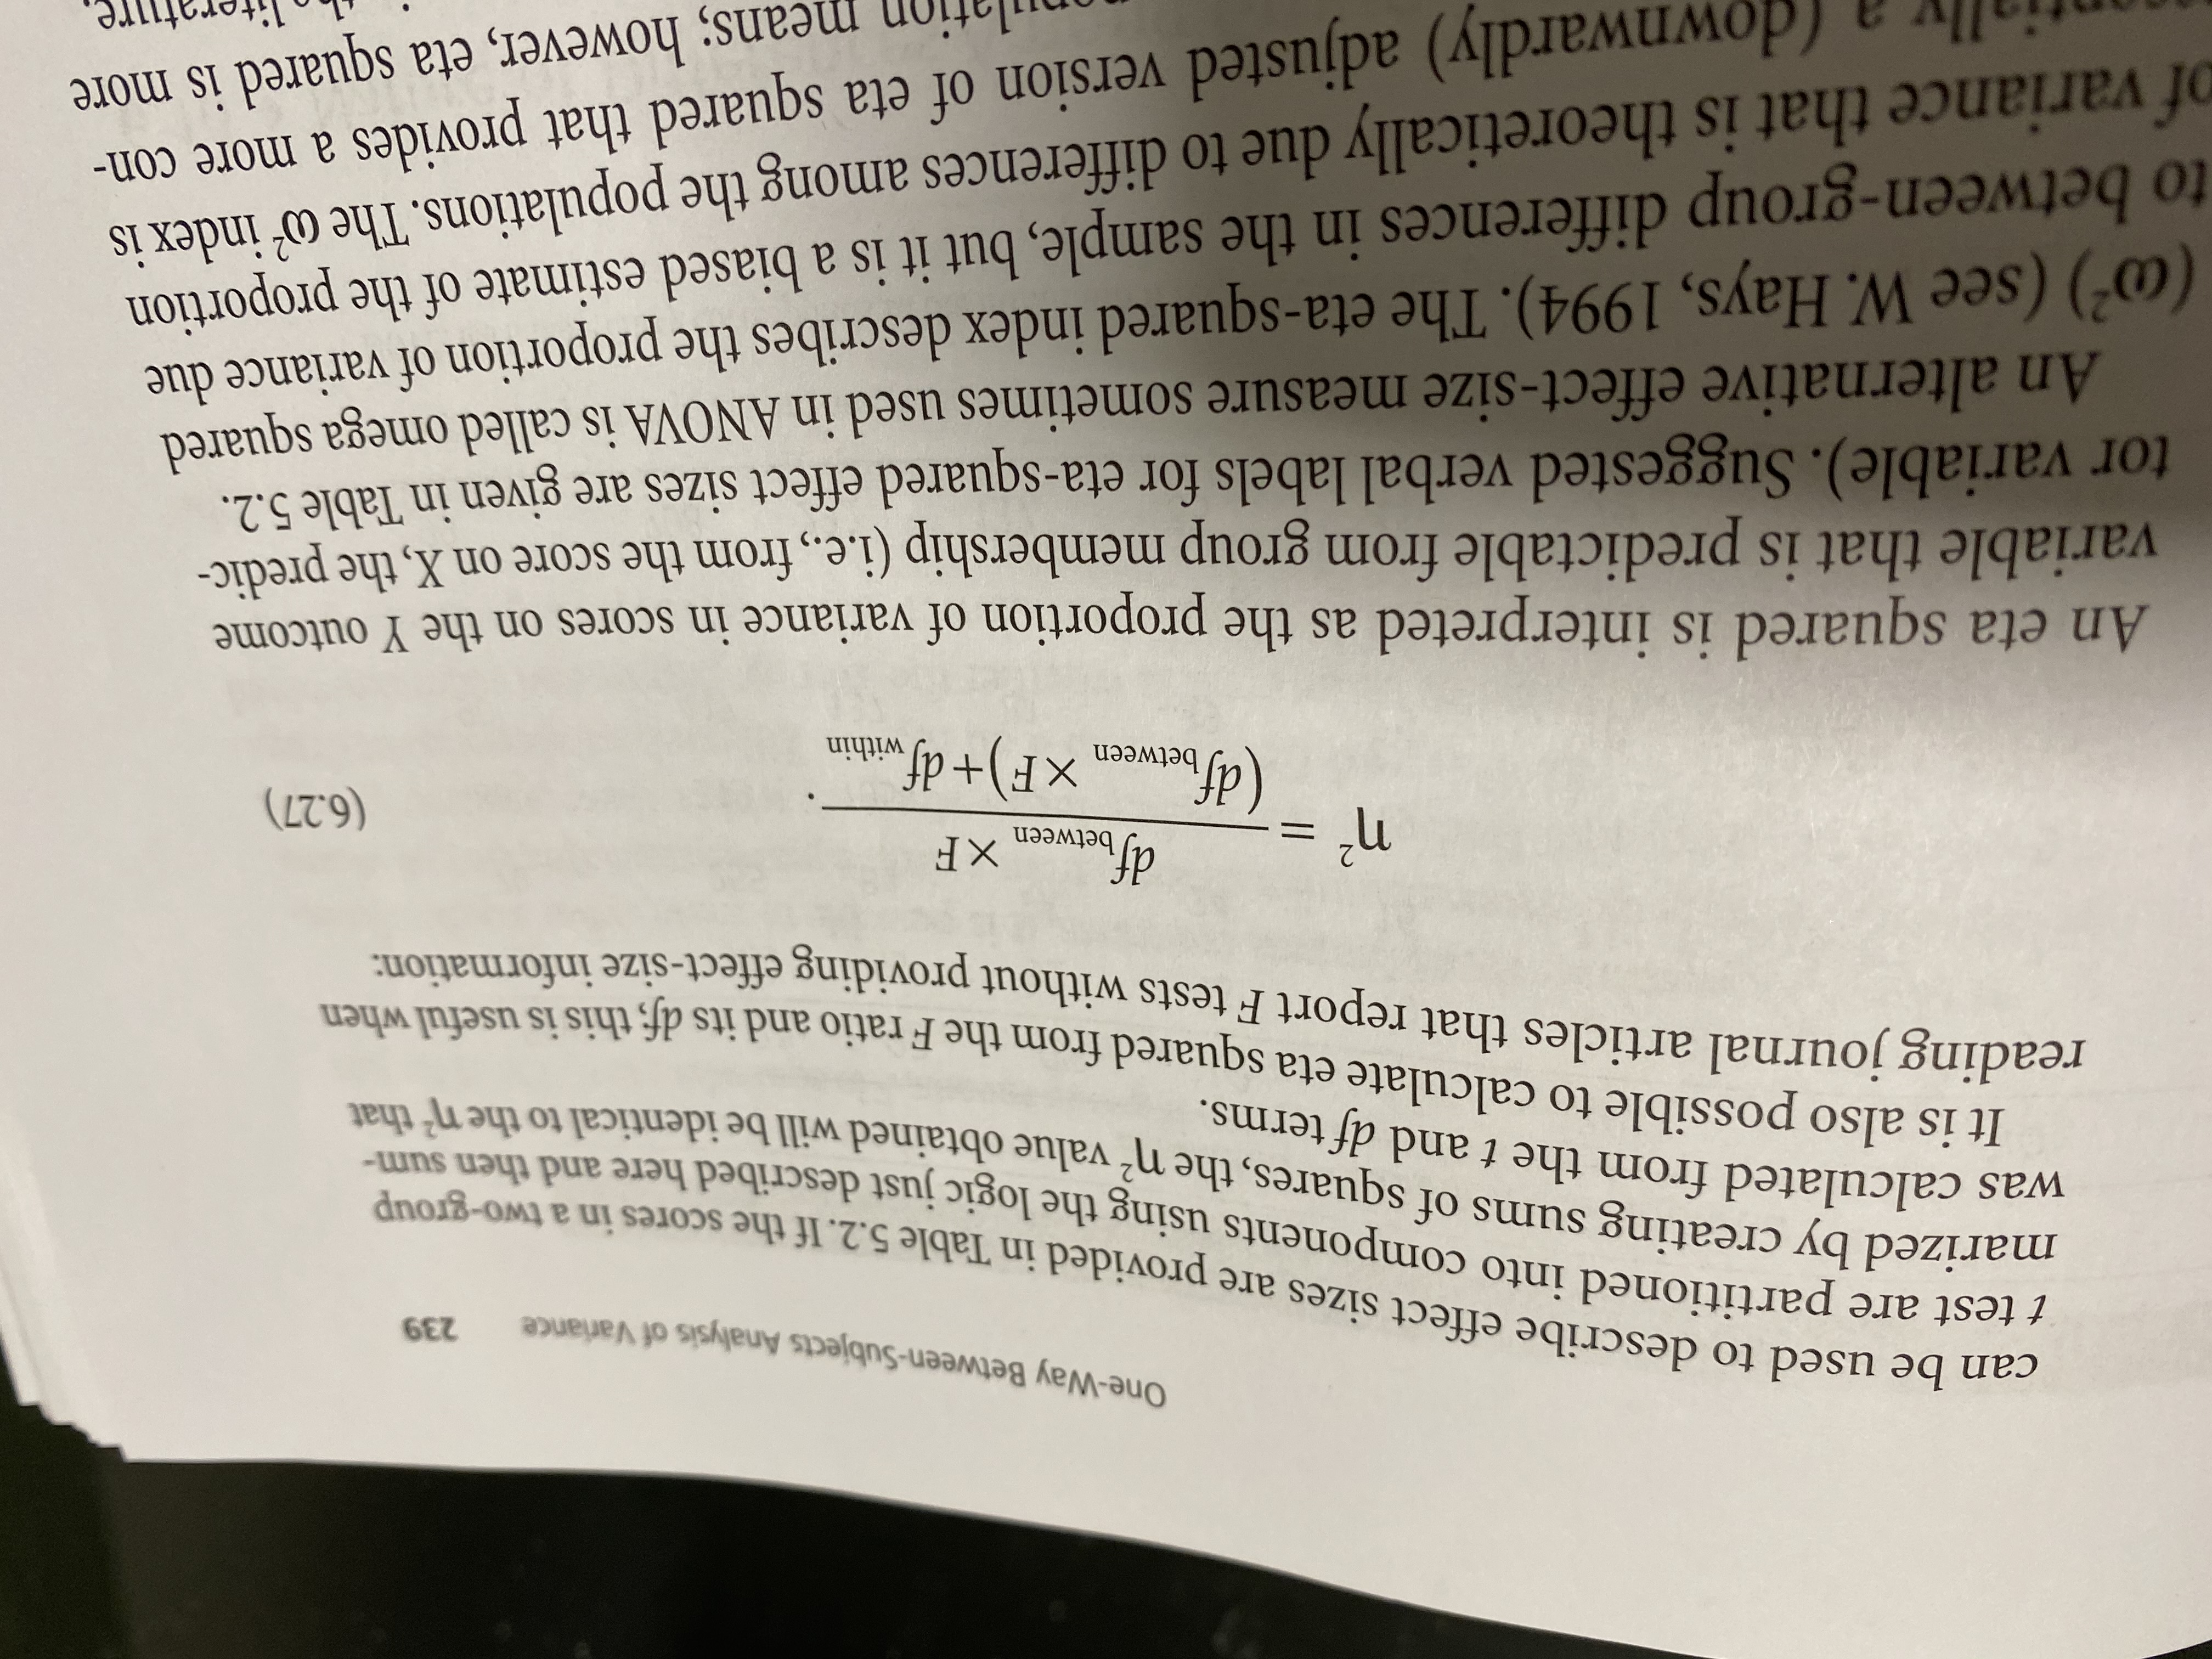
Hello, I'd like question 2b and 2g answered using the formula in the image. Thank you
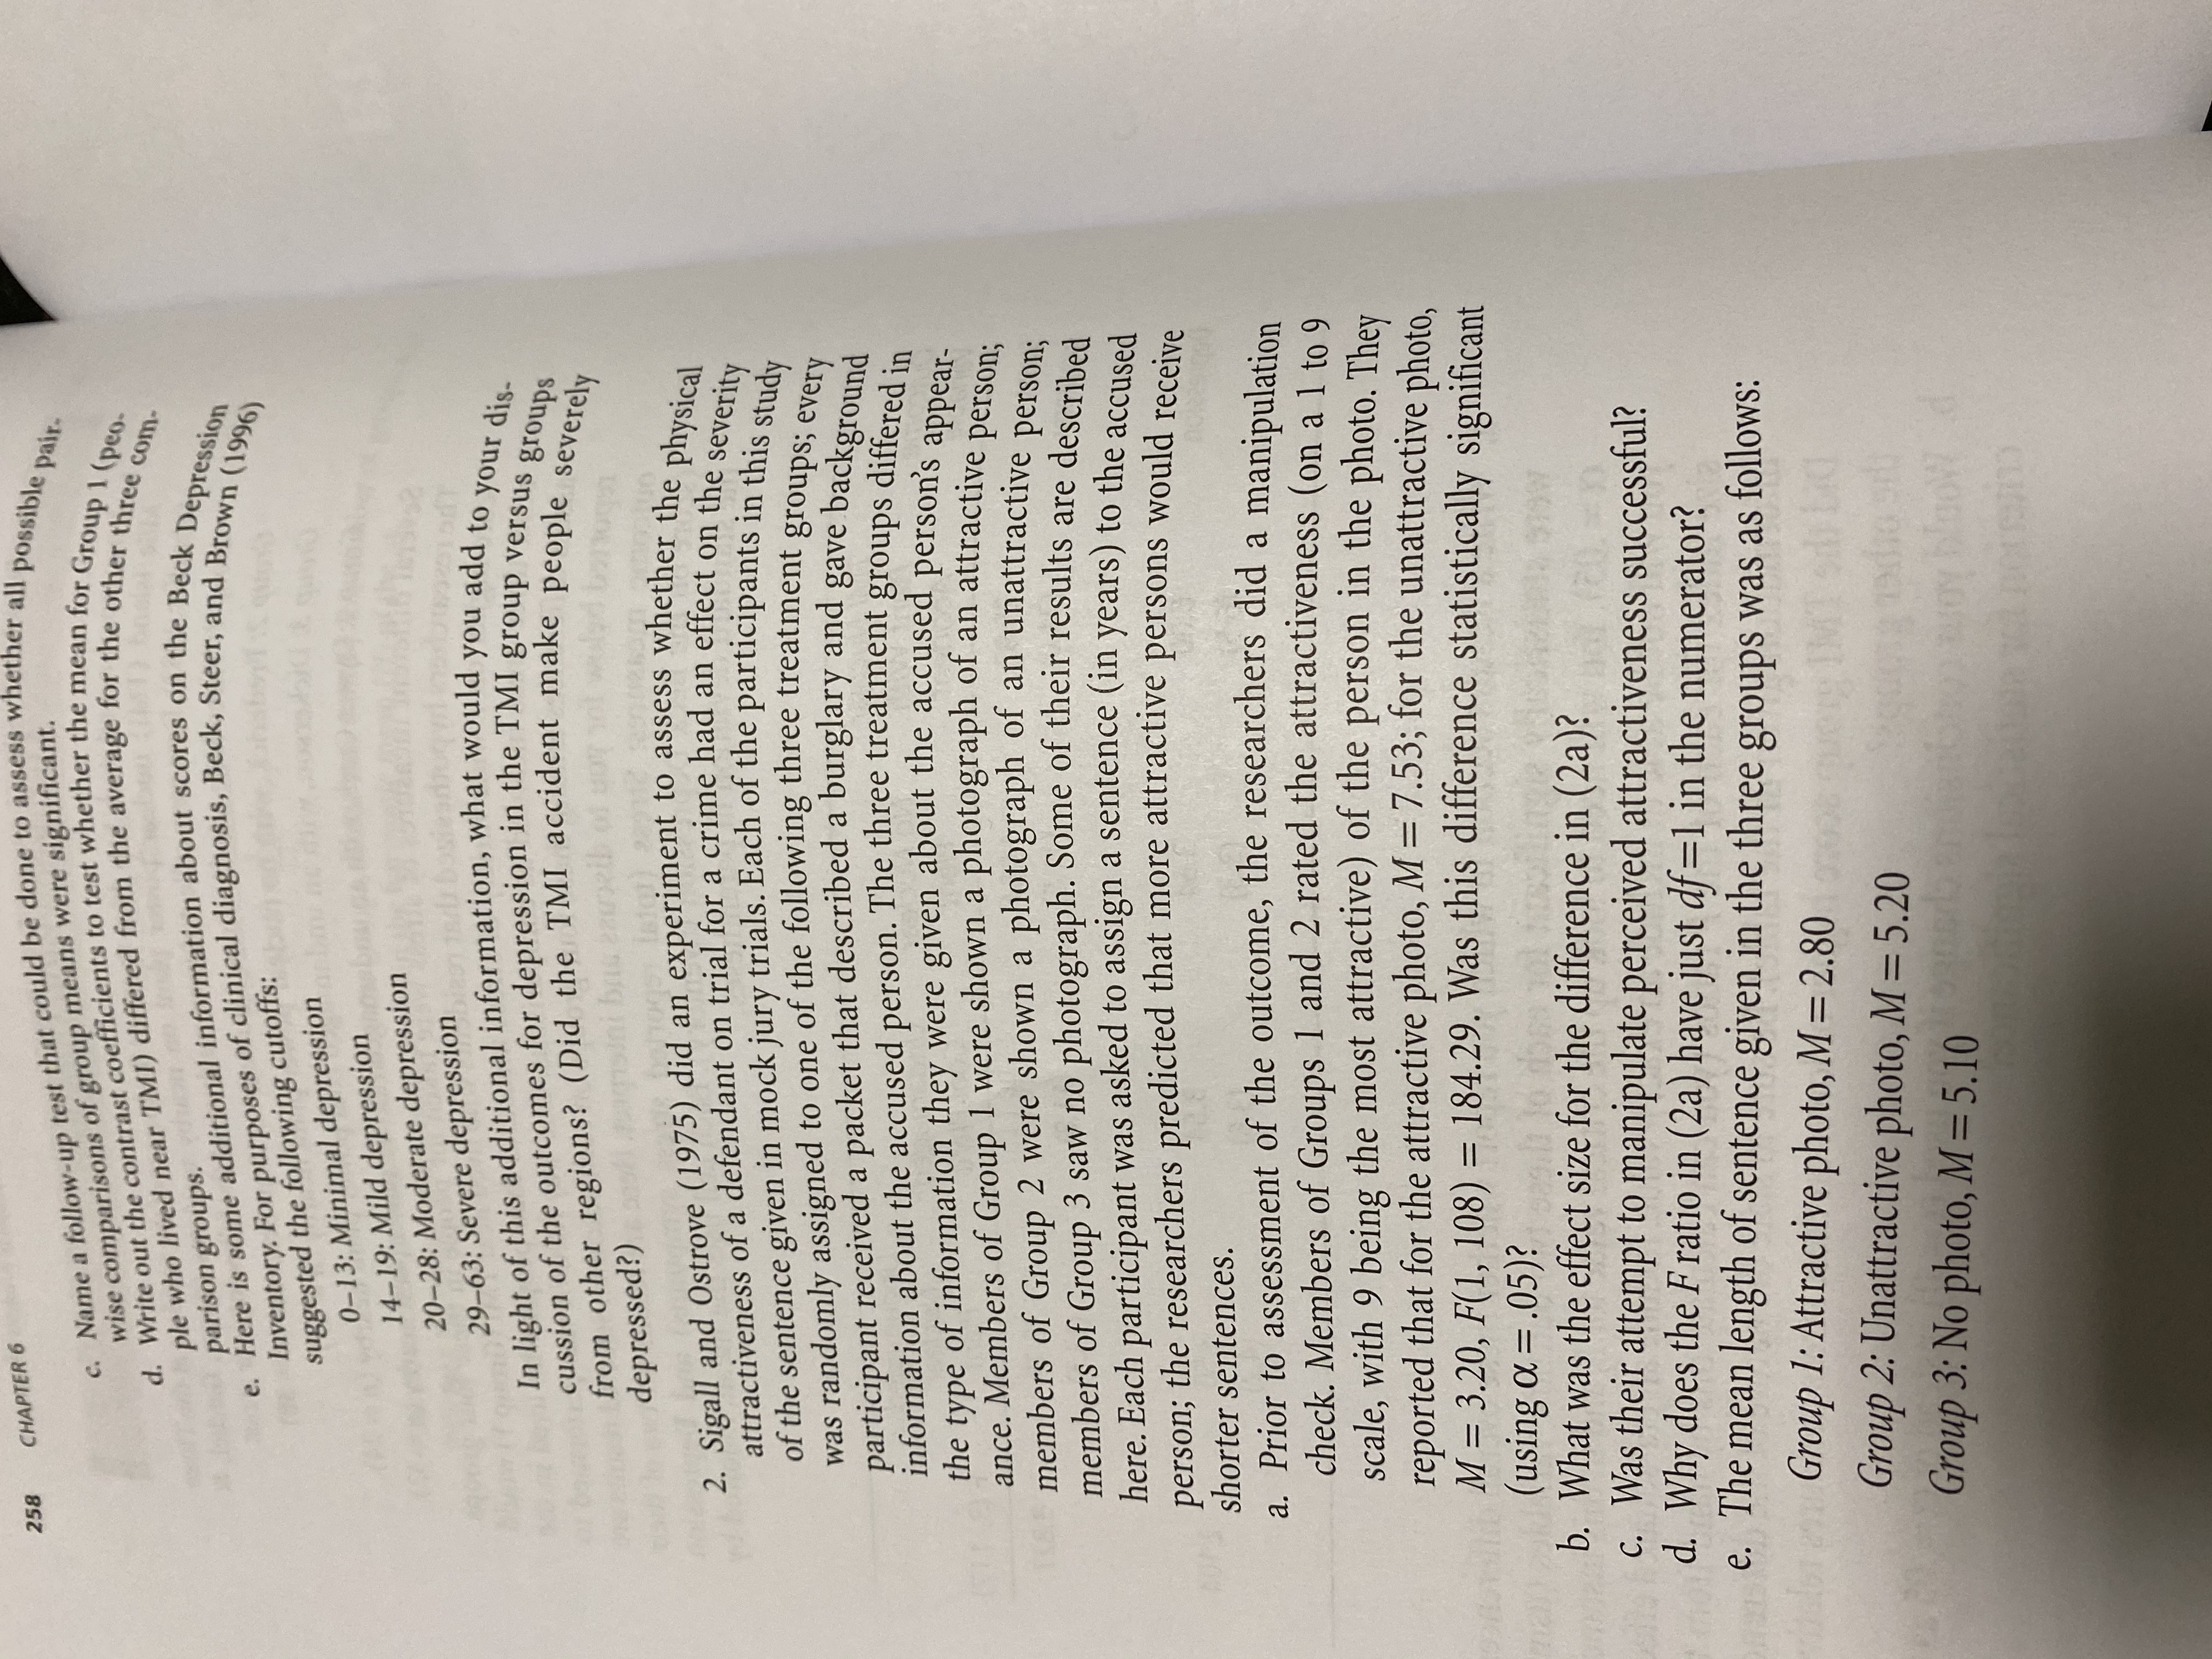
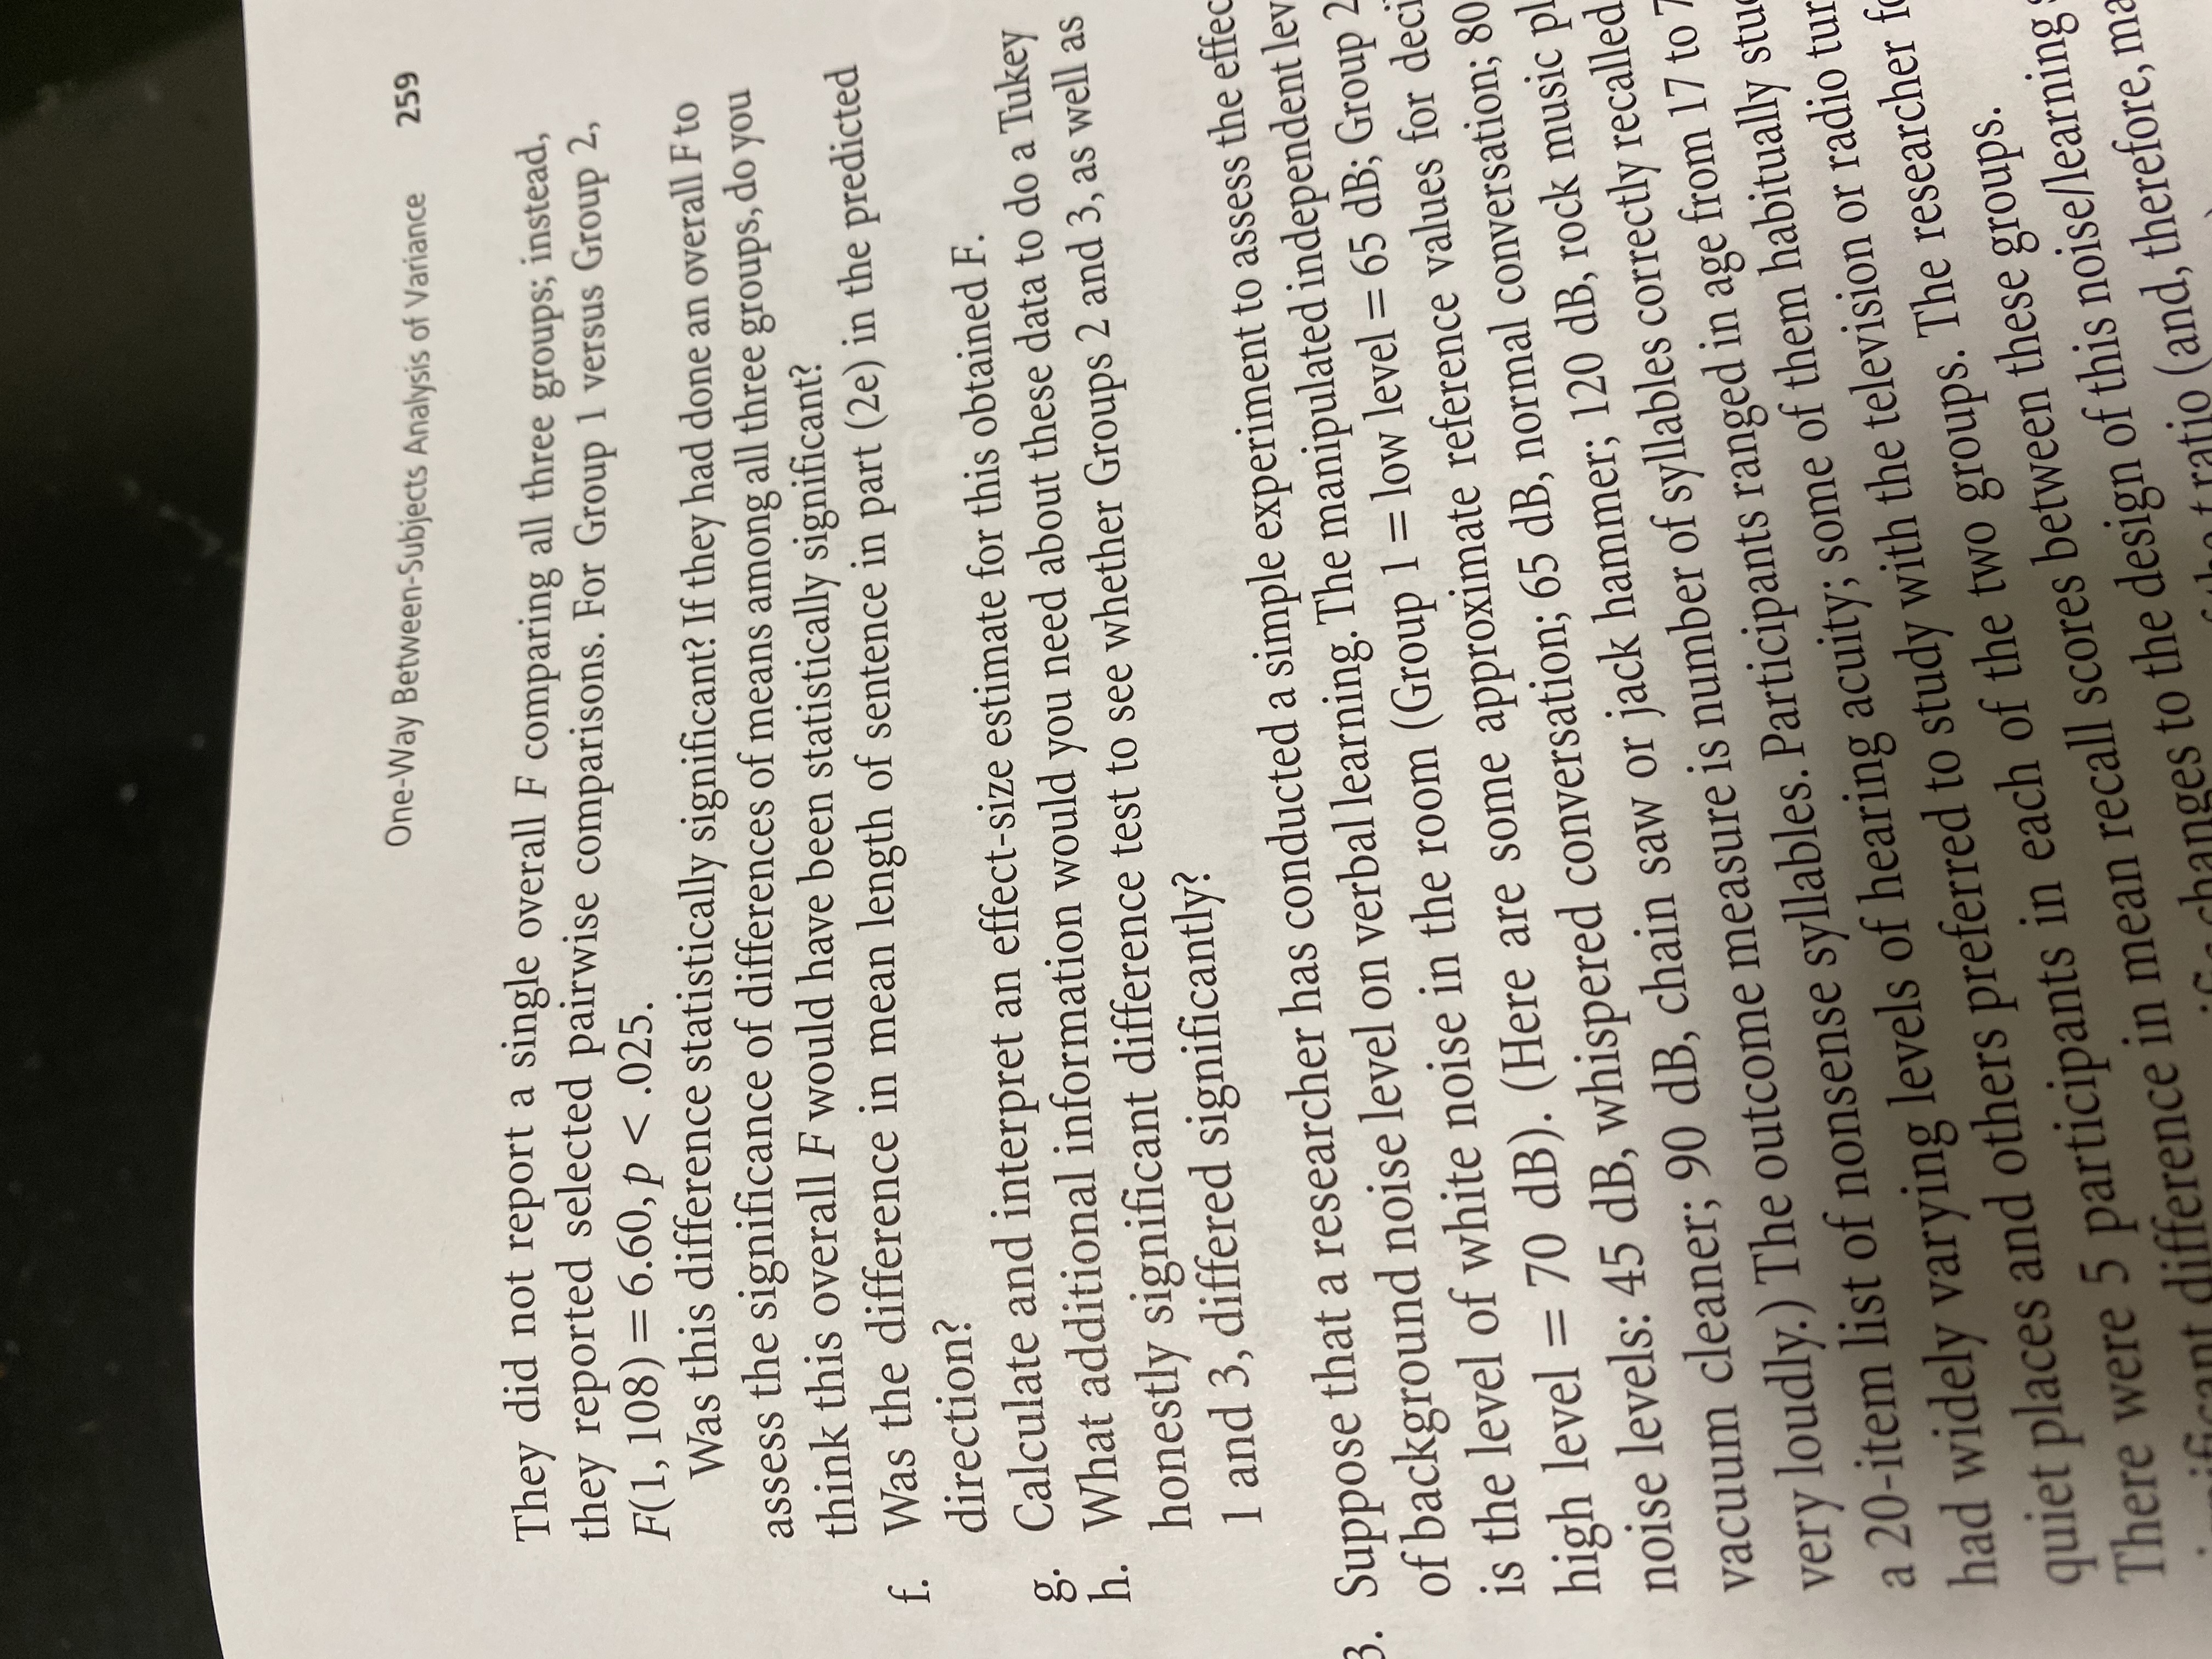
258 CHAPTER 6 "Name a follow-up test that could be done to assess whether all possible pair. wise comparisons of group means were significant. Write out the contrast coefficients to test whether the mean for Group 1 (peo. ple who lived near TMI) differed from the average for the other three com parison groups. ". Here is some additional information about scores on the Beck Depression inventory. For purposes of clinical diagnosis, Beck, Steer, and Brown (1996) suggested the following cutoffs: 0-13: Minimal depression 14-19: Mild depression 20-28: Moderate depression 29-63: Severe depression In light of this additional information, what would you add to your dis- cussion of the outcomes for depression in the TMI group versus groups depressed?) from other regions? (Did the TMI accident make people severely 2. Sigall and Ostrove (1975) did an experiment to assess whether the physical attractiveness of a defendant on trial for a crime had an effect on the severity of the sentence given in mock jury trials. Each of the participants in this study was randomly assigned to one of the following three treatment groups; every participant received a packet that described a burglary and gave background information about the accused person. The three treatment groups differed in the type of information they were given about the accused person's appear- ance. Members of Group I were shown a photograph of an attractive person; members of Group 2 were shown a photograph of an unattractive person; members of Group 3 saw no photograph. Some of their results are described here. Each participant was asked to assign a sentence (in years) to the accused person; the researchers predicted that more attractive persons would receive shorter sentences. a. Prior to assessment of the outcome, the researchers did a manipulation check. Members of Groups 1 and 2 rated the attractiveness (on a 1 to 9 scale, with 9 being the most attractive) of the person in the photo. They reported that for the attractive photo, M = 7.53; for the unattractive photo, M = 3.20, F(1, 108) = 184.29. Was this difference statistically significant (using a = .05)? b. What was the effect size for the difference in (2a)? 1 97997 c. Was their attempt to manipulate perceived attractiveness successful? d. Why does the F ratio in (2a) have just df=1 in the numerator? e. The mean length of sentence given in the three groups was as follows: Group 1: Attractive photo, M = 2.80 Group 2: Unattractive photo, M = 5.20 Group 3: No photo, M = 5.10 beon any blow dOne-Way Between-Subjects Analysis of Variance 259 They did not report a single overall F comparing all three groups; instead, they reported selected pairwise comparisons. For Group 1 versus Group 2, F(1, 108) = 6.60, p
Step by Step Solution
There are 3 Steps involved in it

Get step-by-step solutions from verified subject matter experts