

Question: Hello! If you could please help solve this problem and show step-by-step process as well as all formulas used that would be much appreciated. Thank
Hello! If you could please help solve this problem and show step-by-step process as well as all formulas used that would be much appreciated. Thank you!
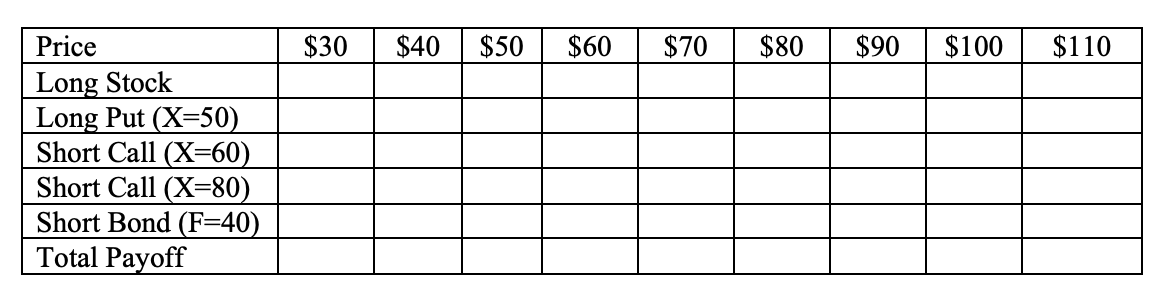
3. Fill in the following payoff table (as a function of the stock price in 1 year) of a portfolio that is
(i) long one share of stock,
(ii) long one 1-year put with an exercise price of $50,
(iii) short one 1-year call with an exercise price of $60, (iv) short one 1-year call with an exercise price of $80, and
(v) short a 1-year zero-coupon bond with a face amount of $40.
Graph the payoff as a function of the stock price in 1 year. (Note: Payoff not profit, ignore the cost of these securities.)
Step by Step Solution
There are 3 Steps involved in it

Get step-by-step solutions from verified subject matter experts