

Question: Hello! I'm having some issue solving this homework problem and was hoping someone could help me solve this problem. Please provide step-by-step instructions for each
Hello! I'm having some issue solving this homework problem and was hoping someone could help me solve this problem. Please provide step-by-step instructions for each part.
Note: Please do not attempt problem if you do not know how to solve/are unsure if your answer is correct/or if you cannot provide step-by-step instructions, or I will have to give your answer a thumbs down. I don't mean to be rude, I've just had some issues with incorrect answers/incomplete solutions previously, and I would really like to figure out how to solve these types of problems.
Thank you so much in advance if you are able to help me with this problem, I truly appreciate it!
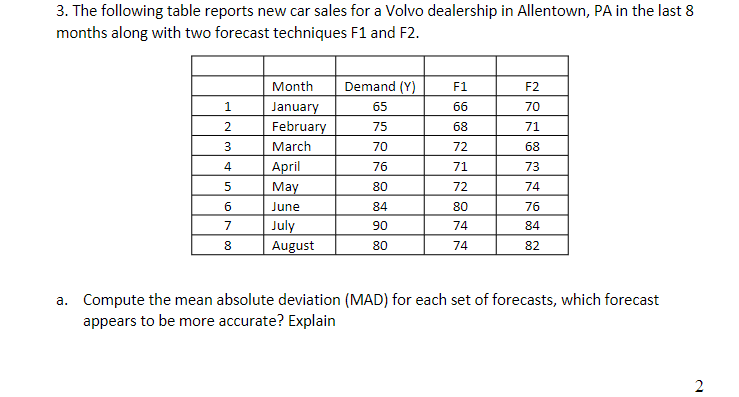
3. The following table reports new car sales for a Volvo dealership in Allentown, PA in the last 8 months along with two forecast techniques F1 and F2. a. Compute the mean absolute deviation (MAD) for each set of forecasts, which forecast appears to be more accurate? Explain b. Compute the mean absolute percentage error (MAPE) for each set of forecasts, which forecast appears to be more accurate? Explain c. In practice, either MAD or MAPE would be employed to compare forecast accuracies. What factors might lead the manager to choose one rather than the other
Step by Step Solution
There are 3 Steps involved in it

Get step-by-step solutions from verified subject matter experts