Question: Hello math Tutor, Please help me how to answer all of them? I want it in handwriting. Thank you 1. The graph of f (x)
Hello math Tutor,
Please help me how to answer all of them? I want it in handwriting. Thank you
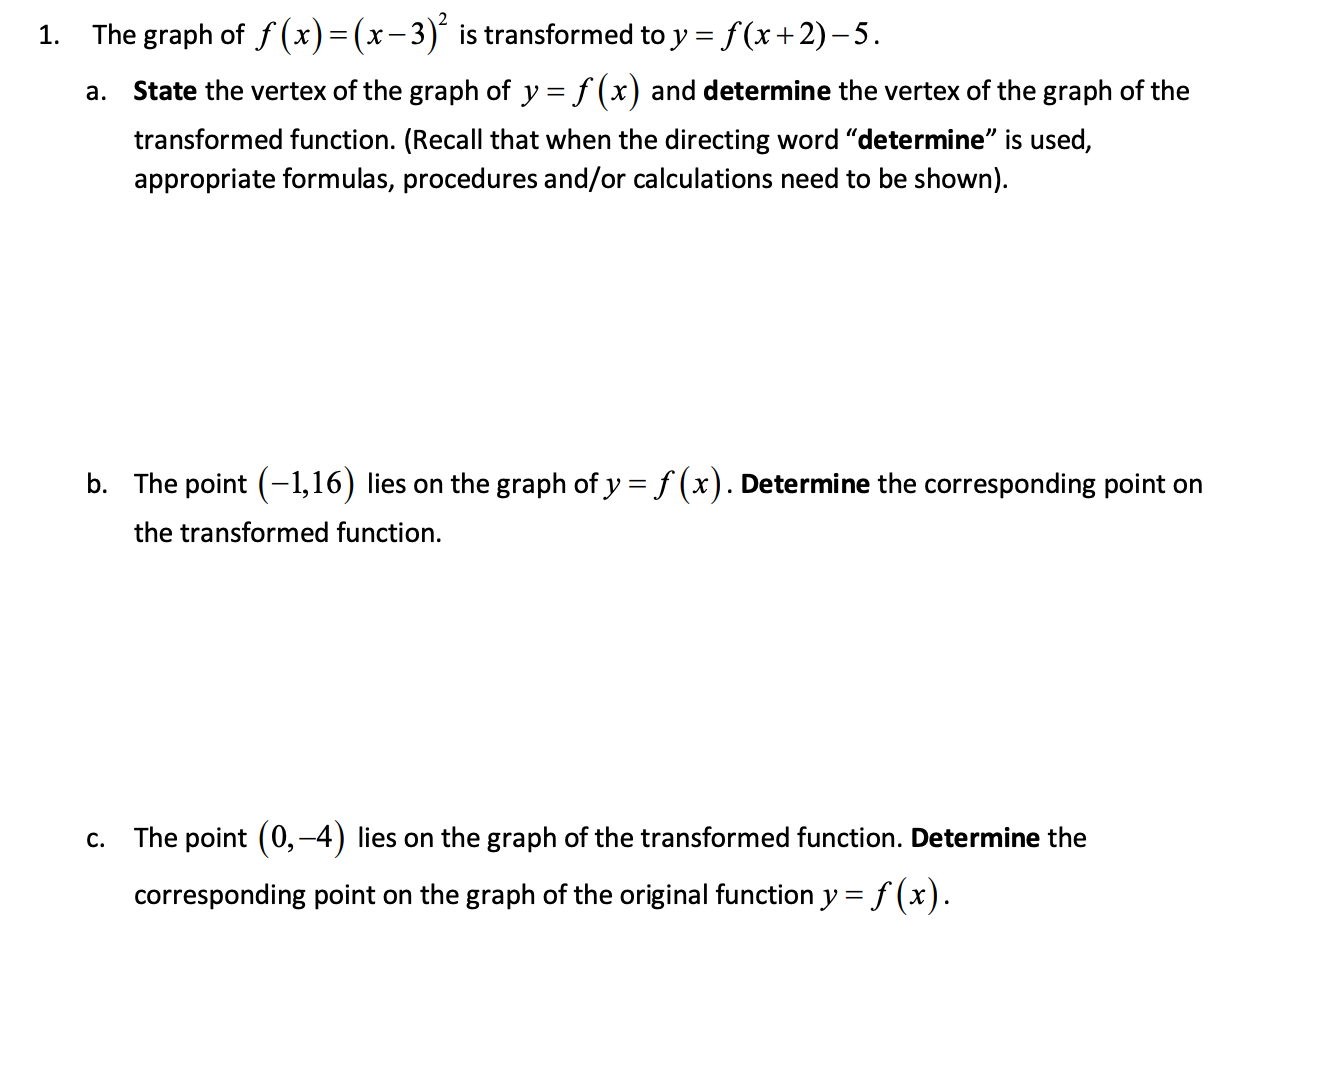
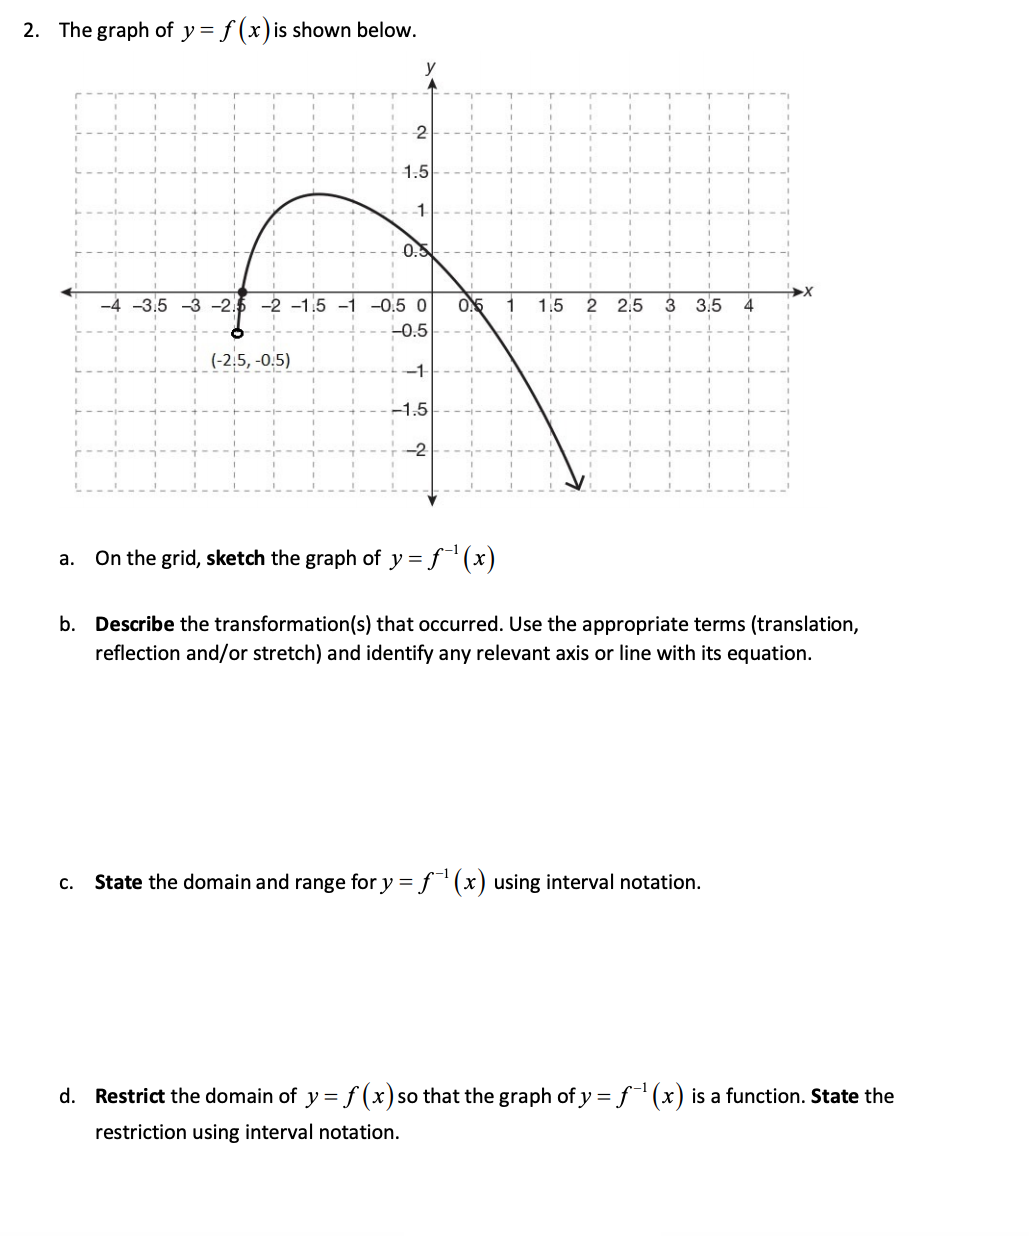
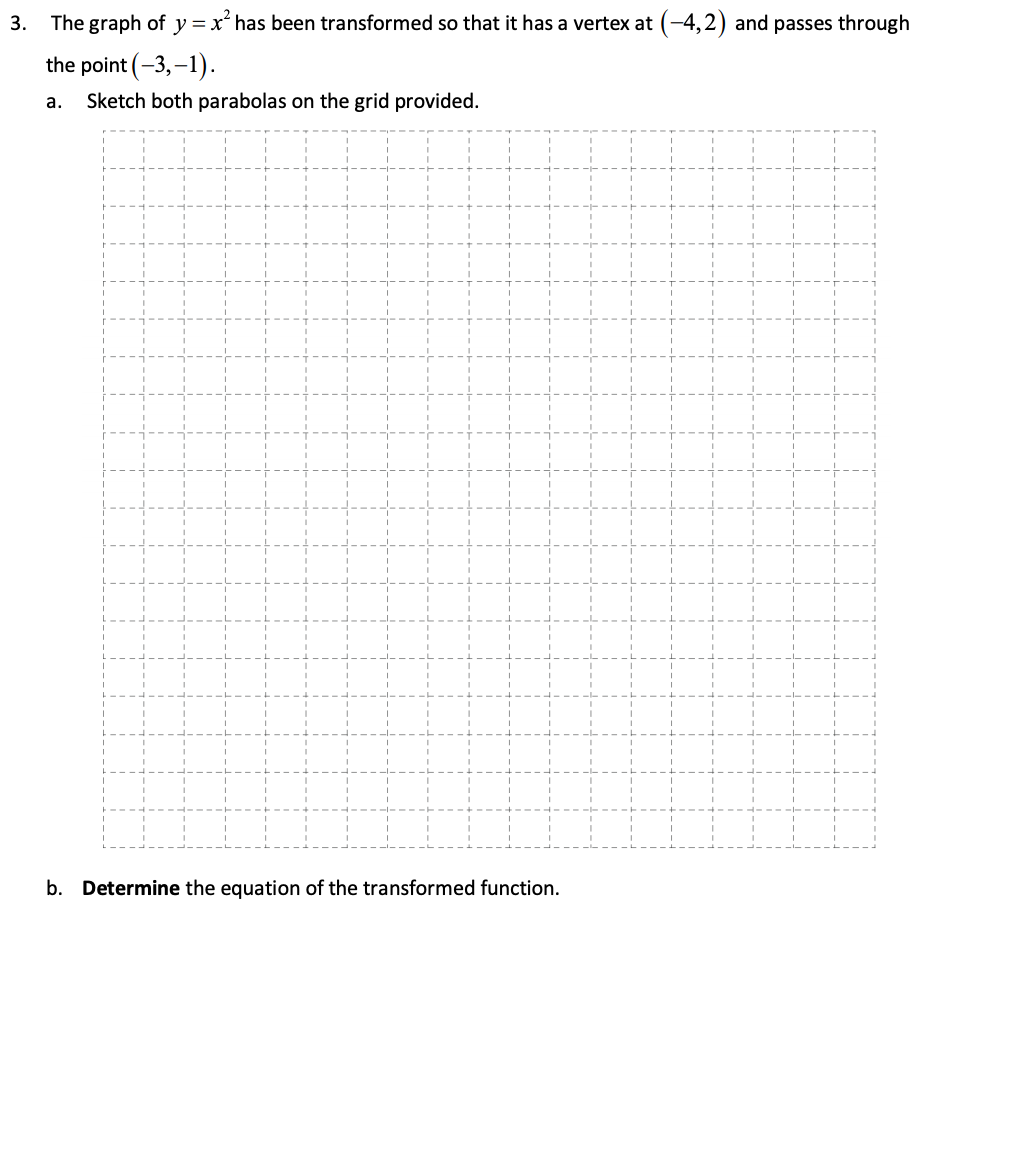
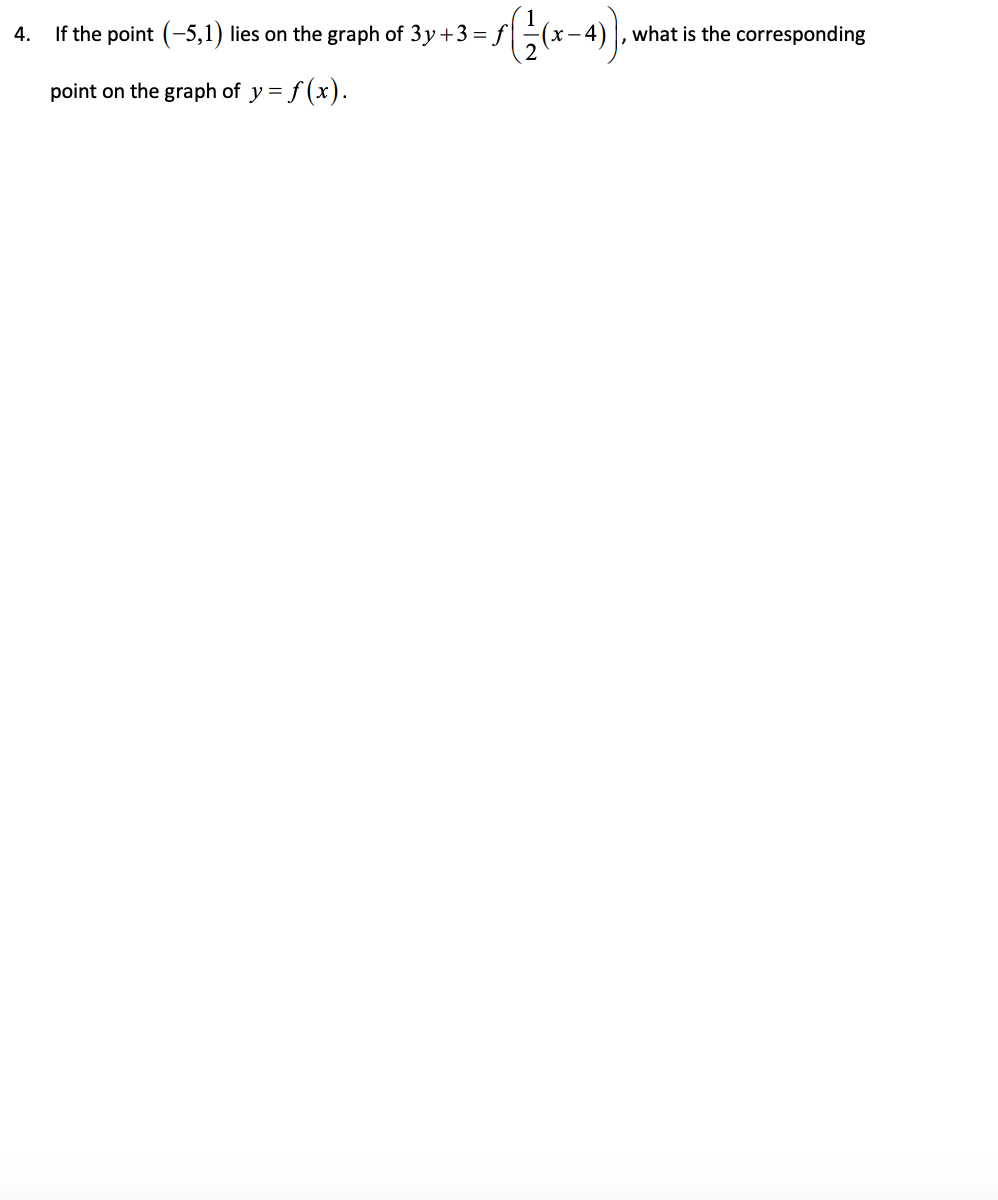
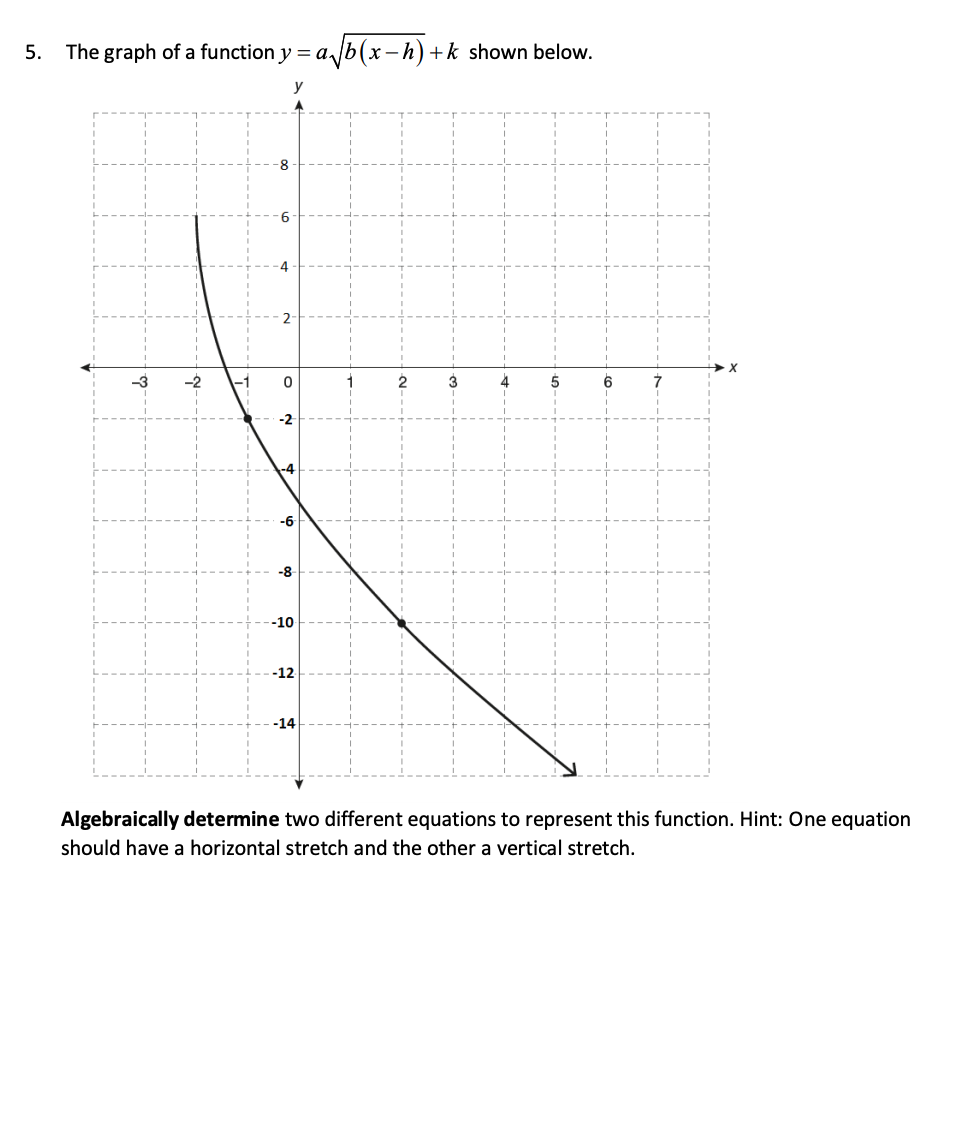
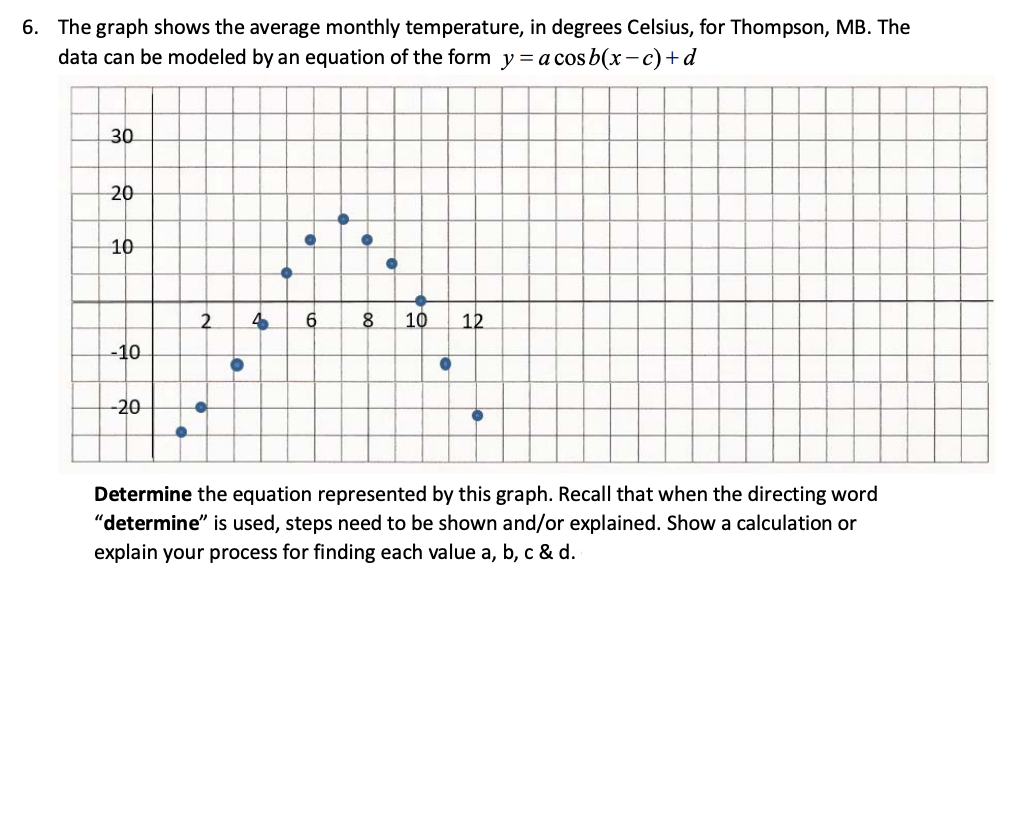
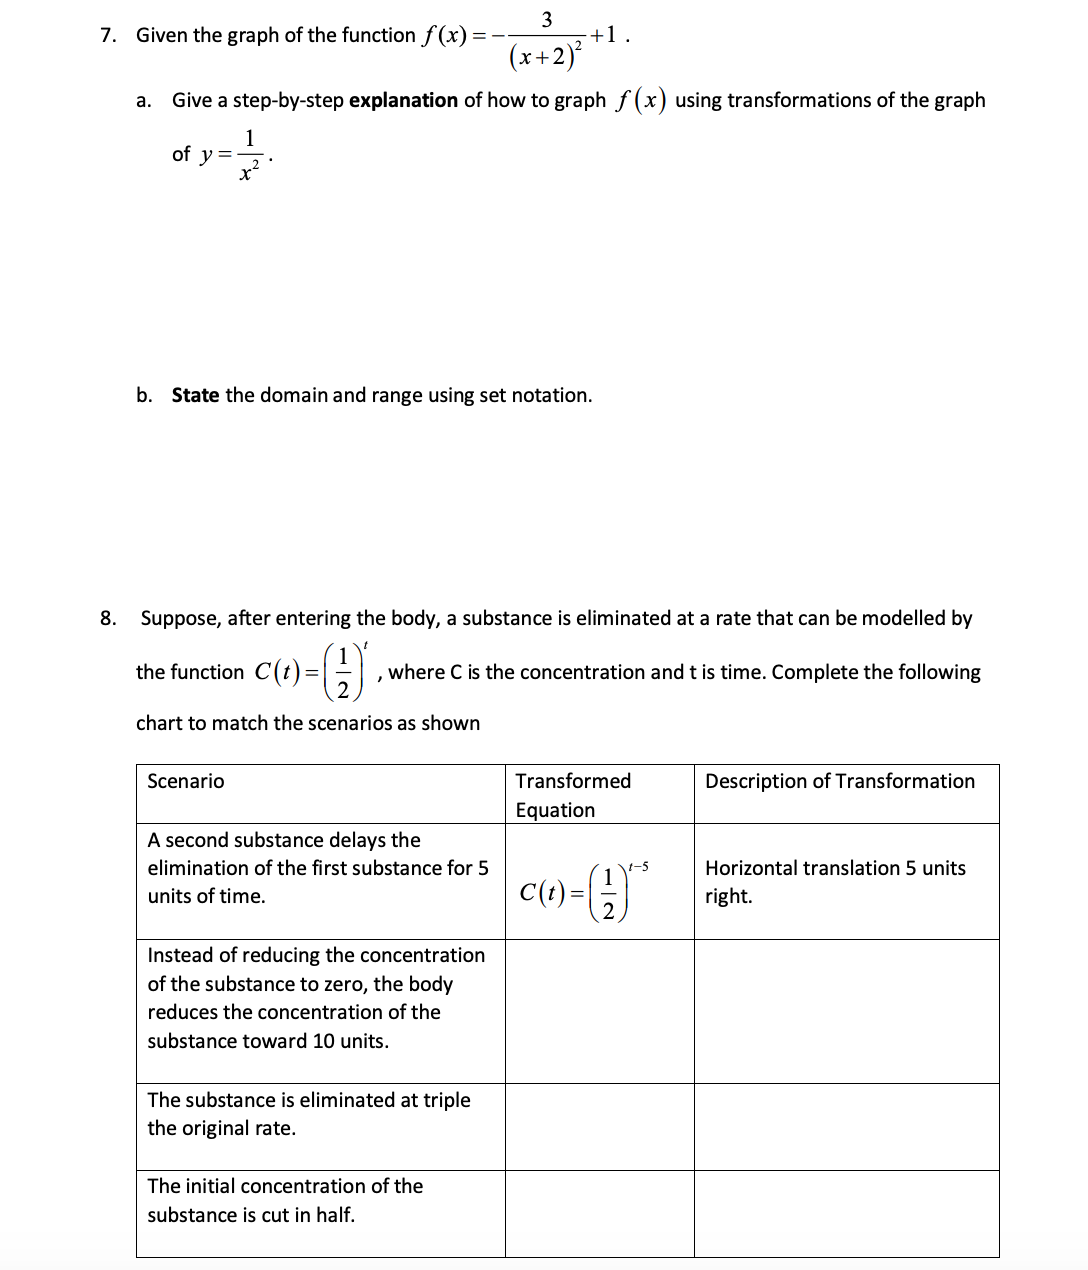
1. The graph of f (x) = (x 3)2 is transformed toy = f(x +2) 5. a. State the vertex of the graph of y = f (x) and determine the vertex of the graph of the transformed function. (Recall that when the directing word \"determine\" is used, appropriate formulas, procedures and/or calculations need to be shown). b. The point (1,16) lies on the graph of y = f (x). Determine the corresponding point on the transformed function. c. The point (0, 4) lies on the graph of the transformed function. Determine the corresponding point on the graph of the original function y = f (x). 2. The graph of y = f (x) is shown below. -2 1-5 -4 -3.5 -3 -2.5 -2 -15 -1 -0.5 0 015 15 2 25 5 3 3.5 4 10.5 ( -2 5 , - 0.5) -1 -1.5 -2 a. On the grid, sketch the graph of y = f (x) b. Describe the transformation(s) that occurred. Use the appropriate terms (translation, reflection and/or stretch) and identify any relevant axis or line with its equation. c. State the domain and range for y = f (x ) using interval notation. d. Restrict the domain of y = f (x) so that the graph of y = f- (x) is a function. State the restriction using interval notation.3. The graph of y = x has been transformed so that it has a vertex at (-4,2 ) and passes through the point (-3, -1) . a. Sketch both parabolas on the grid provided. b. Determine the equation of the transformed function.4. If the point (5,1) lies on the graph of 3y +3 2 f[%(x 4)] , what is the corresponding point on the graph of y = f(x). 5. The graph of a function y = a b(x - h) + k shown below. -8 . 4 -3 -2 0 6 -2 -4 -6 -8 .10 -12 -14 Algebraically determine two different equations to represent this function. Hint: One equation should have a horizontal stretch and the other a vertical stretch.6. The graph shows the average monthly temperature, in degrees Celsius, for Thompson, MB. The data can be modeled by an equation of the form y = a cosb(x -c) + d 30 20 10 2 4 6 8 10 12 -10 -20 Determine the equation represented by this graph. Recall that when the directing word "determine" is used, steps need to be shown and/or explained. Show a calculation or explain your process for finding each value a, b, c & d.3 7. Given the graph of the function f(x) 2 2+1 . (x + 2) 3. Give a step-by-step explanation of how to graph f (I) using transformations of the graph 1 of = . y x2 b. State the domain and range using set notation. 8. Suppose, after entering the body, a substance is eliminated at a rate that can be modelled by 1 I the function C (t) = [] , where C is the concentration and t is time. Complete the following 2 chart to match the scenarios as shown Scenario Transformed Description of Transformation Equation A second substance delays the elimination of the rst substance for 5 1 H Horizontal translation 5 units units of time. C0) = [a] right. Instead of reducing the concentration of the substance to zero, the body reduces the concentration of the substance toward 10 units. The substance is eliminated at triple the original rate. The initial concentration of the substance is cut in half