

Question: Hello may I get some help with this question? The graph below shows the TC and TVC curves of Galbraith's Globes Inc., a perfectly competitive
Hello may I get some help with this question?
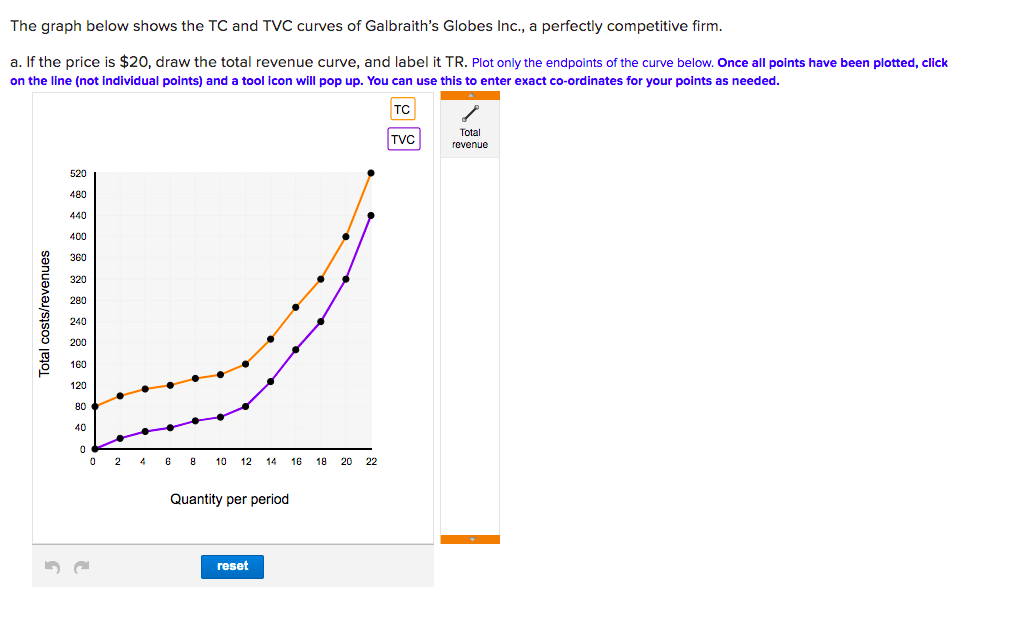
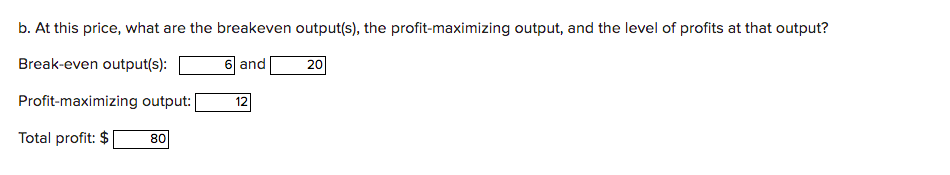
The graph below shows the TC and TVC curves of Galbraith's Globes Inc., a perfectly competitive firm. a. If the price is $20, draw the total revenue curve, and label it TR. Plot only the endpoints of the curve below. Once all points have been plotted, click on the line (not individual points) and a tool Icon will pop up. You can use this to enter exact co-ordinates for your points as needed. TC TVC Total revenue 520 480 Total costs/revenues 2 4 6 8 10 12 14 16 18 20 22 Quantity per period resetb. At this price, what are the breakeven output(s), the profit-maximizing output, and the level of profits at that output? Break-even output(s): 6 and 20 Profit-maximizing output: 12 Total profit: $ 80
Step by Step Solution
There are 3 Steps involved in it

Get step-by-step solutions from verified subject matter experts