

Question: Hello need help with these two questions. Please show all work and answers please thanks ! Need to have a better understanding of this. The
Hello need help with these two questions. Please show all work and answers please thanks ! Need to have a better understanding of this. 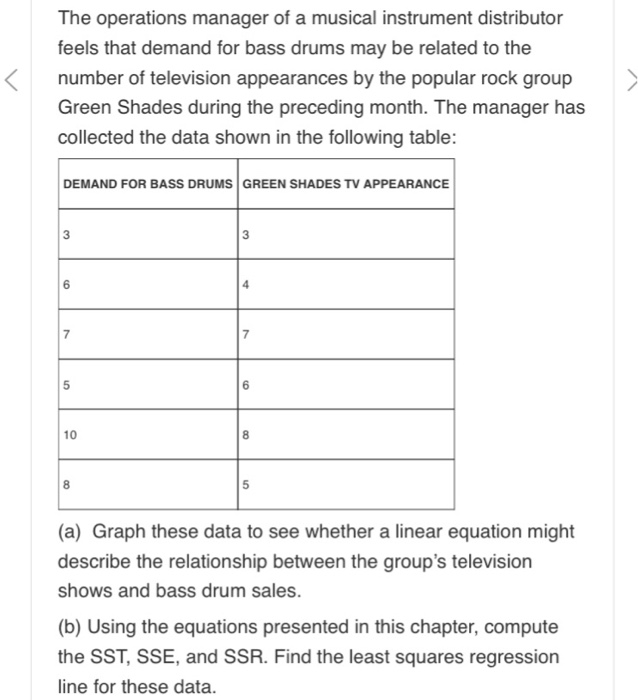
The operations manager of a musical instrument distributor feels that demand for bass drums may be related to the number of television appearances by the popular rock group > Green Shades during the preceding month. The manager has collected the data shown in the following table: DEMAND FOR BASS DRUMS GREEN SHADES TV APPEARANCE 3 3 6 7 5 6 10 5 (a) Graph these data to see whether a linear equation might describe the relationship between the group's television shows and bass drum sales. (b) Using the equations presented in this chapter, compute the SST, SSE, and SSR. Find the least squares regression ine for these data
Step by Step Solution
There are 3 Steps involved in it
1 Expert Approved Answer
Step: 1 Unlock

Question Has Been Solved by an Expert!
Get step-by-step solutions from verified subject matter experts
Step: 2 Unlock
Step: 3 Unlock