

Question: Hello, need validation on how to calculate the Red Data Point in the graph, I believe I made an error. Opf was added towards the
Hello, need validation on how to calculate the Red Data Point in the graph, I believe I made an error.
Opf was added towards the end, I need a correct X and Y access for the Data Point.
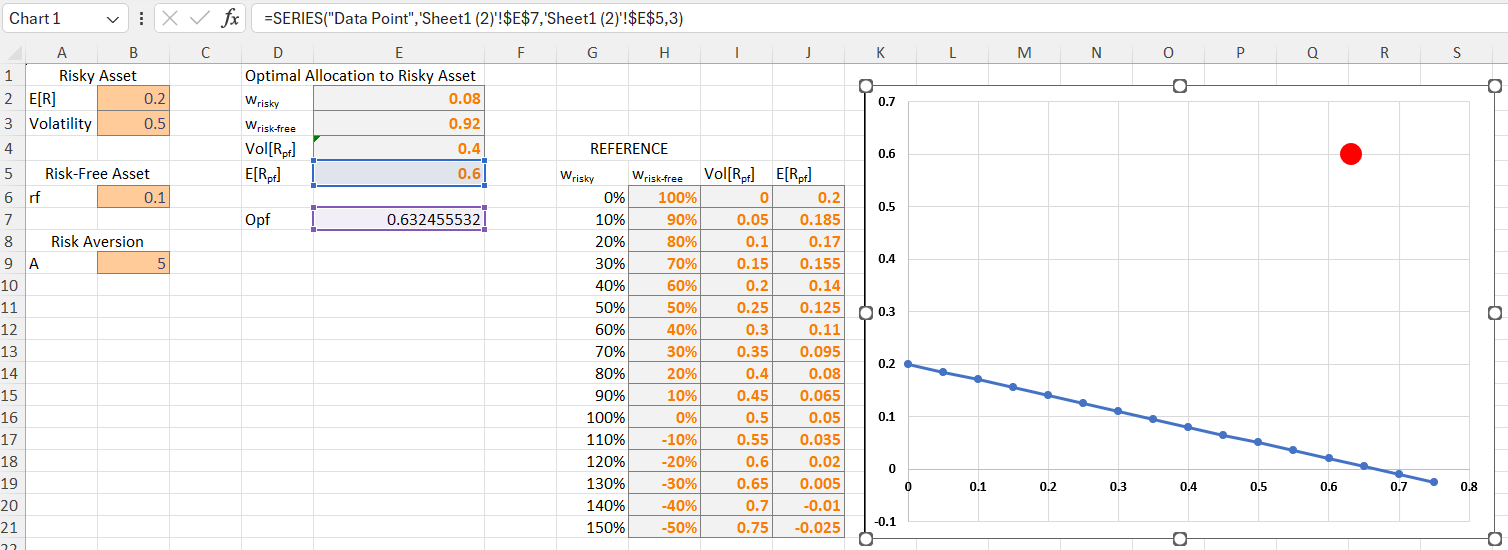
Chart 1 V I X V fx =SERIES("Data Point", 'Sheet1 (2)'!$E$7, 'Sheet1 (2)"!$E$5,3) A B C D E F G H K L M N O P Q R S Risky Asset Optimal Allocation to Risky Asset N P E[R] 0.2 Wrisky 0.08 O 0.7 3 Volatility 0.5 Wrisk-free 0.92 Vol[Rpf] 0.4 REFERENCE 0.6 Risk-Free Asset E[Rpf] 0.6 Wrisky Wrisk-free Vol[Rpf] E[Rpf] 6 rf 0.1 0% 100% 0 0.2 0.5 Opf 0.632455532 10% 90% 0.05 0.185 8 Risk Aversion 20% 80% D.1 0.17 9 A 5 30% 70% 0.15 0.155 0.4 10 40% 60% 0.2 0.14 11 50% 50% 0.25 0.125 O 0.3 12 60% 40% 0.3 0.11 13 70% 30% 0.35 0.095 14 80% 0.2 20% 0.4 0.08 15 90% 10% 0.45 0.065 100% 0% 0.5 0.05 0.1 110% -10% 0.55 0.035 120% -20% 0.6 0.02 0 130% -30% 0.65 0.005 0.1 0.2 0.3 0.4 0.5 0.6 0.7 0.8 140% -40% 0.7 -0.01 150% -50% 0.75 -0.025 -0.1
Step by Step Solution
There are 3 Steps involved in it

Get step-by-step solutions from verified subject matter experts