Question: Hello! please answer all 10 questions clearly please its sometimes hard to understand the experts please thank you! 1. [-/20 Points) DETAILS ASWMSC115 3.E.003. MY
Hello! please answer all 10 questions clearly please its sometimes hard to understand the experts please thank you!
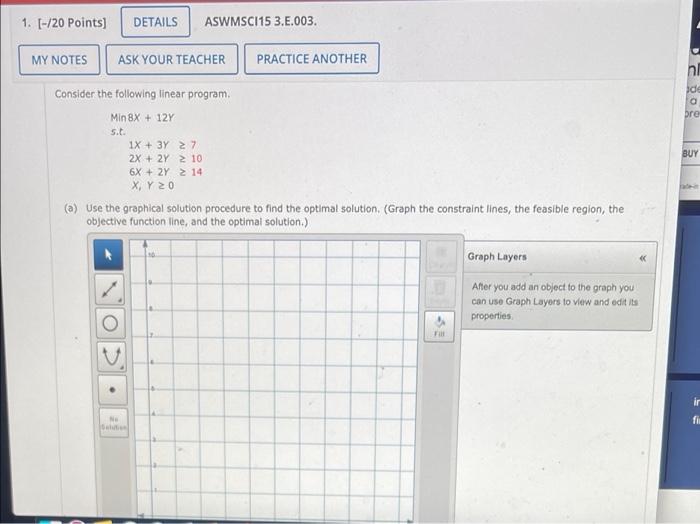
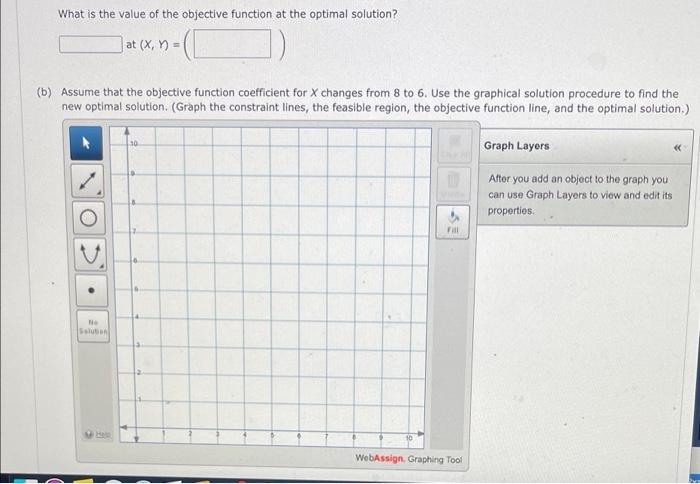
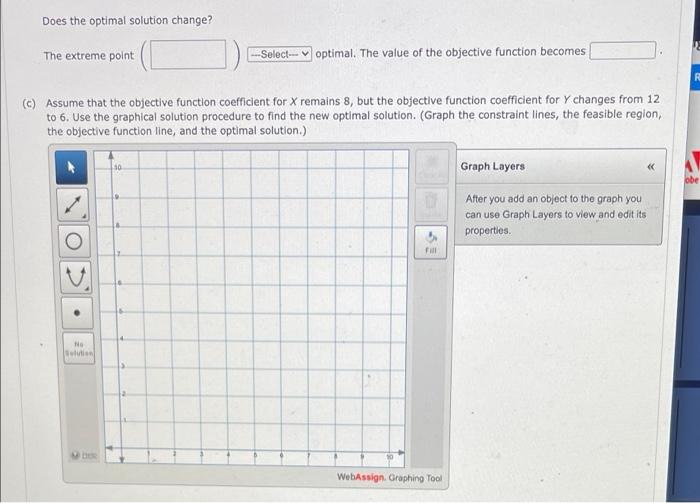
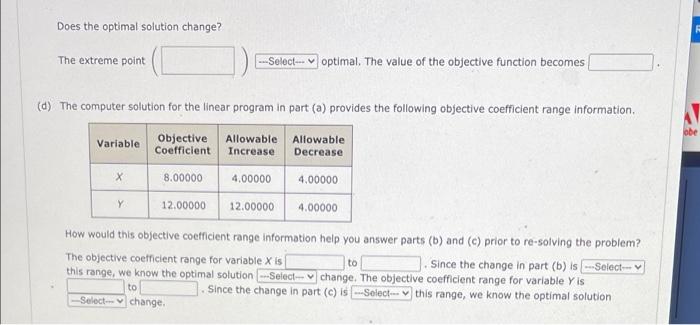
1. [-/20 Points) DETAILS ASWMSC115 3.E.003. MY NOTES ASK YOUR TEACHER PRACTICE ANOTHER Doo de Consider the following linear program Min 8X + 12Y bre BUY 1X + 3Y 27 2X + 2Y > 10 6X + 2Y > 14 X Y 20 (a) Use the graphical solution procedure to find the optimal solution. (Graph the constraint lines, the feasible region, the objective function line, and the optimal solution) Graph Layers After you add an object to the graph you can use Graph Layors to view and edit its properties FI NE What is the value of the objective function at the optimal solution? at (x, n (b) Assume that the objective function coefficient for X changes from 8 to 6. Use the graphical solution procedure to find the new optimal solution. (Graph the constraint lines, the feasible region, the objective function line, and the optimal solution) Graph Layers After you add an object to the graph you can use Graph Layers to view and edit its properties F Solution 10 WebAssign. Graphing Tool Does the optimal solution change? The extreme point Select optimal. The value of the objective function becomes (c) Assume that the objective function coefficient for X remains 8, but the objective function coefficient for Y changes from 12 to 6. Use the graphical solution procedure to find the new optimal solution. (Graph the constraint lines, the feasible region, the objective function line, and the optimal solution.) Graph Layers bbe After you add an object to the graph you can use Graph Layers to view and edit its roperties Full NE Sevin WebAssign Graphing Tool Does the optimal solution change? The extreme point Select optimal. The value of the objective function becomes (d) The computer solution for the linear program in part (a) provides the following objective coefficient range information, Variable Objective Coefficient Allowable Increase Allowable Decrease X 8.00000 4.00000 4.00000 4.00000 Y 12.00000 12.00000 How would this objective coefficient range Information help you answer parts (b) and (c) prior to re-solving the problem? The objective coefficient range for variable X is to Since the change in part (b) is ---Select- this range, we know the optimal solution --Select- change. The objective coefficient range for variable Y is to Since the change in part (c) is ---Select this range, we know the optimal solution Select change 1. [-/20 Points) DETAILS ASWMSC115 3.E.003. MY NOTES ASK YOUR TEACHER PRACTICE ANOTHER Doo de Consider the following linear program Min 8X + 12Y bre BUY 1X + 3Y 27 2X + 2Y > 10 6X + 2Y > 14 X Y 20 (a) Use the graphical solution procedure to find the optimal solution. (Graph the constraint lines, the feasible region, the objective function line, and the optimal solution) Graph Layers After you add an object to the graph you can use Graph Layors to view and edit its properties FI NE What is the value of the objective function at the optimal solution? at (x, n (b) Assume that the objective function coefficient for X changes from 8 to 6. Use the graphical solution procedure to find the new optimal solution. (Graph the constraint lines, the feasible region, the objective function line, and the optimal solution) Graph Layers After you add an object to the graph you can use Graph Layers to view and edit its properties F Solution 10 WebAssign. Graphing Tool Does the optimal solution change? The extreme point Select optimal. The value of the objective function becomes (c) Assume that the objective function coefficient for X remains 8, but the objective function coefficient for Y changes from 12 to 6. Use the graphical solution procedure to find the new optimal solution. (Graph the constraint lines, the feasible region, the objective function line, and the optimal solution.) Graph Layers bbe After you add an object to the graph you can use Graph Layers to view and edit its roperties Full NE Sevin WebAssign Graphing Tool Does the optimal solution change? The extreme point Select optimal. The value of the objective function becomes (d) The computer solution for the linear program in part (a) provides the following objective coefficient range information, Variable Objective Coefficient Allowable Increase Allowable Decrease X 8.00000 4.00000 4.00000 4.00000 Y 12.00000 12.00000 How would this objective coefficient range Information help you answer parts (b) and (c) prior to re-solving the problem? The objective coefficient range for variable X is to Since the change in part (b) is ---Select- this range, we know the optimal solution --Select- change. The objective coefficient range for variable Y is to Since the change in part (c) is ---Select this range, we know the optimal solution Select change