

Question: Hello, please check my work using the provided information. And here is my work... Part a: Using the fiscal year end 2020 and 2019 annual
Hello, please check my work using the provided information.
And here is my work...
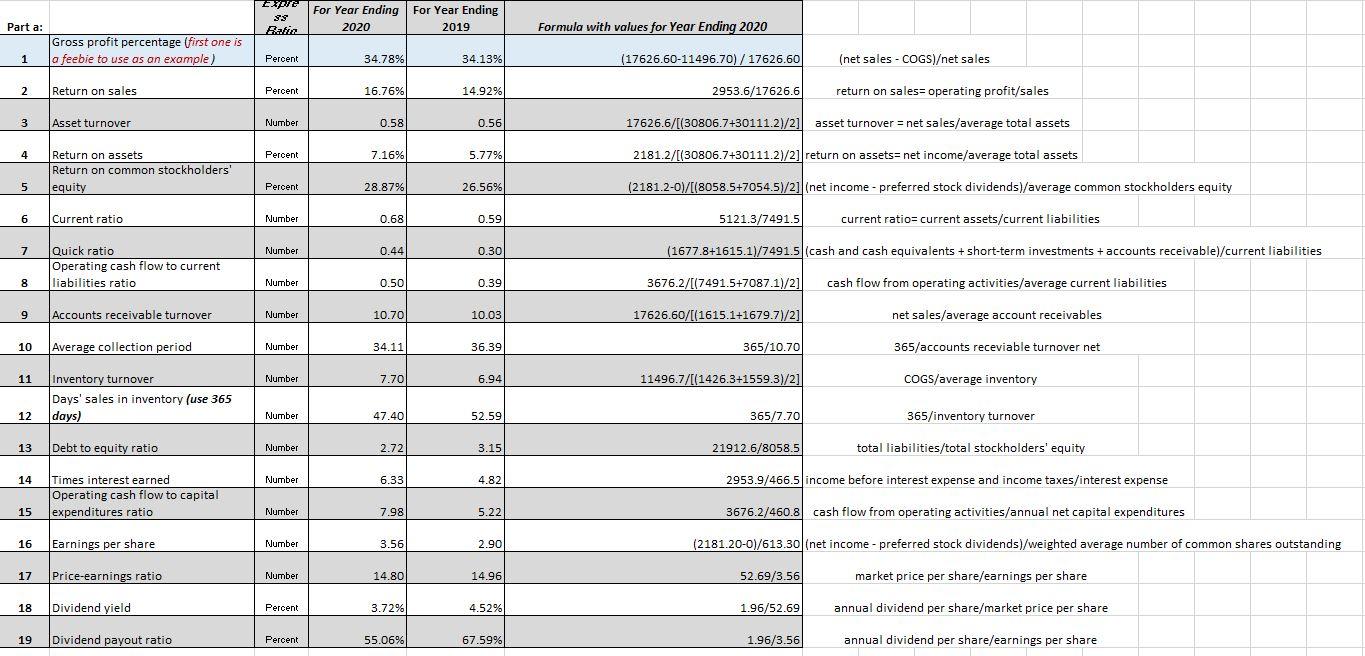
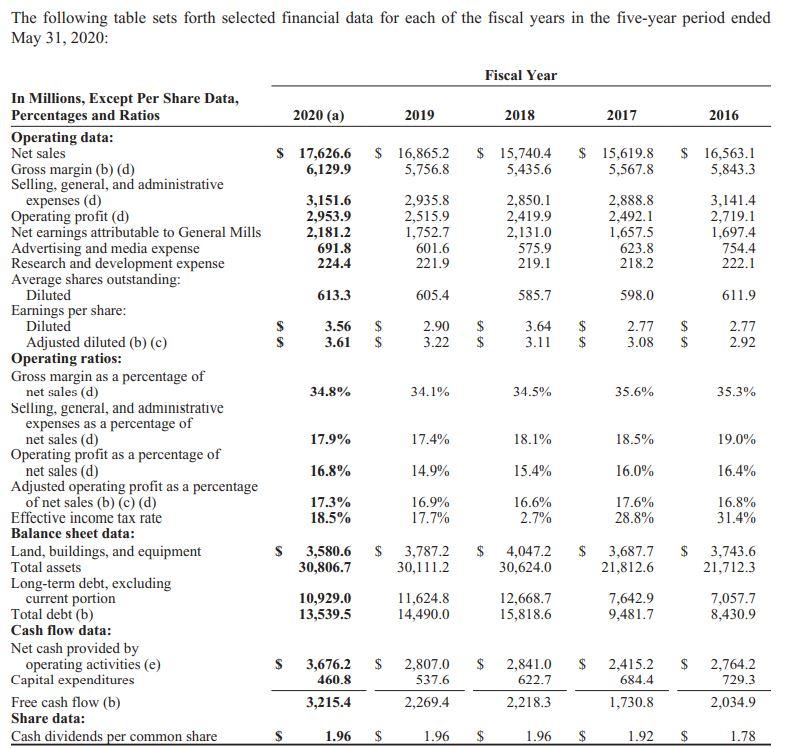
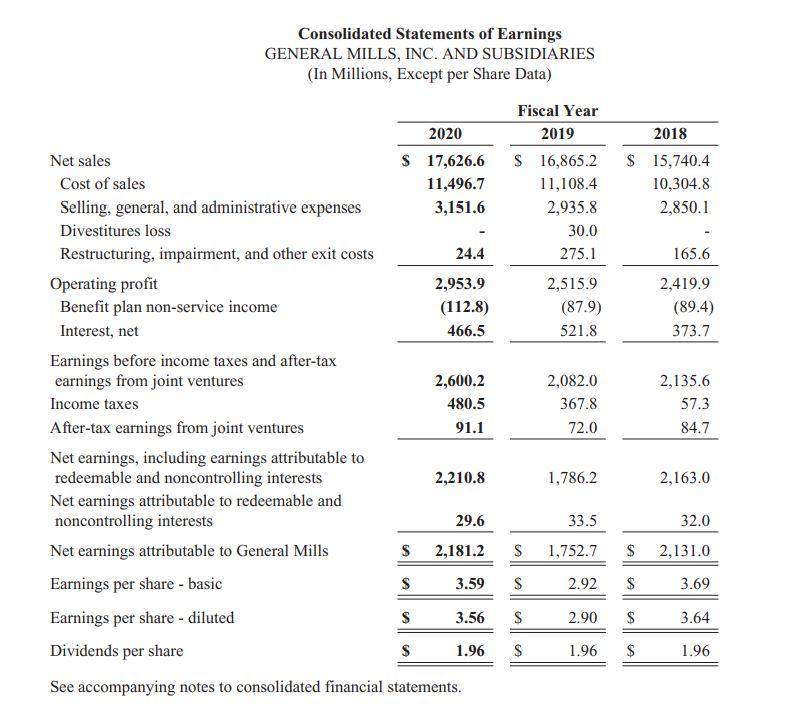
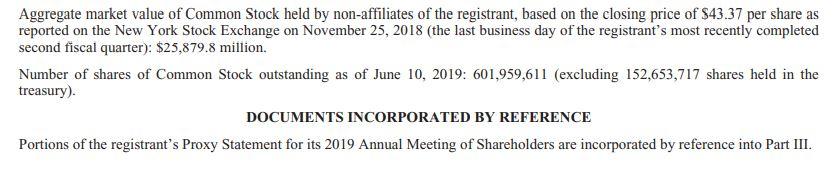
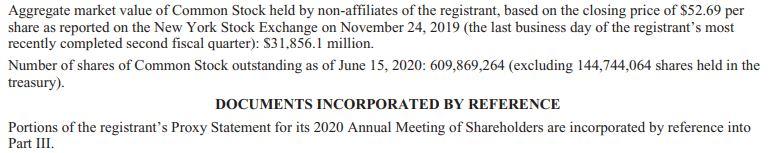
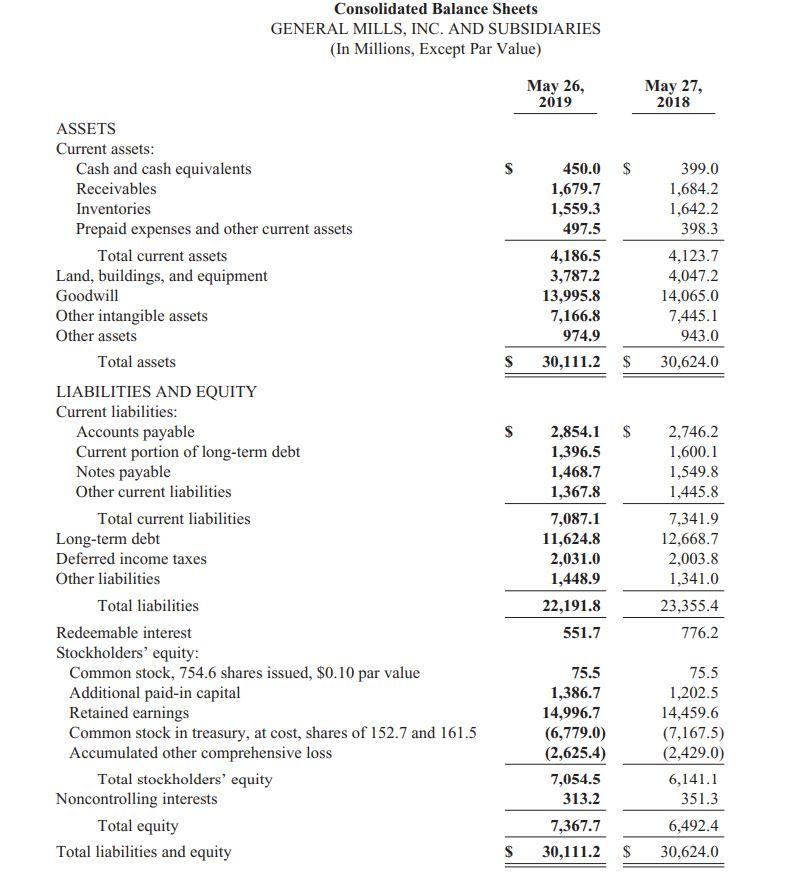
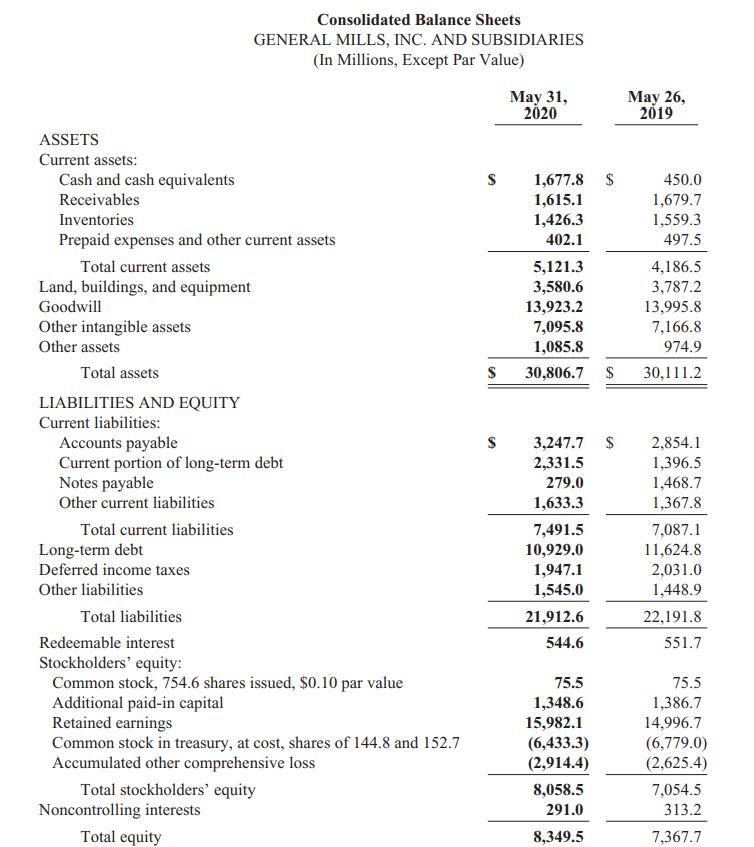
Part a: Using the fiscal year end 2020 and 2019 annual reports for General Mills, Inc. calculate the following financial ratios for 2020 and 2019 using the EXCEL template provided. 1. Gross profit percentage 2. Return on sales 3. Asset turnover 4. Return on assets 5. Return on common stockholders' equity 6. Current ratio 7. Quick ratio 8. Operating-cash-flow-to-current-liabilities ratio 9. Accounts receivable turnover 10. Average collection period 11. Inventory turnover 12. Days' sales in inventory 13. Debt-to-equity ratio 14. Times-interest-earned ratio 15. Operating-cash-flow-to-capital-expenditures ratio 16. Earnings per share 17. Price-earnings ratio 18. Dividend yield 19. Dividend payout ratio The following table sets forth selected financial data for each of the fiscal years in the five-year period ended May 31, 2020: In Millions, Except Per Share Data, Percentages and Ratios Operating data: Net sales Gross margin (b) (d) Selling, general, and administrative expenses (d) Operating profit (d) Net earnings attributable to General Mills Advertising and media expense Research and development expense Average shares outstanding: Diluted Earnings per share: Diluted Adjusted diluted (b) (c) Operating ratios: Gross margin as a percentage of net sales (d) Selling, general, and administrative expenses as a percentage of net sales (d) Operating profit as a percentage of net sales (d) Adjusted operating profit as a percentage of net sales (b) (c) (d) Effective income tax rate Balance sheet data: Land, buildings, and equipment Total assets Long-term debt, excluding current portion Total debt (b) Cash flow data: Net cash provided by operating activities (e) Capital expenditures Free cash flow (b) Share data: Cash dividends per common share $ 17,626.6 6,129.9 69 69 2020 (a) 3,151.6 2,953.9 2,181.2 $ 691.8 224.4 34.8% 17.9% 16.8% 17.3% 18.5% 613.3 3.56 $ 2.90 $ 3.61 $ 3.22 $ 10,929.0 13,539.5 $ 3,676.2 460.8 3,215.4 $ 16,865.2 5,756.8 1.96 2019 GA GA 2,935.8 2,515.9 1,752.7 601.6 221.9 $ 605.4 34.1% 17.4% 14.9% 16.9% 17.7% Fiscal Year 11,624.8 14,490.0 $ 2,807.0 537.6 2,269.4 1.96 $ 15,740.4 5,435.6 2018 $ 3,580.6 $ 3,787.2 $ 4,047.2 30,806.7 30,111.2 30,624.0 2,850.1 2,419.9 2,131.0 $ 575.9 219.1 585.7 3.64 3.11 34.5% 18.1% 15.4% 16.6% 2.7% 12,668.7 15,818.6 $ 2,841.0 622.7 2,218.3 1.96 $ 15,619.8 5,567.8 GA GA $ $ $ $ 2017 $ 2,888.8 2,492.1 1,657.5 623.8 218.2 598.0 2.77 3.08 35.6% 18.5% 16.0% 17.6% 28.8% 7,642.9 9,481.7 $ 16,563.1 5,843.3 $ 69 69 1.92 3,687.7 $ 21,812.6 $ 2016 $ 3,141.4 2,719.1 1,697.4 754.4 222.1 611.9 2.77 2.92 35.3% 19.0% 16.4% 16.8% 31.4% 3,743.6 21,712.3 2,415.2 $ 2,764.2 684,4 729.3 1,730.8 2,034.9 7,057.7 8,430.9 1.78 Net sales Consolidated Statements of Earnings GENERAL MILLS, INC. AND SUBSIDIARIES (In Millions, Except per Share Data) Cost of sales Selling, general, and administrative expenses Divestitures loss Restructuring, impairment, and other exit costs Operating profit Benefit plan non-service income Interest, net Earnings before income taxes and after-tax earnings from joint ventures Income taxes After-tax earnings from joint ventures Net earnings, including earnings attributable to redeemable and noncontrolling interests 2020 $ 17,626.6 11,496.7 3,151.6 24.4 2,953.9 (112.8) 466.5 2,600.2 480.5 91.1 2,210.8 Net earnings attributable to redeemable and noncontrolling interests Net earnings attributable to General Mills Earnings per share - basic Earnings per share - diluted Dividends per share See accompanying notes to consolidated financial statements. 29.6 S 2,181.2 S S 3.59 3.56 1.96 Fiscal Year 2019 $ 16,865.2 11,108.4 2,935.8 30.0 275.1 2,515.9 (87.9) 521.8 2,082.0 367.8 72.0 1,786.2 2018 $ 15,740.4 10,304.8 2,850.1 33.5 $ 1,752.7 $ $ 2.92 $ $ $ $ 1.96 $ 2.90 165.6 2,419.9 (89.4) 373.7 2,135.6 57.3 84.7 2,163.0 32.0 2,131.0 3.69 3.64 1.96 Aggregate market value of Common Stock held by non-affiliates of the registrant, based on the closing price of $43.37 per share as reported on the New York Stock Exchange on November 25, 2018 (the last business day of the registrant's most recently completed second fiscal quarter): $25,879.8 million. Number of shares of Common Stock outstanding as of June 10, 2019: 601,959,611 (excluding 152,653,717 shares held in the treasury). DOCUMENTS INCORPORATED BY REFERENCE Portions of the registrant's Proxy Statement for its 2019 Annual Meeting of Shareholders are incorporated by reference into Part III. Aggregate market value of Common Stock held by non-affiliates of the registrant, based on the closing price of $52.69 per share as reported on the New York Stock Exchange on November 24, 2019 (the last business day of the registrant's most recently completed second fiscal quarter): $31.856.1 million. Number of shares of Common Stock outstanding as of June 15, 2020: 609,869,264 (excluding 144,744,064 shares held in the treasury). DOCUMENTS INCORPORATED BY REFERENCE Portions of the registrant's Proxy Statement for its 2020 Annual Meeting of Shareholders are incorporated by reference into Part III. ASSETS Current assets: Cash and cash equivalents Receivables Inventories Prepaid expenses and other current assets Total current assets Land, buildings, and equipment Goodwill Other intangible assets Other assets Total assets LIABILITIES AND EQUITY Current liabilities: Consolidated Balance Sheets GENERAL MILLS, INC. AND SUBSIDIARIES (In Millions, Except Par Value) Accounts payable Current portion of long-term debt Notes payable Other current liabilities Total current liabilities Long-term debt Deferred income taxes Other liabilities Total liabilities Redeemable interest Stockholders' equity: Common stock, 754.6 shares issued, $0.10 par value Additional paid-in capital Retained earnings Common stock in treasury, at cost, shares of 152.7 and 161.5 Accumulated other comprehensive loss Total stockholders' equity Noncontrolling interests Total equity Total liabilities and equity S S S S May 26, 2019 450.0 1,679.7 1,559.3 497.5 4,186.5 3,787.2 13,995.8 7,166.8 974.9 30,111.2 $ 2,854.1 $ 1,396.5 1,468.7 1,367.8 7,087.1 11,624.8 2,031.0 1,448.9 22,191.8 551.7 $ 75.5 1,386.7 14,996.7 (6,779.0) (2,625.4) 7,054.5 313.2 7,367.7 30,111.2 May 27, 2018 399.0 1,684.2 1,642.2 398.3 4,123.7 4,047.2 14,065.0 7,445.1 943.0 30,624.0 2,746.2 1,600.1 1,549.8 1,445.8 7,341.9 12,668.7 2,003.8 1,341.0 23,355.4 776.2 75.5 1,202.5 14,459.6 (7,167.5) (2,429.0) 6,141.1 351.3 6,492.4 $ 30,624.0 ASSETS Current assets: Cash and cash equivalents Receivables Inventories Prepaid expenses and other current assets Total current assets Land, buildings, and equipment Goodwill Other intangible assets Other assets Total assets LIABILITIES AND EQUITY Current liabilities: Accounts payable Current portion of long-term debt Notes payable Other current liabilities Total current liabilities Consolidated Balance Sheets GENERAL MILLS, INC. AND SUBSIDIARIES (In Millions, Except Par Value) Long-term debt Deferred income taxes Other liabilities Total liabilities Redeemable interest Stockholders' equity: Common stock, 754.6 shares issued, $0.10 par value Additional paid-in capital Retained earnings Common stock in treasury, at cost, shares of 144.8 and 152.7 Accumulated other comprehensive loss Total stockholders' equity Noncontrolling interests Total equity S $ S May 31, 2020 1,677.8 $ 1,615.1 1,426.3 402.1 5,121.3 3,580.6 13,923.2 3,247.7 2,331.5 279.0 1,633.3 7,491.5 10,929.0 1,947.1 1,545.0 21,912.6 544.6 7,095.8 1,085.8 30,806.7 $ 30,111.2 75.5 1,348.6 15,982.1 (6,433.3) (2,914.4) 8,058.5 291.0 8,349.5 May 26, 2019 $ 450.0 1,679.7 1,559.3 497.5 4,186.5 3,787.2 13,995.8 7,166.8 974.9 2,854.1 1,396.5 1,468.7 1,367.8 7,087.1 11,624.8 2,031.0 1,448.9 22,191.8 551.7 75.5 1,386.7 14,996.7 (6,779.0) (2,625.4) 7,054.5 313.2 7,367.7 Part a: 1 2 3 4 5 6 7 8 9 10 11 12 13 14 15 16 18 Gross profit percentage (first one is a feebie to use as an example) 19 Return on sales Asset turnover Return on assets Return on common stockholders' equity Current ratio Quick ratio Operating cash flow to current. liabilities ratio Accounts receivable turnover Average collection period Inventory turnover Days' sales in inventory (use 365 days) Debt to equity ratio 17 Price-earnings ratio Times interest earned Operating cash flow to capital expenditures ratio Earnings per share Dividend yield Dividend payout ratio Expre 33 Patio Percent Percent Number Percent Percent Number Number Number Number Number Number Number Number Number Number Number Number Percent Percent For Year Ending For Year Ending 2020 2019 34.78% 16.76% 0.58 7.16% 28.87% 0.68 0.44 0.50 10.70 34.11 7.70 47.40 2.72 6.33 7.98 3.56 14.80 3.72% 55.06% 34.13% 14.92% 0.56 5.77% 26.56% 0.59 0.30 0.39 10.03 36.39 6.94 52.59 3.15 4.82 5.22 2.90 14.96 4.52% 67.59% Formula with values for Year Ending 2020 (17626.60-11496.70)/17626.60 (net sales - COGS)et sales return on sales operating profit/sales 17626.6/[(30806.7+30111.2)/2] asset turnover = net sales/average total assets 2181.2/[(30806.7+30111.2)/2] return on assets= net income/average total assets (2181.2-0)/[(8058.5+7054.5)/2] (net income - preferred stock dividends)/average common stockholders equity current ratio= current assets/current liabilities (1677.8+1615.1)/7491.5 (cash and cash equivalents + short-term investments + accounts receivable)/current liabilities 3676.2/[(7491.5+7087.1)/2] cash flow from operating activities/average current liabilities 17626.60/[(1615.1+1679.7)/2] net sales/average account receivables. 2953.6/17626.6 5121.3/7491.5 365/10.70 11496.7/[(1426.3+1559.3)/2] 365/7.70 21912.6/8058.5 365/inventory turnover total liabilities/total stockholders' equity 2953.9/466.5 income before interest expense and income taxes/interest expense 52.69/3.56 365/accounts receviable turnover net 3676.2/460.8 cash flow from operating activities/annual net capital expenditures (2181.20-0)/613.30 (net income - preferred stock dividends)/weighted average number of common shares outstanding market price per share/earnings per share annual dividend per share/market price per share 1.96/52.69 COGS/average inventory 1.96/3.56 annual dividend per share/earnings per share
Step by Step Solution
There are 3 Steps involved in it

Get step-by-step solutions from verified subject matter experts