

Question: Hello please do what is asked here. I will provide the gantt charts for FCFS and MLFQ. I need the gant chart of SJF done
Hello please do what is asked here. I will provide the gantt charts for FCFS and MLFQ. I need the gant chart of SJF done as well. I will post all the photos of what is needed. Just need you to create the code needed so I can save it as an executable as well like it asks in the photo below. And maybe help with implementation plan. Thank you.
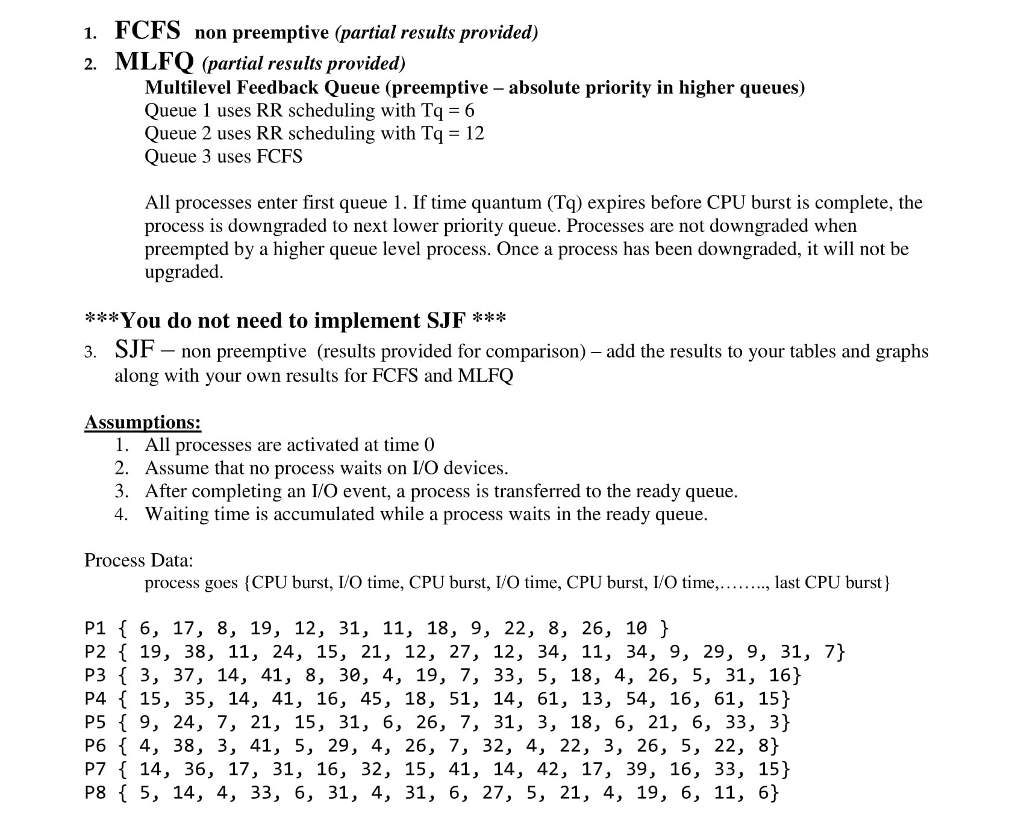
DATA FOR THE GANTT CHART TO IMPLEMENT FOR SJF
__________________________________________________________________________
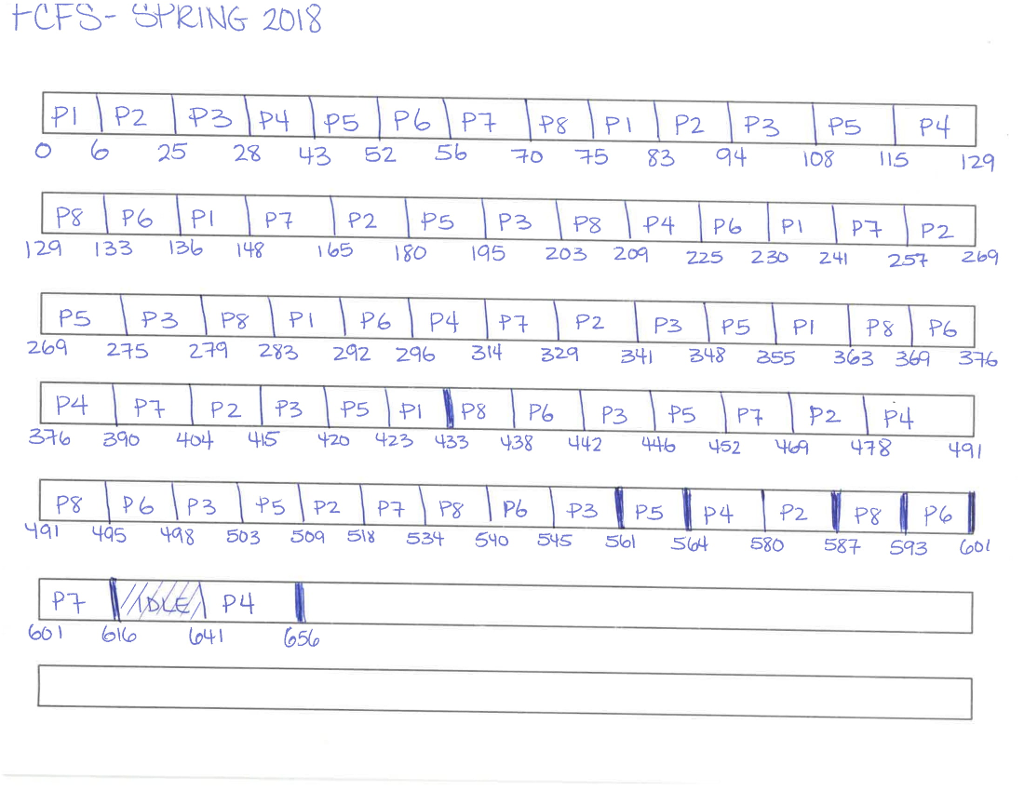
FCFS GANTT CHART
_________________________________________
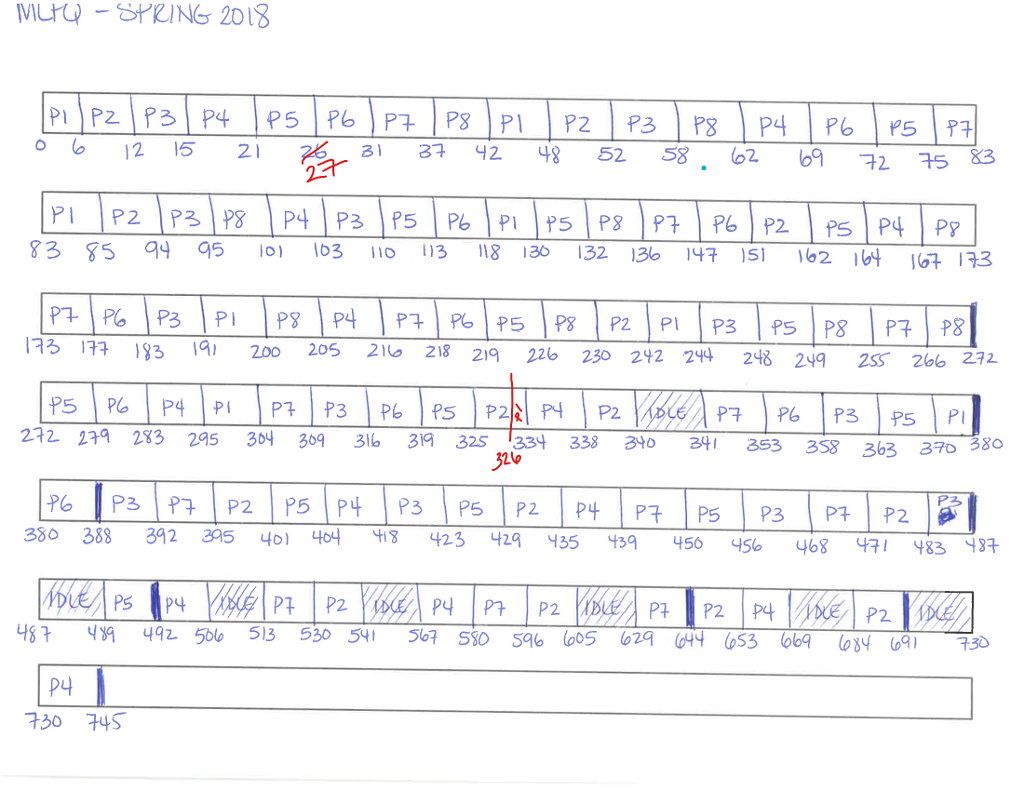
MLFQ GANTT CHART (The red is a correction)
__________________________________________________________
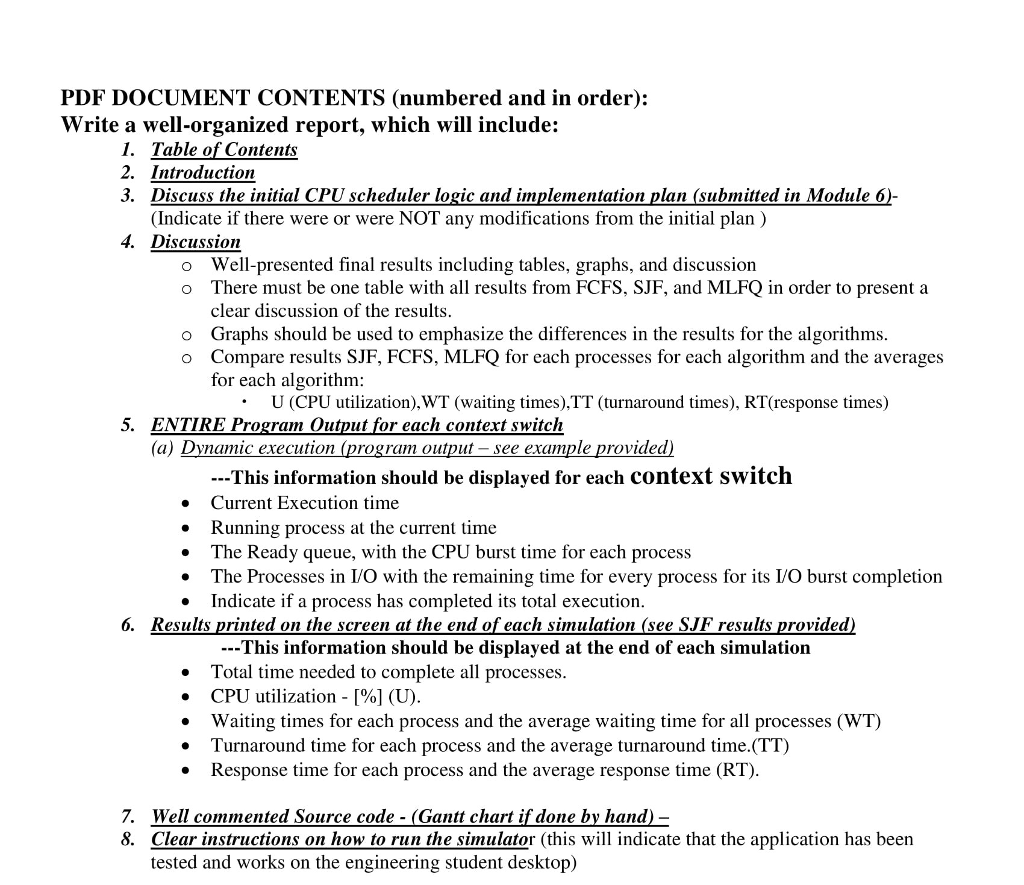
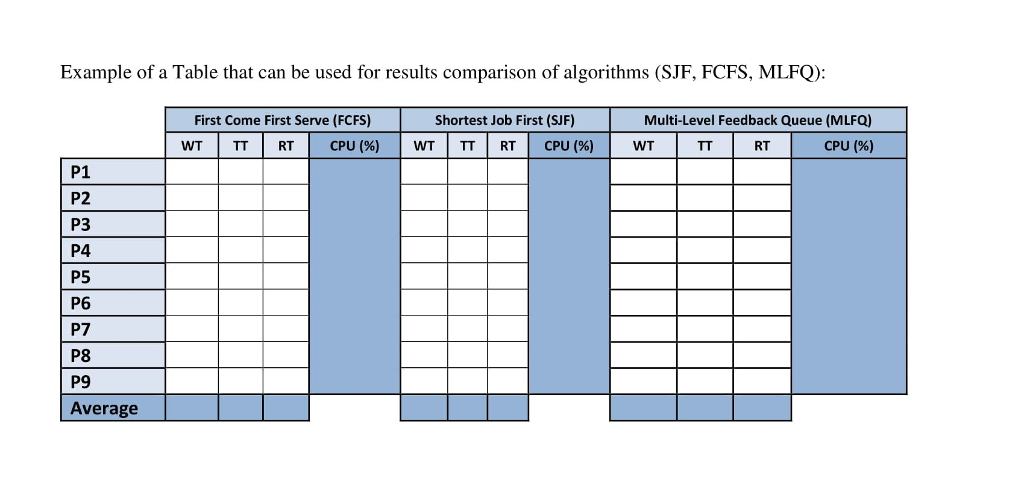
PDF DOCUMENT CONTENTS (numbered and in order): Write a well-organized report, which will include: 1. Table of Contents 2. Introduction 3. Discuss the initial CPU scheduler logic and implementation plan (submitted in Module 6 (Indicate if there were or were NOT any modifications from the initial plan ) Discussion Well-presented final results including tables, graphs, and discussion There must be one table with all results from FCFS, SJF, and MLFQ in order to present a clear discussion of the results o o o Graphs should be used to emphasize the differences in the results for the algorithms o Compare results SJF, FCFS, MLFQ for each processes for each algorithm and the averages for each algorithm U (CPU utilization).WT (waiting times),TT (turnaround times), RT(response times) 5. ENTIRE Program Output for each context switch (a) Dynamic execution (program output - see example provided --This information should be displayed for each context switch Current Execution time Running process at the current time The Ready queue, with the CPU burst time for each process . The Processes in I/O with the remaining time for every process for its I/O burst completion Indicate if a process has completed its total execution 6. Results printed on the screen at the end of each simulation (see SJF results provided --This information should be displayed at the end of each simulation Total time needed to complete all processes CPU utilization-1%] (U) Waiting times for each process and the average waiting time for all processes (WT) Turnaround time for each process and the average turnaround time.(TI) Response time for each process and the average response time (RT) . 7. Well commented Source code - (Gantt chart if done by hand)- 8. Clear instructions on how to run the simulator (this will indicate that the application has been tested and works on the engineering student desktop) PDF DOCUMENT CONTENTS (numbered and in order): Write a well-organized report, which will include: 1. Table of Contents 2. Introduction 3. Discuss the initial CPU scheduler logic and implementation plan (submitted in Module 6 (Indicate if there were or were NOT any modifications from the initial plan ) Discussion Well-presented final results including tables, graphs, and discussion There must be one table with all results from FCFS, SJF, and MLFQ in order to present a clear discussion of the results o o o Graphs should be used to emphasize the differences in the results for the algorithms o Compare results SJF, FCFS, MLFQ for each processes for each algorithm and the averages for each algorithm U (CPU utilization).WT (waiting times),TT (turnaround times), RT(response times) 5. ENTIRE Program Output for each context switch (a) Dynamic execution (program output - see example provided --This information should be displayed for each context switch Current Execution time Running process at the current time The Ready queue, with the CPU burst time for each process . The Processes in I/O with the remaining time for every process for its I/O burst completion Indicate if a process has completed its total execution 6. Results printed on the screen at the end of each simulation (see SJF results provided --This information should be displayed at the end of each simulation Total time needed to complete all processes CPU utilization-1%] (U) Waiting times for each process and the average waiting time for all processes (WT) Turnaround time for each process and the average turnaround time.(TI) Response time for each process and the average response time (RT) . 7. Well commented Source code - (Gantt chart if done by hand)- 8. Clear instructions on how to run the simulator (this will indicate that the application has been tested and works on the engineering student desktop)
Step by Step Solution
There are 3 Steps involved in it

Get step-by-step solutions from verified subject matter experts