

Question: Hello. Please help me solve this part 5 for a project. Please solve what you can, The attachment if the world file has the details.
Hello.
Please help me solve this part 5 for a project. Please solve what you can, The attachment if the world file has the details.
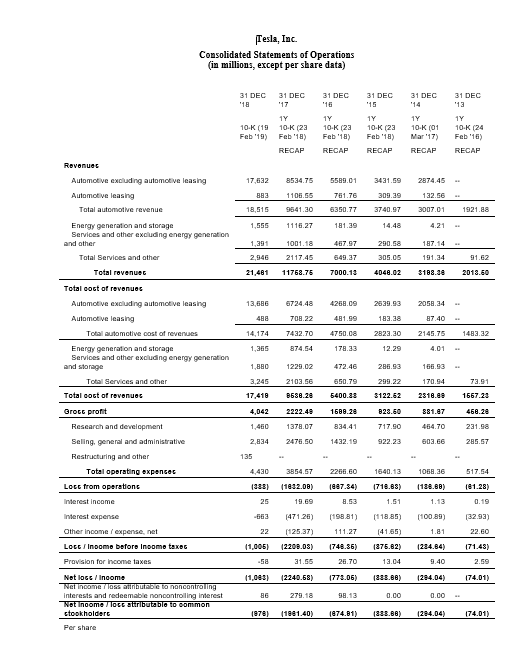
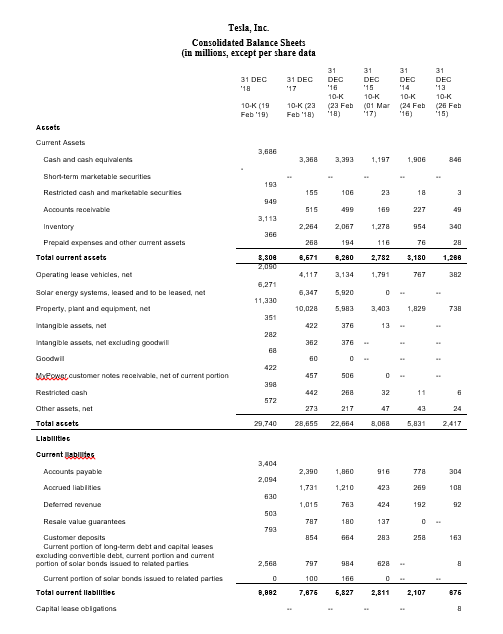
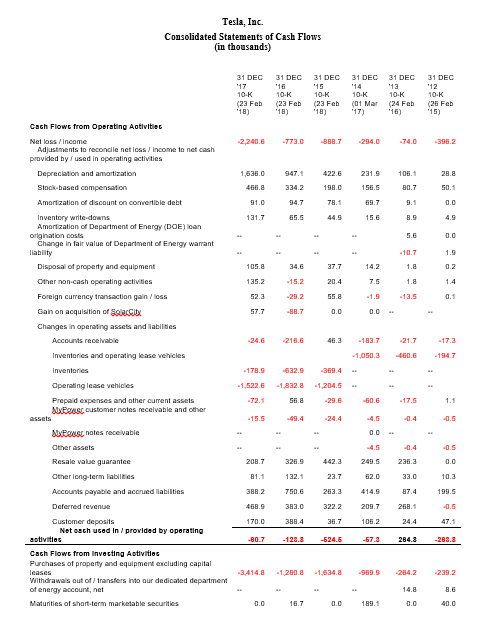
Part 5: Forecast of EPS Determine the latest quarterly reporting that company provided. When will be the next earnings announcement? Obtain Balance Sheet and Income Statements for all quarterly reporting in current fiscal year. Make your prediction of the next earnings per share (EPS). Be prepared to explain how you arrived to your forecast and what assumptions you made. Hints (procedure). 1. Forecast next quarter Sales based on prior growth and management guidance or any other information you have. 2. Forecast the Cost of goods sold (or cost of sales) based on the prior trends that you observed from Part2a and/or quarterly reports in the current fiscal year, management guidance, and any other information that you might have. 3. Forecast other expense items that company has based on the prior percentages and any new information you might have. Be prepared to explain your assumptions. 4. Calculate Net Income before tax 5. Apply the income tax rate from the prior quarter (you can modify it if you have any new information) 6. Calculate Net Income after tax Determine Number of Shares Outstanding. Divide Net Income after tax on Number of Shares Outstanding to obtain EPS. 7. Consolidated Statements of Operations (in millions, except per share data) 17 0-K 19 10-K (23 10-K (23 10-K (23 10-K (0 10-K (24 Feb19) Feb18) Feb) Feb 18) ar17 Feb '16) Automotve excluding automotve leasing 17,632 8534.75 5589.01 3431.59 2874.45 Automotve leasing 309.39 Total automotve rewenue 9541.30 3007.01 1921.88 Energy generation and storage Services and ather excuding energy generat on and other 467.97 290.58 187.14 49.37 Total revenuet 21,481 11763.75 7000.1 4048.02 18. 2013.60 Total oot of revenuec Automotve excluding automotve leasing 13,686 5724.48 4268.09 2639.93 2058.34 T0B.22 Automotve leasing Energy generation and storage Services and ather excuding energy generat on and storage 1,365 2.29 1B80 1229.02 286.93 73.91 Total Services and other 50.79 299.22 Total oost of revenues 17,418 B638.28 5400.33 122.62 2318.8 1667.24 Grots prof t Research and development 1378.07 Seling, general and administrative 2.834 2476.50 1432.19 922.23 603.66 285.57 517.54 Total operating expenses 4430 3854.57 2266.60 Lotc from operationc 1832.08) 7.34) (718.83) 81.28 138.88 Merest income Merest expense 663 47126)98.81) 18.85) 00 89)3293) 22 125.37) Loce Inpome before Inoome taxec 234.84) 1,005 220B.03) (748.36 36) 375.82) 71.43 1,083 2240.68) 3.06) 1338.88) (284.04) 74.01 emable noncontroling inte 88) 284.04) 188140) 874.81) Tesla, Inc. Consolidated Balance Sheets in millions, ercept per share data 1 DEC 31 0K 9 10-K (23 (23 Feb (01 Mar (24 Feb (26 Feb Feb'19) Feb '18) Current Assets ,3683,393 ,197 1,9D6 Short-term marketable seourities h and marketable securtes Prepad expenses and ather curent assets B,671 ,28 2,782 ,130 ,288 Operating lease wehicles, net 4,1173,134 1,791 Solar energy systems, leased and to be leased, ne Property, plant and equipment, net 0,028 5,983 3,403 1829 376 ntangible assets, et excluding goodwil Eestcustomer notes receabie, net of current partion 32 29,740 28,65 22,664 8,D68 5831 2417 currentblutes Current port on of long-term debt and capital lease excluding convertible debt, curremt portion and curent partion of solar bonds issued to related partes 628 . Current port on of solar bonds issued to related parties Total ourrent llablltiec 7,876 6,827 2,811 2,107 Capital lease obigaions Consolidated Statements of Cash Flows (in thousands) 31 DEC 31 DEC 31 DEC 31 DEC 31 DEC 31 DEC 23 Feb 23 Feb (23 Feb (01 Mar (24 Feb (26 Feb Cach Flowe from Operating Aotlvibec t lossincome Adjustments to reconcile net lossincome to net cash provided by fused in operating activties 2,240.6 773.0 888.7294.0 74.0396.2 Depreciaton and amtization 636.0 947.1 422.6 231.9 466.8334.198.0 Amortzation of 94.7 8.1 69.7 Inventory wnite-downs Amort zation of Department of Energy (DOE) oan origination oosts Change in fair value of Department of Energy warant liability Disposal of property and equipment 7.7 Other non-cash operating activbes 35.2 7.5 1.8 Foreign currency transaction gain loss Gain on acquisition of Sciit 57.7 B8.7 Accounts recewabie 24.6216.6 183.721.717.3 Inventories and operating ease vehicles 1,050.3460.6 94.7 178.932.9 369.4 Operating lease vehicies 1,522.6 1,832.8 -1,204.5 Prepa d expenses and other oument assets MEausc oustomer notes recelvable and other 0.4 NReusc notes Resale value guarantee 087326.9 442.3 249. 236.3 Other long-term labiites 23.7 Accounts payable and 388.2 7506 263.3 414.9 87.4 468.9383.0 322.2 209.7 268.1 Customer deposits Net oach uced In provlded by oporating 170.0 388.4 24.4 Cash Flowc from Invecting Aotivitie Purchases of property and equipment 1cluding capital 3,414.8 1,280.8 -1,634.8969.9264.2 239.2 withdra was ut ol transfers no ur dedicated department of energy account, net
Step by Step Solution
There are 3 Steps involved in it

Get step-by-step solutions from verified subject matter experts