

Question: Hello, please help me with this, I continue to get it incorrect. 7 . Economic fluctuations I The following graph shmus the economy in long-run

Hello, please help me with this, I continue to get it incorrect.
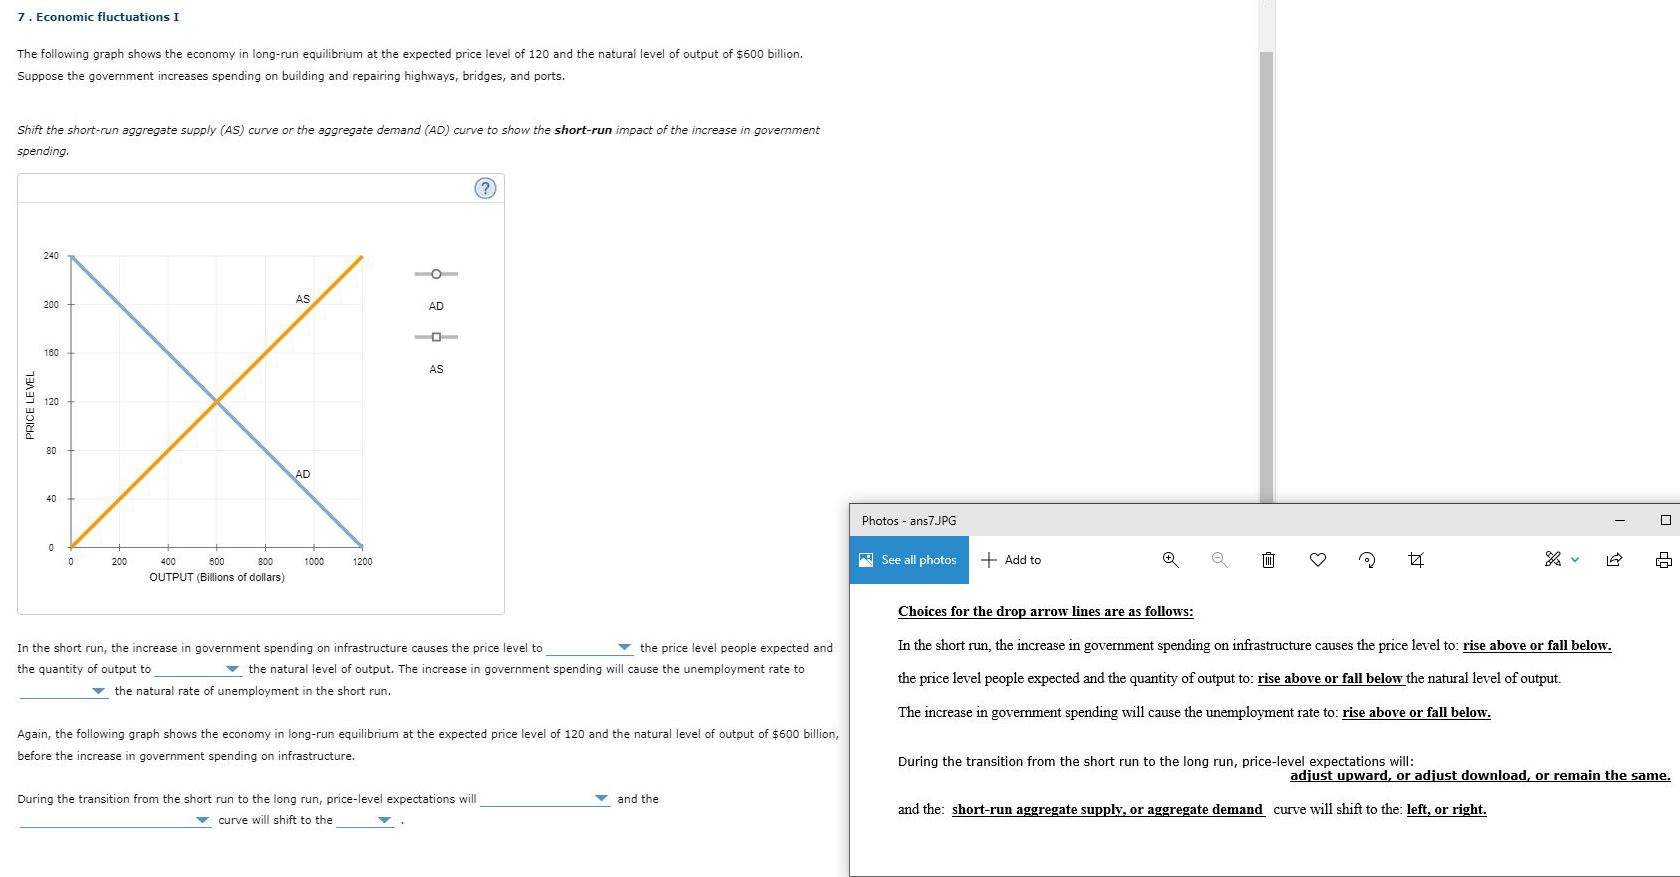
7 . Economic fluctuations I The following graph shmus the economy in long-run equilibrium at the expected price level of 120 and the natural level of tput of $600 billion. Suppose the government increases spending on building and repairing highways, bridges, and ports. Shift the shrt-run aggregate supply (AS) curve or the aggregate demard (AD) cuve to the short-run impact of the increase in government Photos - ans7JPG See all photos Choices for the drop arrow lines are as follows: G) OUTPUT (Billions of dollars) In the short run, the increase in gcwernment spending on infrastructure causes the price level to the price level people expected and the quantity of output to v the natural level of output. The increase in guernment spending will cause the unemployment rate to v the natural rate of unemployment in the short run. Again, the following graph shows the economy in long-run equilibrium at the expected price level of 120 and the natural level of Output of $600 billion, before the increase in government spending on infrastructure. During the transition from the shot run to the long run, price-level expectations will v curve will shift to the and the In the shon nm. the increase in government spending on infrastructure causes the price leiel to: rise above or fall below. the price level people expected and the quantity of output to: rise above or fall below the natural level of output The increase in government spendmg will cause the unemployment rate to: rise above or fall below. During the transition from the short run to the long run, price-level expectations will: adiust uoward. or adiust download. or remain the same. and the: short-run aggregate supply, or aggregate demand curve will shift to the: left. or right.
Step by Step Solution
There are 3 Steps involved in it

Get step-by-step solutions from verified subject matter experts