

Question: Hello, please help me with this I continue to get it incorrect. The following table shows some data for an economy that produces only two
Hello, please help me with this I continue to get it incorrect.

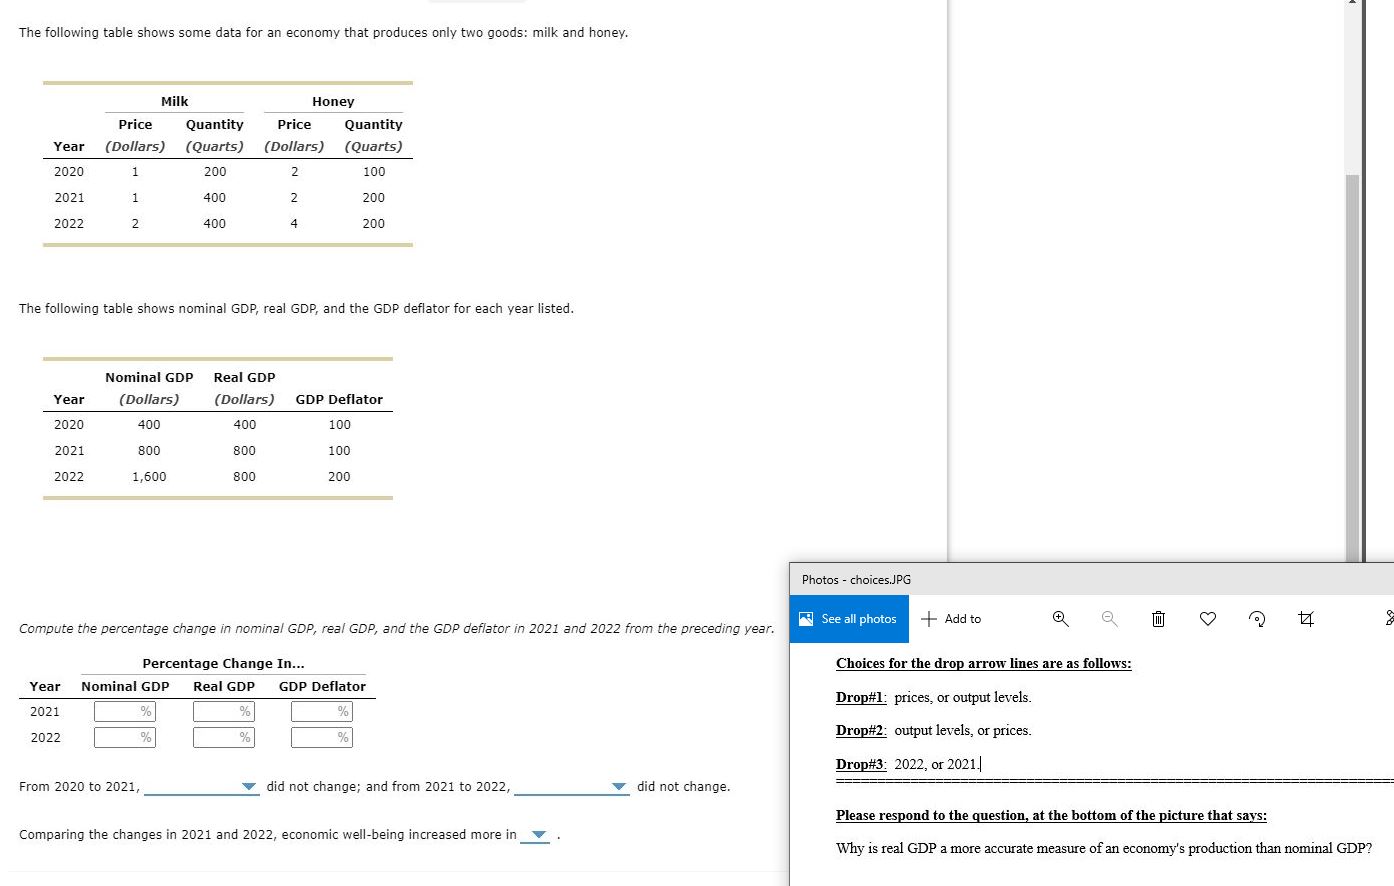
The following table shows some data for an economy that produces only two goods: milk and honey. Milk Price Quantity (Dollars) (Quarts) Honey Price Quantity (Dollars) (Quarts) Year 2020 2021 2022 4 200 200 The following table shows nominal GDP, real GDP, and the GDP deflator for each year listed. Year 2020 2021 2022 Nominal GDP (Do Ilars) 1,600 Real GDP (Dollars) 800 GDP Deflator 100 Photos - choices.JPG + Add to See all photos G) Compute the percentage change in nominal GDP, real GDP, and the GDP deflator in 2021 and 2022 from the preceding year. Percentage Change In... Year 2021 2022 Nominal GDP From 2020 to 2021, Real GDP GDP Deflator v did not change; and from 2021 to 2022, Comparing the changes in 2021 and 2022, economic well-being increased more in Choices for the drop arrow lines are as follows: prices, or output levels _ output levels, or prices _ 2022, or 20211 did not change. Please respond to the question, at the bottom of the picture that says : Why is real GDP a more accurate measure of an economy s production than nominal GDP?
Step by Step Solution
There are 3 Steps involved in it

Get step-by-step solutions from verified subject matter experts