

Question: Hello, please help!! Thanks! ONLY NEED HELP WITH C AND F PLEASE !!! MINE WAS INCORRECT. THANK YOU. The horsepower (Y, in bhp) of a
Hello, please help!! Thanks!
ONLY NEED HELP WITH C AND F PLEASE !!! MINE WAS INCORRECT. THANK YOU.
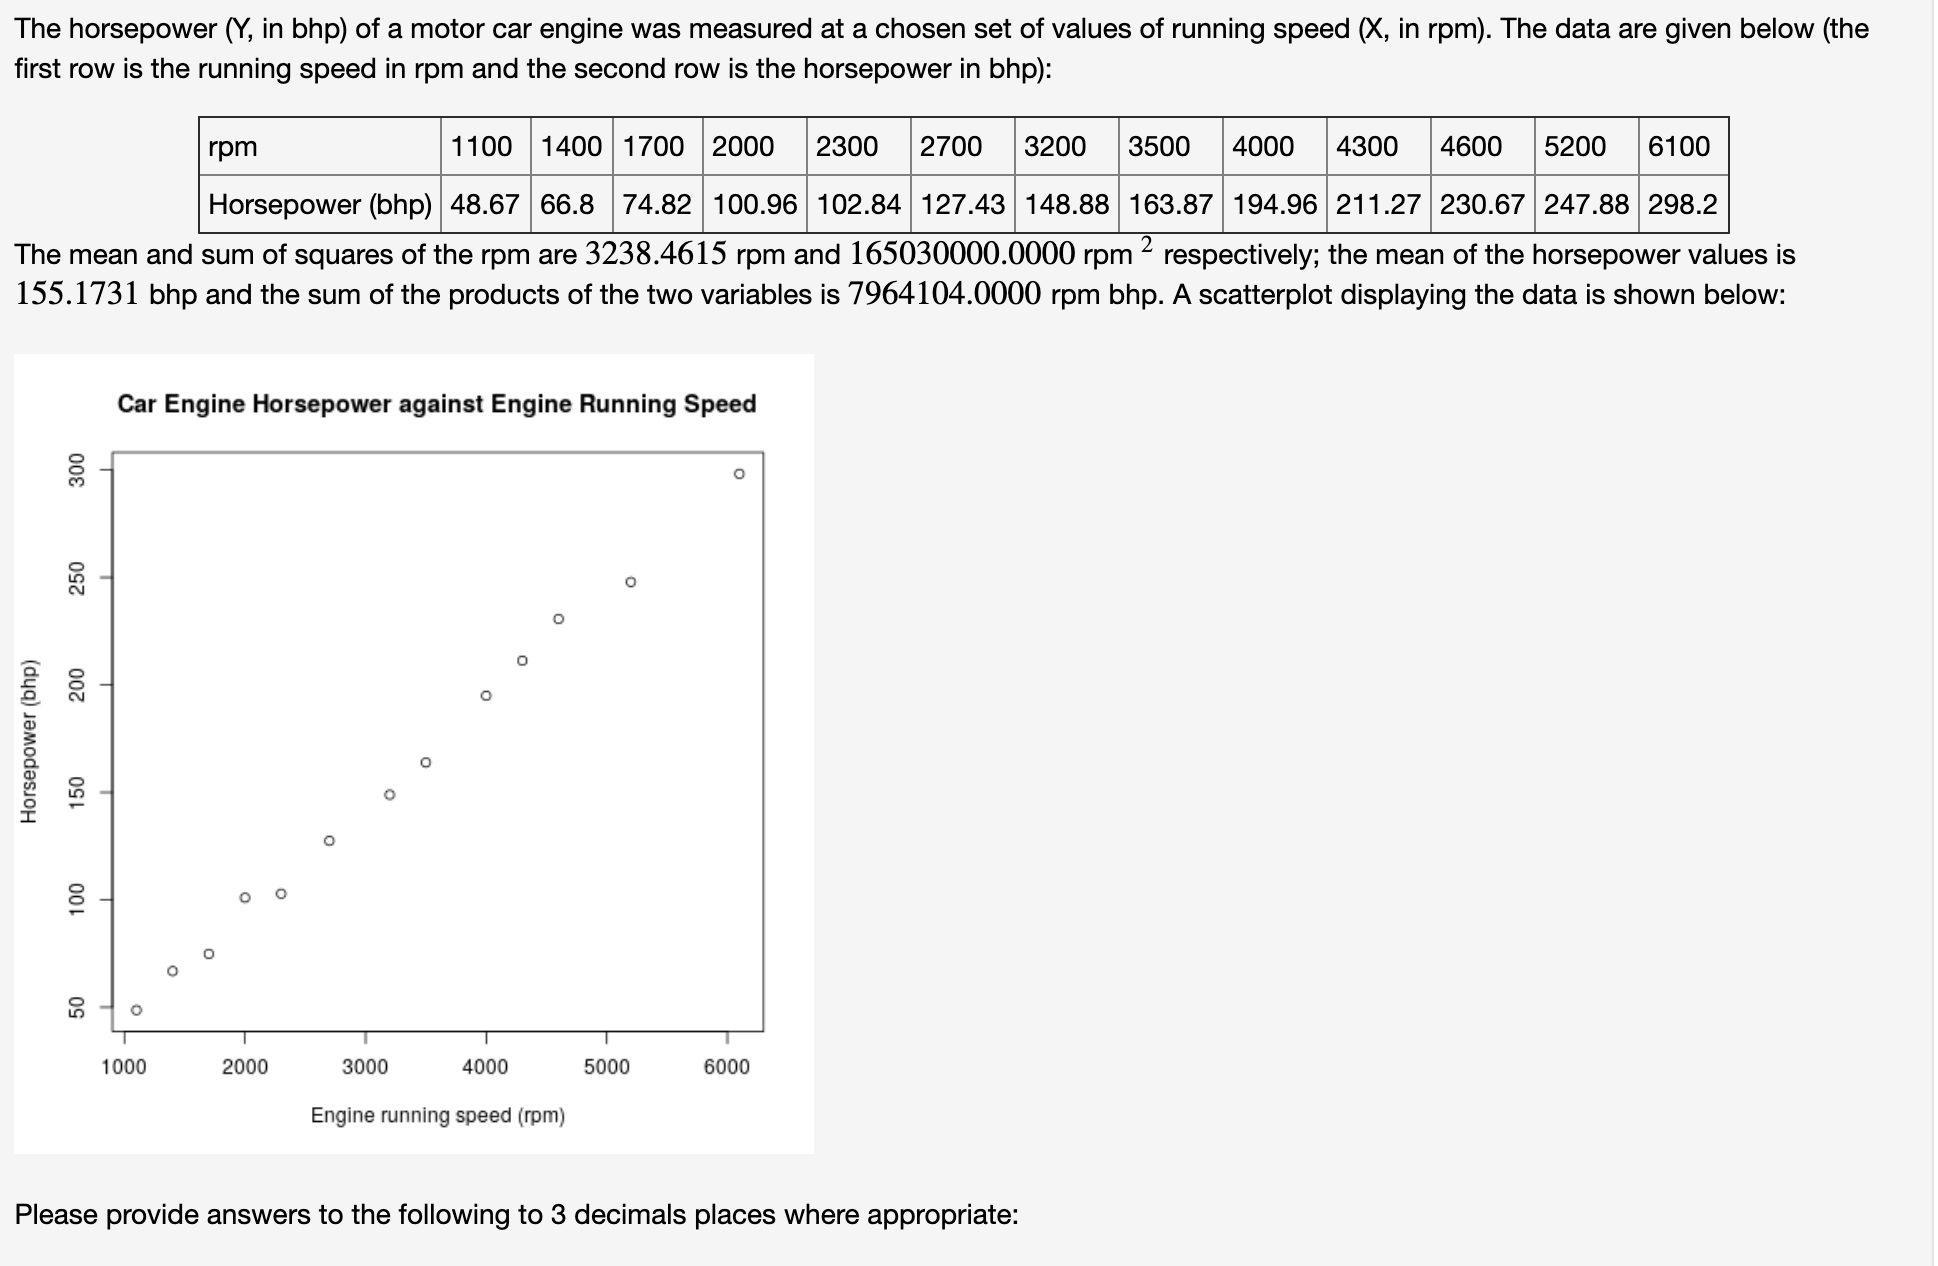
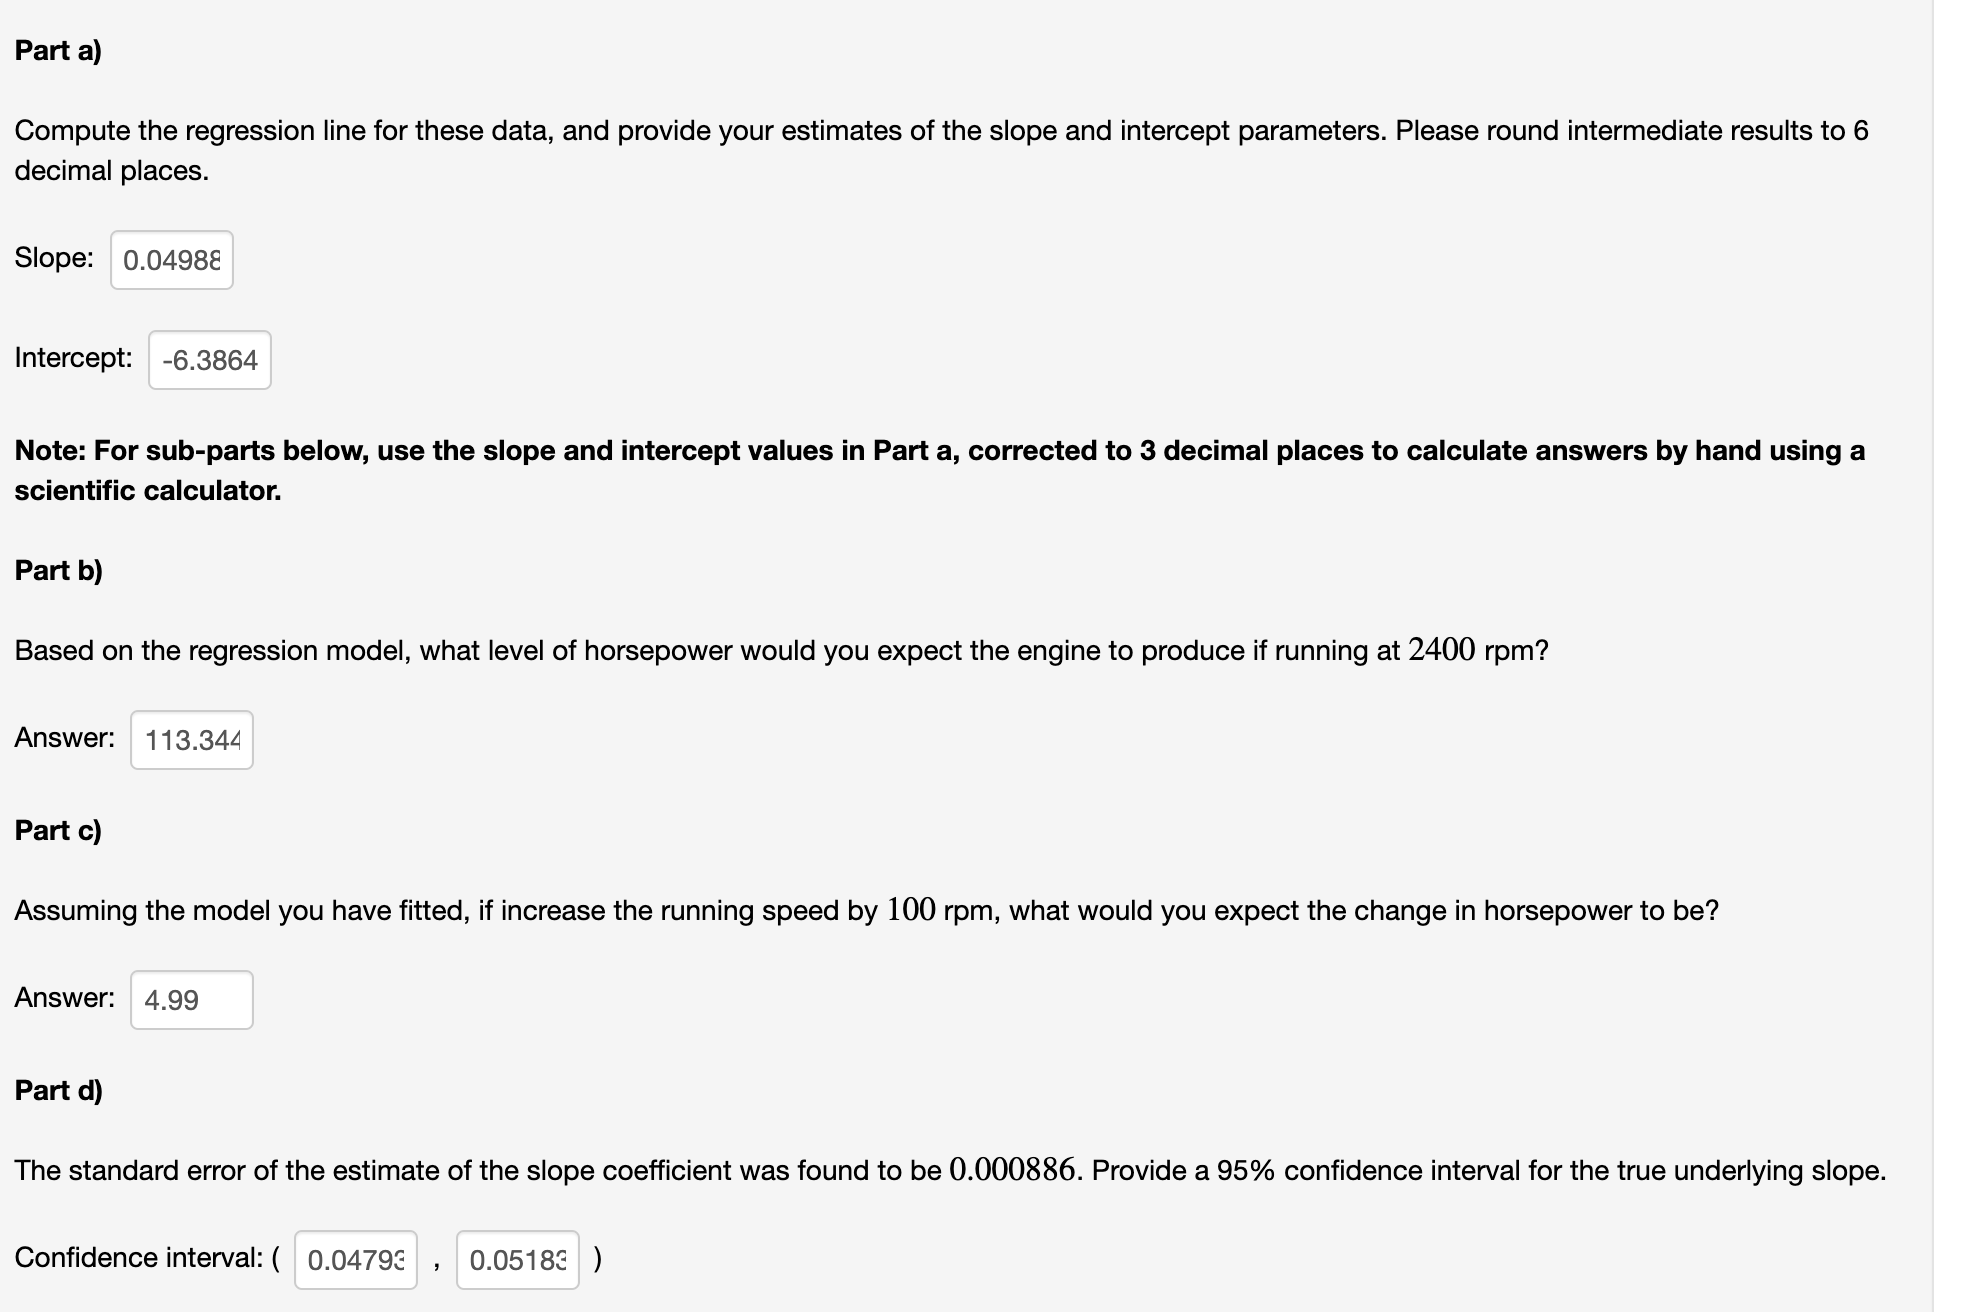
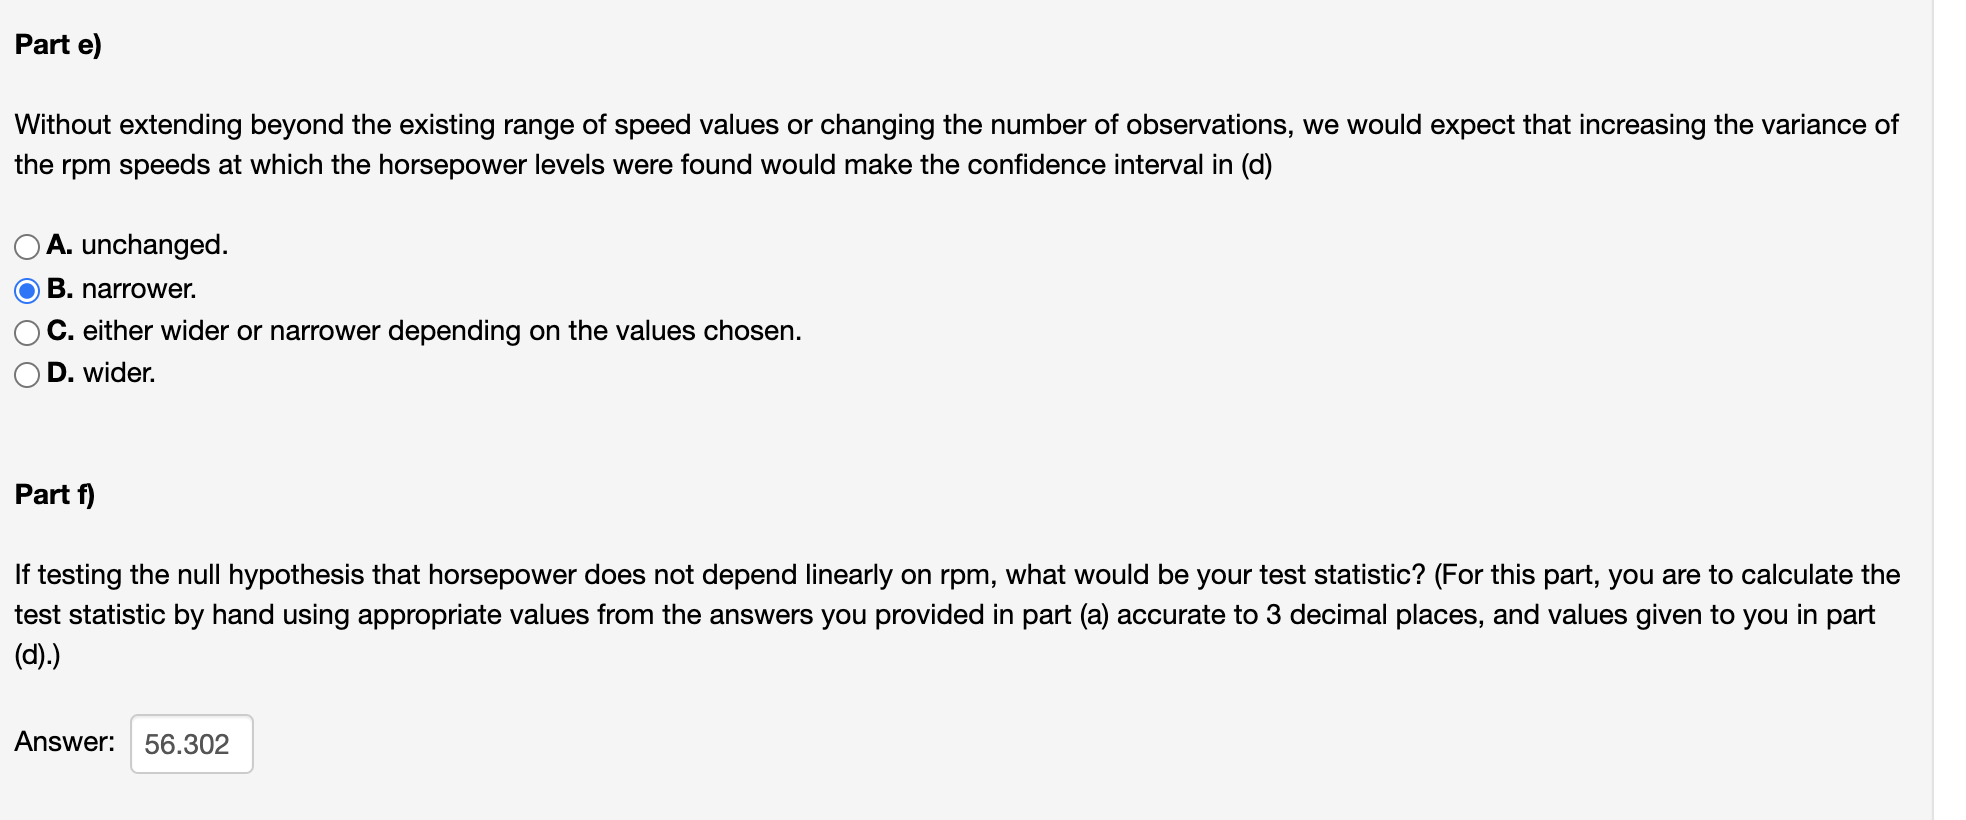
The horsepower (Y, in bhp) of a motor car engine was measured at a chosen set of values of running speed (X, in rpm). The data are given below (the first row is the running speed in rpm and the second row is the horsepower in bhp): rpm 1100 14001700 2000 2300 2700 3200 3500 4000 4300 4600 5200 6100 Horsepower (bhp) 48.67 66.8 74.82 100.96 102.84 127.43 148.88 163.87 194.96 211.27 230.67 247.88 298.2 The mean and sum of squares of the rpm are 32.38.4615 rpm and 1650300000000 rpm 2 respectively; the mean of the horsepower values is 155.1731 bhp and the sum of the products of the two variables is 79641040000 rpm bhp. A scatterplot displaying the data is shown below: Car Engine Horsepower against Engine Running Speed Horsepower (bhp) 1 50 200 250 300 100 50 1 000 2000 3000 4000 5000 6000 Engine running speed (rpm) Please provide answers to the following to 3 decimals places where appropriate: Part a) Compute the regression line for these data, and provide your estimates of the slope and intercept parameters. Please round intermediate results to 6 decimal places. SIOpe: 0.04988 Intercept: -6.3864 Note: For sub-parts below, use the slope and intercept values in Part a. corrected to 3 decimal places to calculate answers by hand using a scientific calculator. Part b) Based on the regression model, what level of horsepower would you expect the engine to produce if running at 2400 rpm? Answer: 113.344 Part c) Assuming the model you have fitted, if increase the running speed by 100 rpm, what would you expect the change in horsepower to be? Answer: 499 Part d) The standard error of the estimate of the slope coefficient was found to be 0.000886. Provide a 95% confidence interval for the true underlying slope. Confidence interval:( 0.04792 , 0.05185 ) Part e) Without extending beyond the existing range of speed values or changing the number of observations, we would expect that increasing the variance of the rpm speeds at which the horsepower levels were found would make the confidence interval in (d) 0A. unchanged. (9 B. narrower. O 0. either wider or narrower depending on the values chosen. 0 D. wider. Part 1) If testing the null hypothesis that horsepower does not depend linearly on rpm, what would be your test statistic? (For this part, you are to calculate the test statistic by hand using appropriate values from the answers you provided in part (a) accurate to 3 decimal places. and values given to you in part (d)-) Answer: 56.302
Step by Step Solution
There are 3 Steps involved in it

Get step-by-step solutions from verified subject matter experts