

Question: Hello, Please help with this problem using below income and balance sheets. 1) Compute the cash conversion cycle for Costco and Walmart for each of
Hello,
Please help with this problem using below income and balance sheets.
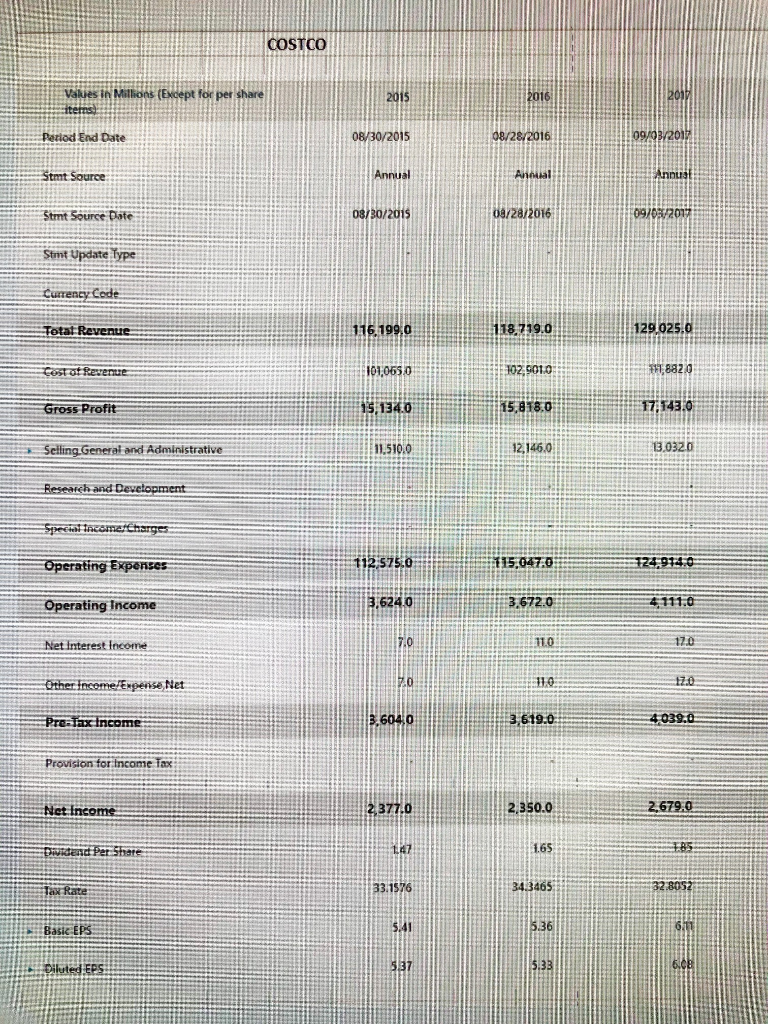
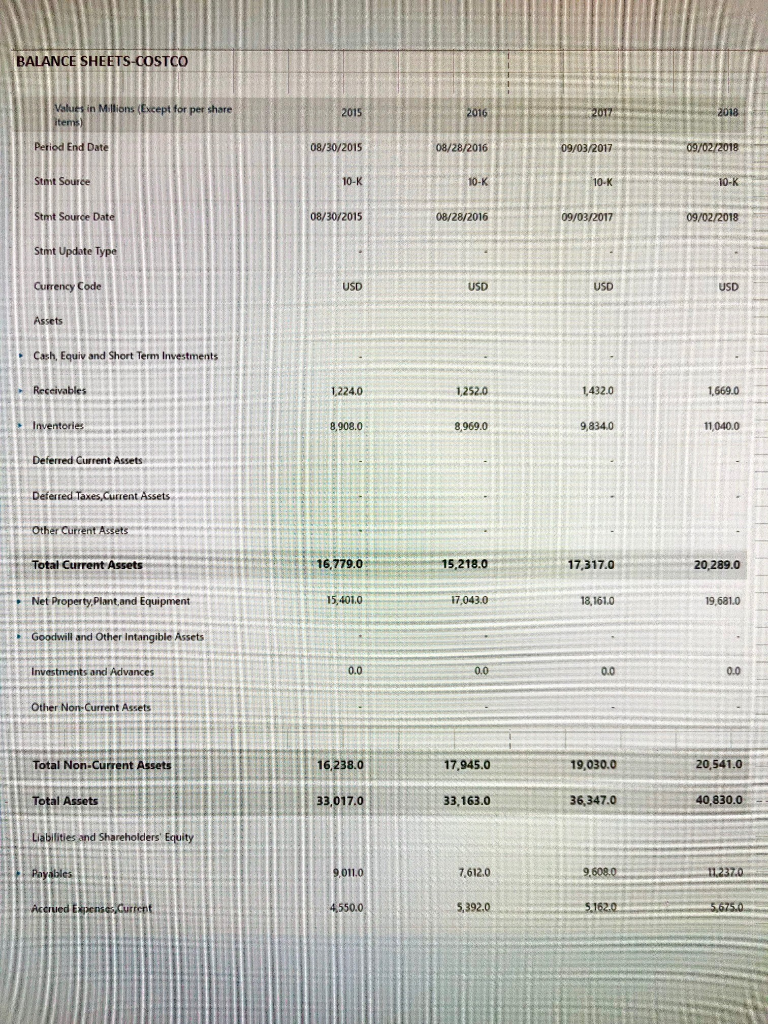
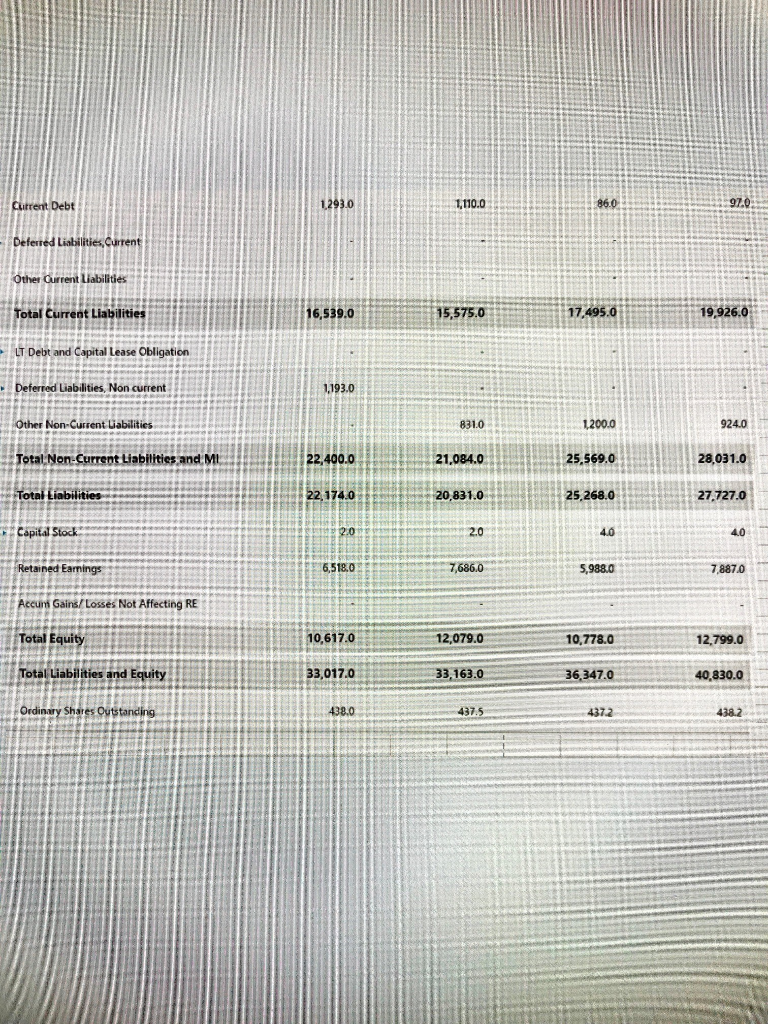
1) Compute the cash conversion cycle for Costco and Walmart for each of the last 4 years.
1a) Compute the inventory days using "Cost of Revenue" as cost of goods sold and a 365-day year
1b) Compute the accounts receivable days using a 365-day year
1c) Compute the cash conversion cycle for each year
2) How has Walmart's CCC changed over the last few years?
COSTCO
WALMART
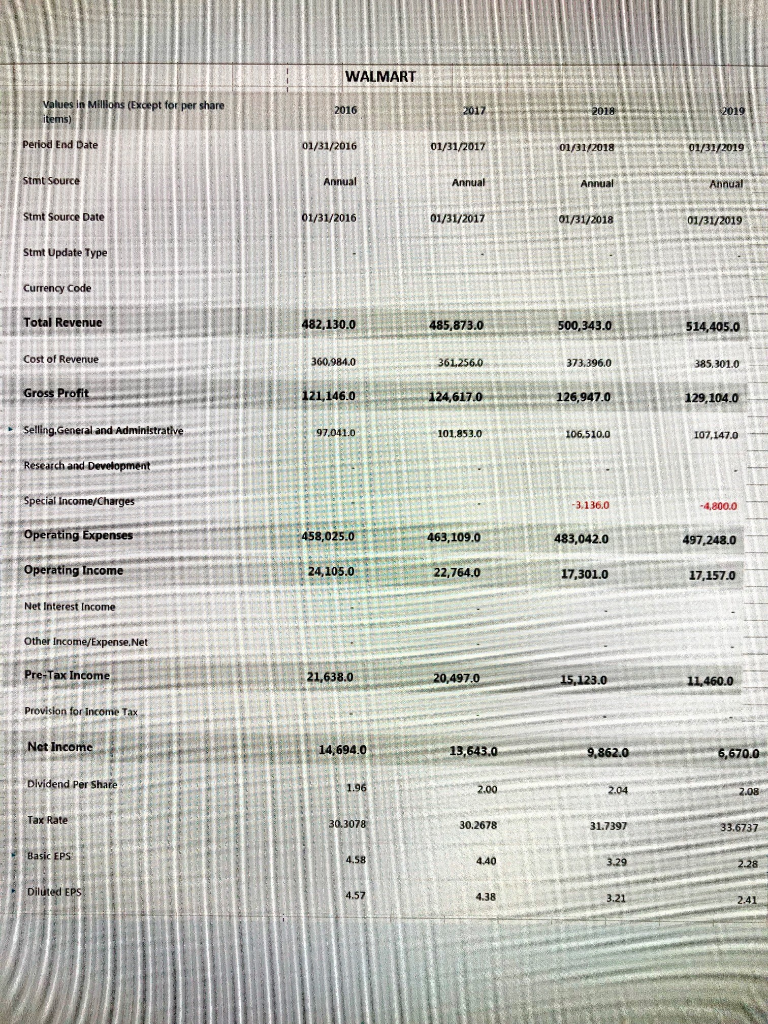
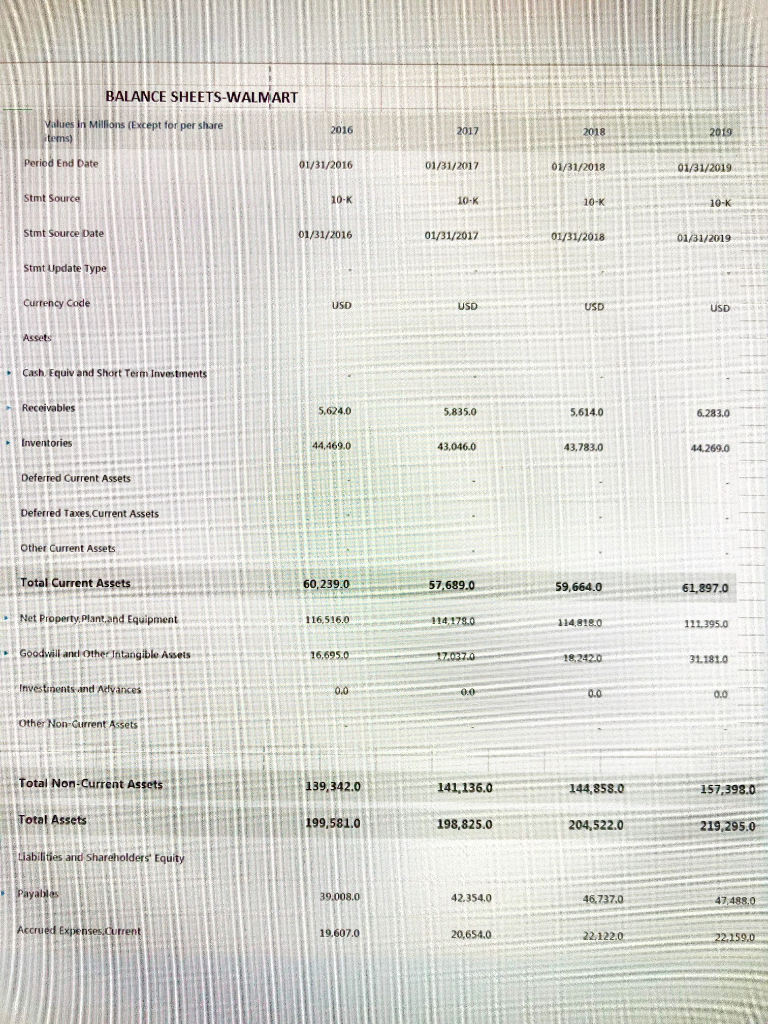
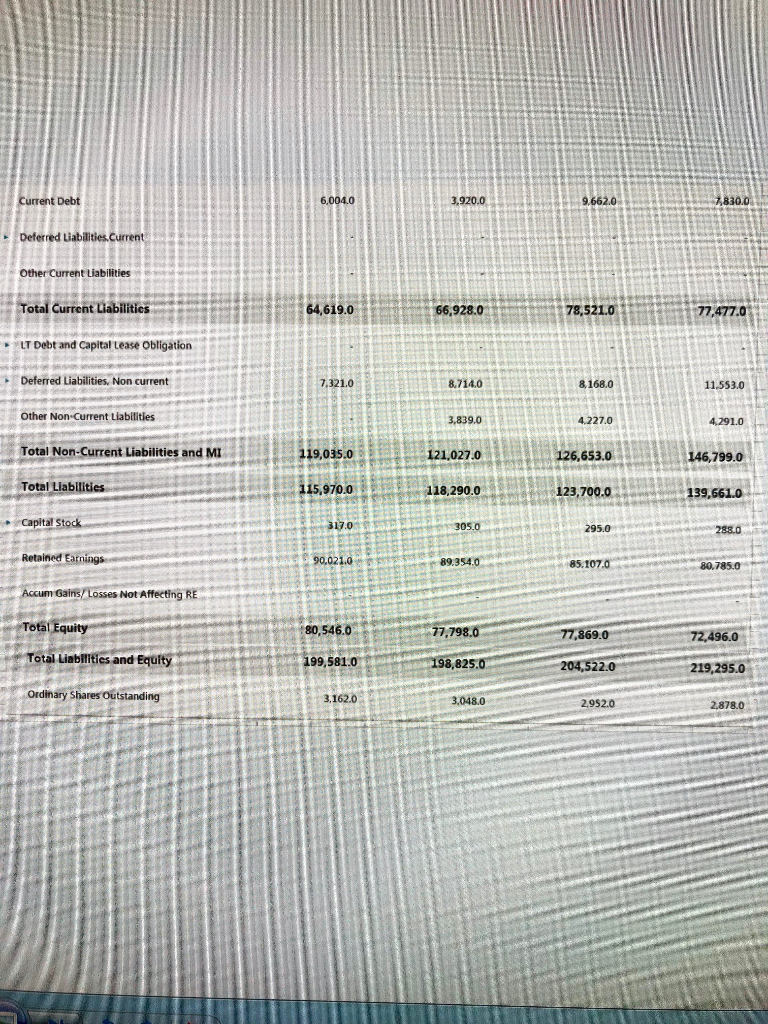
COSTCO 2016 201 Values in Millions (Except for per share 2015 08/28/2016 Pariod End Date 08/30/2015 4020/60 Anal Annust Stmt Source Annual 09/05/2017 08/28/2016 08/30/2015 Stmt Source Date Stint Update Type Currency Code 129 025.0 116 199,0 Total Revenue 118.719.0 1 8820 102 9010 Cost ot Revenue 1010650 15,818.0 17,143.0 Gross Profit 15,134.0 11.510.0 13.0320 12,146.0 Selling General and Administrative Research and Development Special tncemetCharges 124 914 0 112,575.0 115.047.0 Operating Expenses 3,624.0 4111.0 3,672.0 Operating Income 70 11.0 17.0 Net Interest Ineome 17.0 110 Other IncomeEwpense Net 4.039.0 3.604 0 3,619.0 Pre-Tax Income Provision for income Tax 2679.0 2377.0 2350.0 Net Income T85 47 Widend Per Share 165 32 8052 34.3465 33.1576 Tax Rate 5.36 611 541 Basic EPS 537 5.33 6.CB Diluted EPS BALANCE SHEETS-COSTCO Values in Millions (Exicept for per share items 2017 2015 2018 2016 Petiod End Date 08/28/2016 09/02/2018 08/30/2015 09/03/2017 Stmt Source 10-K 10-K 10-K 10-K Stmt Source Date 08/30/2015 09/03/2017 08/28/2016 09/02/2018 Stmt Update Type Curency Code USD USD USD USD Assets Cash, Equiv and Short Term Investments Receivables 1252.0 1432.0 1,669.0 1,224.0 Inventories 9,834.0 8,908.0 8,969.0 11.040.0 Deferred Current Assets Deferred Taxes,Current Assets Other Current Assets Total Current Assets 16,779.0 15,218.0 17,317.0 20,289.0 15,401.0 Net Property Plant,and Equipment 17,043.0 18,161.0 19,681.0 Goodwill and Other intangible Assets 0.0 0.0 0.0 0.0 Investments and Advances Other Non-Current Assets Total Non-Current Assets 16,238.0 17,945.0 19,030.0 20,541.0 33,017.0 36,347.0 40,830.0 Total Assets 33,163.0 Liabifities and Shareholders Equity 9.011.0 11237.0 7,612.0 9,608.0 Payables 5.675.0 Accrued Expense Current 4550.0 5,392.0 5162.0 97.0 1293.0 Current Debt 1,110.0 86.0 Deferred Liabilities,Curent Other Current Liabilities 17,495.0 19,926.0 16,539.0 Total Current Liabilities 15,575.0 LT Debt and Capital Lease Obligation Deferred Liabilities, Non current 1,193.0 Other Non-Cursent iabilities 831.0 1,200.0 924.0 Total Non-Current Liabilities and M 22,400.0 25,569.0 28,031.0 21,084.0 Total Liabilities 22,174.0 25,268.0 27,727.0 20,831.0 Capital Stock 20 40 2.0 40 Retained Earnings 6,518.0 7,686.0 5,988.0 7,887.0 Accuni Gains/ Losses Not Affecting RE Total Equity 10,617.0 12,079.0 10,778.0 12,799.0 Total Liabilities and Equity 33,017.0 33,163.0 36,347.0 40,830.0 Ordinary Shares Outstanding 438.0 437.5 4372 438.2 WALMART Values in Millions (Except for per share items) 2017 2018 2019 2016 Period End Date 01/31/2016 01/31/2017 01/31/2018 01/31/2019 stmt Source Annual Annual Annual Annual 01/31/2016 Stmt Source Date 01/31/2017 01/31/2018 01/31/2019 Stmt Update Type Currency Code Total Revenue 482,130.0 485,873.0 500,343.0 514,405.0 Cost of Revenue 360,984.0 361,256.0 373.396.0 385,301.0 Gross Profit 121,146.0 124,617.0 126,947.0 129,104.0 Selling.General and Administratve 97,041.0 101.853.0 106.510.0 107,147.0 Research and Development Special Income/Charges 3.136.0 4.800.0 Operating Expenses 458,025.0 463,109.0 483,042.0 497,248.0 Operating Income 24,105.0 22,764.0 17,301.0 17,157.0 Net Interest Income Other Income/Expense.Net Pre-Tax Income 21,638.0 20,497.0 15,123.0 11,460.0 Provision for Income Tax Net Income 14,694.0 13,643.0 9,862.0 6.670.0 Dividend Per Share 1.96 208- 2.00 2.04 Tax Rate 30.3078 30.2678 31.7397 33.6737 Basic EPS 4.58 4.40 3.29 2.28 Diluted EPS 4.57 4.38 3.21 241 BALANCE SHEETS-WALMART Values in Milions (Except for per share tems) 2016 2017 2018 2019 Period End Date 01/31/2016 01/31/2017 01/31/2018 01/31/2019 Stmt Source 10-K 10-K 10-K 10-K Stmt Source Date 01/31/2016 01/31/2017 01/31/2018 01/31/2019 Stmt Update Type Curtehcy Code USD USD USD USD Assets Cash Equiv and Short Term Investments Receivables 5,624.0 5,835.0 5,614.0 6.283.0 Inventories 44,469.0 43,046.0 44.269.0 43.783.0 Deferred Current Assets Deferred Taxes,Current Assets Other Current Assets Total Current Assets 60,239.0 57,689.0 59,664.0 61,897.0 Net Property Plant and Equipment 116.516.0 14178.0 114,818.0 111,395.0 Goodwill and Other Intangible Assets 17.037.0 16.695.0 182420 31.181.0 Investinents and Adyances 0.0 00 0.0 0.0 Other Non-Current Assets Total Non-Current Assets 139,342.0 157,398.0 141,136.0 144,858.0 Total Assets 199,581.0 219,295.0 198,825.0 204,522.0 uabilities and Shareholders Equity Payables 39.008.0 42.354.0 46.737.0 47,488.0 Accrued Expenses,current 19.607.0 22.159.0 20,654.0 22.122.0 Current Debt 6.004.0 3,920.0 9.662.0 830.0 Deferred Liabilities.Current Other Curreht tiabilities Total Current Liabilitics 64,619.0 78,521.0 77,477.0 66,928.0 LT Debt and Capital Lease Obligation Deferred Liabilities, Non current 8,714.0 7,321.0 8,168.0 11,553.0 Other Non Current Liabilitles 3,839.0 4.227.0 4,291.0 Total Non-Current Liabilities and MI 119,035.0 121,027.0 126,653.0 146,799.0 Total Liabilities 115,970.0 139,661.0 118,290.0 123,700.0 Capital Stock 317.0 305.0 295.0 288.0 Retained Earnings 90,021.0 89.354.0 85.107.0 80,785.0 Accum Gains/Losses Not Affecting RE Total Equity 80,546.0 77,798.0 77,869.0 72,496.0 Total Liabilities and Equity 199,581.0 198,825.0 204,522.0 219,295.0 Ordinary Shares Outstanding 3.162.0 3,048.0 2,952.0 2,878.0
Step by Step Solution
There are 3 Steps involved in it

Get step-by-step solutions from verified subject matter experts