

Question: Hello, please see attached. I cannot figure out how those percentages were calculated. Please show. I know how to find the ratios. Just show the
Hello, please see attached. I cannot figure out how those percentages were calculated. Please show. I know how to find the ratios. Just show the calculation for percentages in the green circle. Thank you.
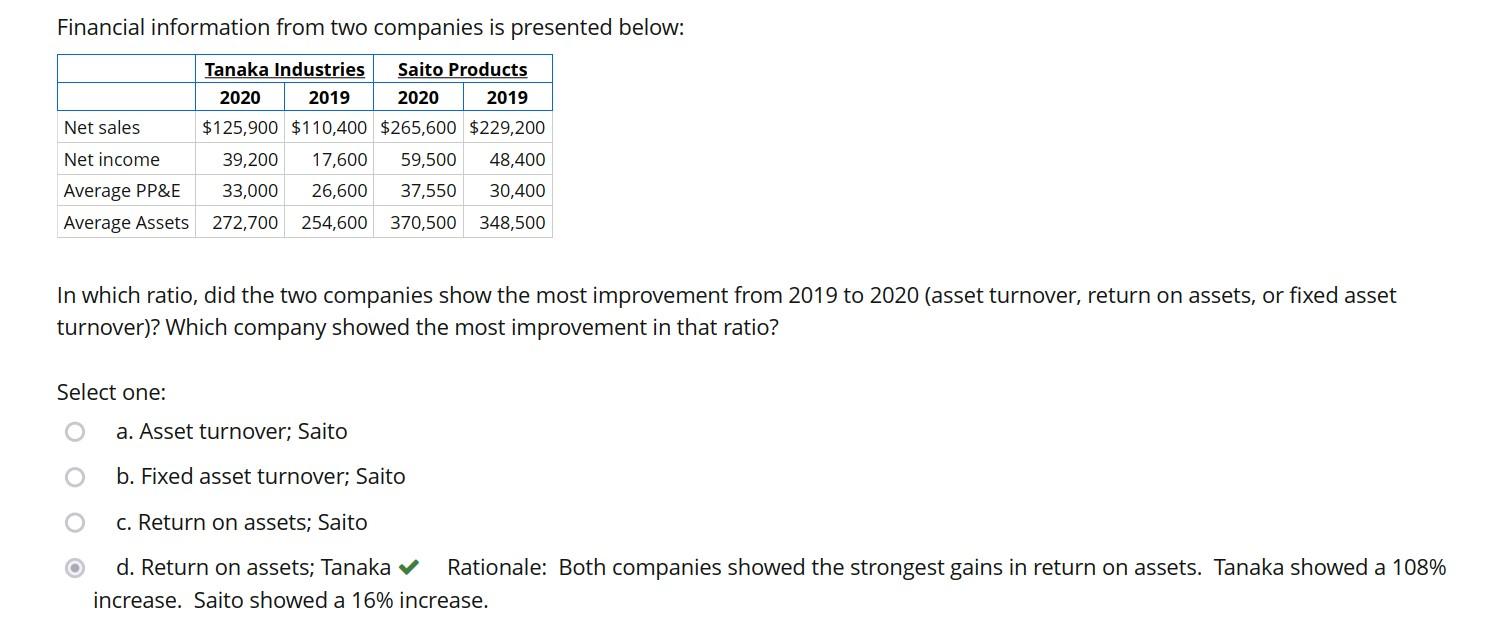
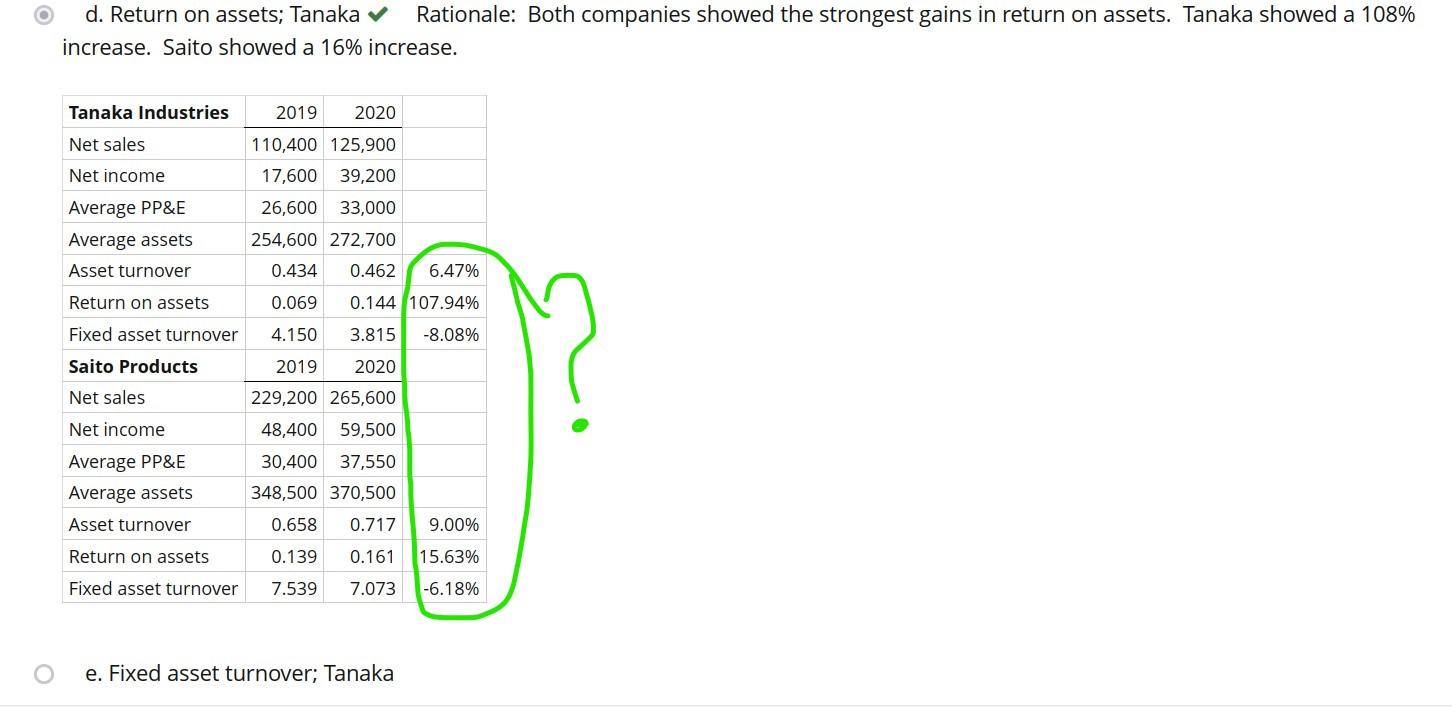
Financial information from two companies is presented below: In which ratio, did the two companies show the most improvement from 2019 to 2020 (asset turnover, return on assets, or fixed asset turnover)? Which company showed the most improvement in that ratio? Select one: a. Asset turnover; Saito b. Fixed asset turnover; Saito c. Return on assets; Saito d. Return on assets; Tanaka Rationale: Both companies showed the strongest gains in return on assets. Tanaka showed a 108\% increase. Saito showed a 16% increase. d. Return on assets; Tanaka Rationale: Both companies showed the strongest gains in return on assets. Tanaka showed a 108% increase. Saito showed a 16% increase. e. Fixed asset turnover; Tanaka
Step by Step Solution
There are 3 Steps involved in it

Get step-by-step solutions from verified subject matter experts