

Question: Hello, Please write the code in R and post the code. The data is in https://www.stat.uw.edu/marzban/390/summer18/hw_lect3_dat.txt or you can access it in R, using data=read.table(https://www.stat.uw.edu/marzban/390/summer18/
Hello,
Please write the code in R and post the code.
The data is in https://www.stat.uw.edu/marzban/390/summer18/hw_lect3_dat.txt
or you can access it in R, using
data=read.table("https://www.stat.uw.edu/marzban/390/summer18/hw_lect3_dat.txt",header=F)
Thanks.
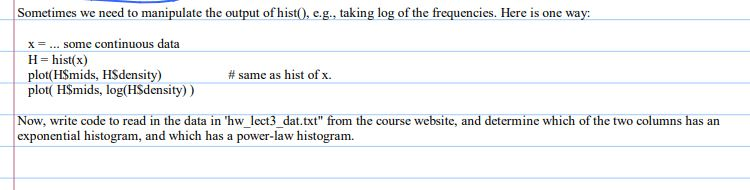
Sometimes we need to manipulate the output of hist0, e.g., taking log of the frequencies. Here is one way: X. some continuous data H = hist(x) plot(HSmids, HSdensity) # same as hist of x plot HSmids, log(HSdensity)) Now, write code to read in the data in 'hw lect3 dat.txt" from the course website, and determine which of the two columns has an exponential histogram, and which has a power-law histogram
Step by Step Solution
There are 3 Steps involved in it

Get step-by-step solutions from verified subject matter experts