

Question: hello plese help me solivinng this problem using minitab and show me all steps on mintitab f6.5.1 WP In their book Time Series Analysis, Forecasting,
hello plese help me solivinng this problem using minitab and show me all steps on mintitab
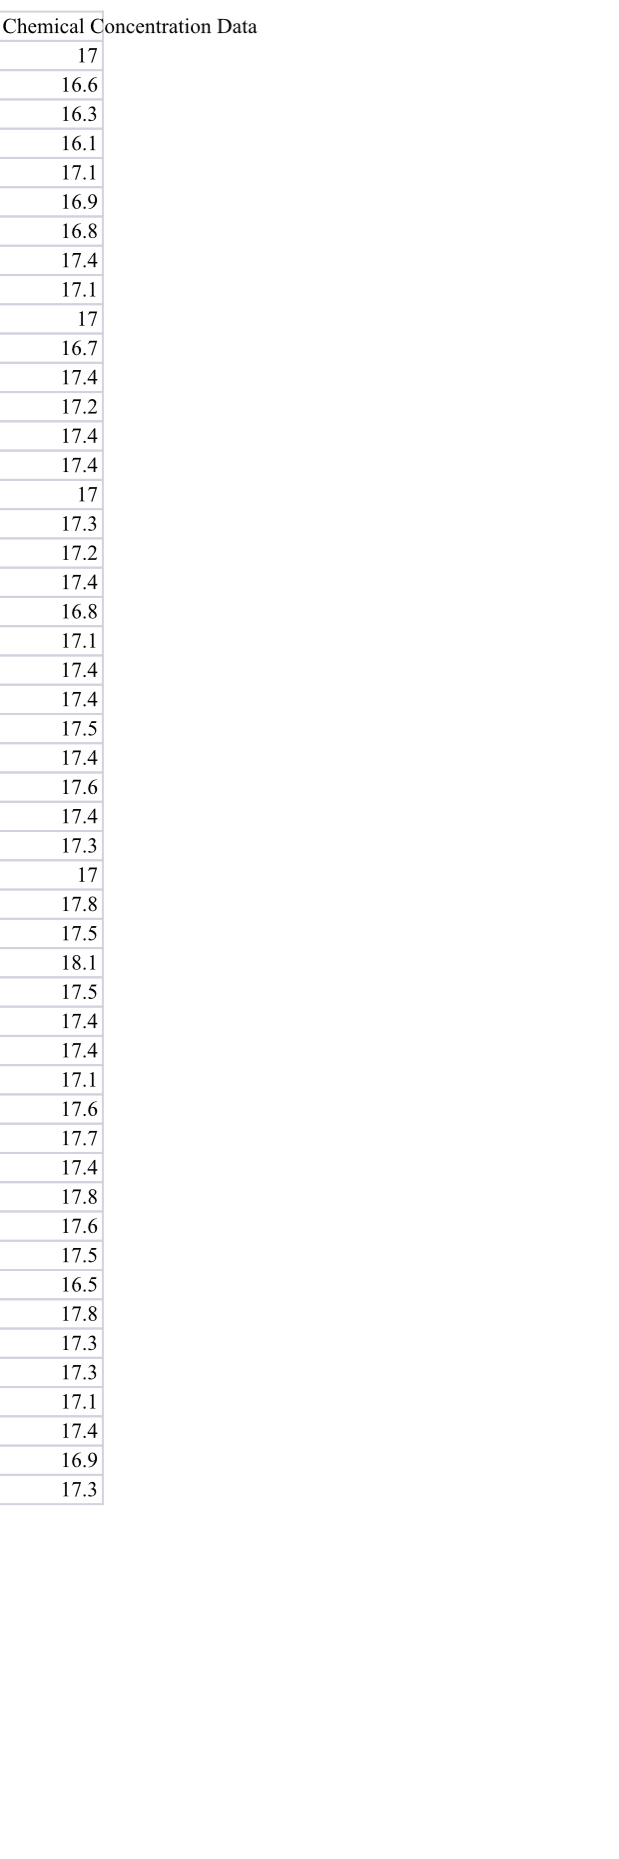
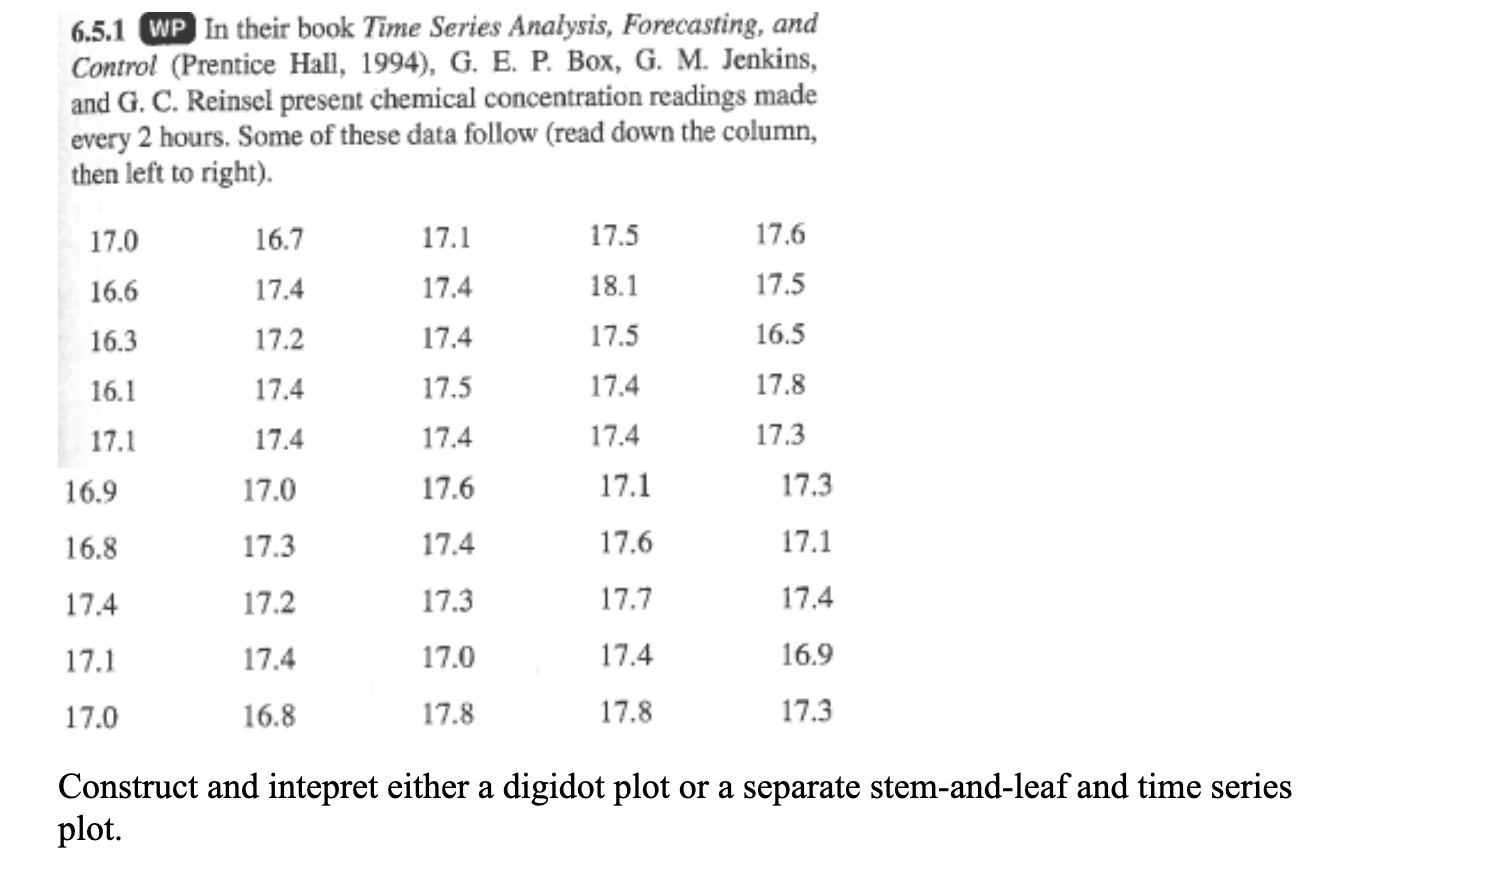
\f6.5.1 WP In their book Time Series Analysis, Forecasting, and Control (Prentice Hall, 1994), G. E. P. Box, G. M. Jenkins, and G. C. Reinsel present chemical concentration readings made every 2 hours. Some of these data follow (read down the column, then left to right). 17.0 16.7 17.1 17.5 17.6 16.6 17.4 17.4 18.1 17.5 16.3 17.2 17.4 17.5 16.5 16.1 17.4 17.5 17.4 17.8 17.1 17.4 17.4 17.4 17.3 16.9 17.0 17.6 17.1 17.3 16.8 17.3 17.4 17.6 17.1 17.4 17.2 17.3 17.7 17.4 17.1 17.4 17.0 17.4 16.9 17.0 16.8 17.8 17.8 17.3 Construct and intepret either a digidot plot or a separate stem-and-leaf and time series plot
Step by Step Solution
There are 3 Steps involved in it

Get step-by-step solutions from verified subject matter experts