

Question: Hello, the answer is given in red, but please give step by step explanation, please dont just repeat answer, eg explain the formula used, if
Hello, the answer is given in red, but please give step by step explanation, please dont just repeat answer, eg explain the formula used, if diagrams helps you to explain, please do use it, thank you!
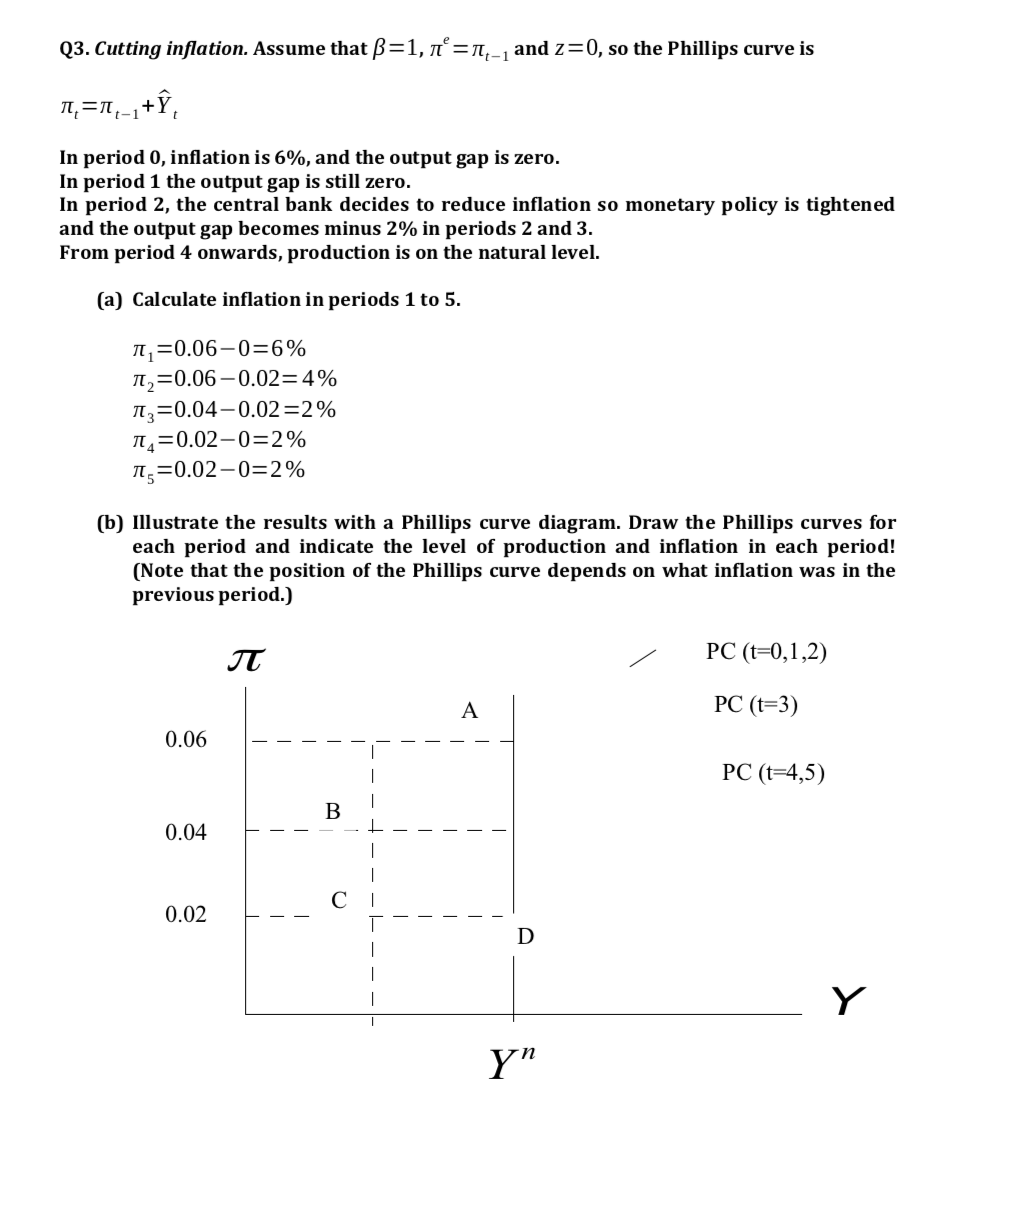
Q3. Cutting inflation. Assume that B=1, n'=1,-, and z=0, so the Phillips curve is In period 0, inflation is 6%, and the output gap is zero. In period 1 the output gap is still zero. In period 2, the central bank decides to reduce inflation so monetary policy is tightened and the output gap becomes minus 2% in periods 2 and 3. From period 4 onwards, production is on the natural level. (a) Calculate inflation in periods 1 to 5. It =0.06-0=6% It,=0.06-0.02=4% 73=0.04-0.02=2% TA =0.02-0=2% II =0.02-0=2% (b) Illustrate the results with a Phillips curve diagram. Draw the Phillips curves for each period and indicate the level of production and inflation in each period! (Note that the position of the Phillips curve depends on what inflation was in the previous period.) PC (t=0, 1,2) A PC (t=3) 0.06 - PC (t=4,5) B 0.04 C 1 - 0.02 D Y yn
Step by Step Solution
There are 3 Steps involved in it

Get step-by-step solutions from verified subject matter experts