

Question: Hello, the below figures are captured from lecture slides. In figure 2, it shows that with negative residual income(RI) seems to have greater required rate
Hello, the below figures are captured from lecture slides. In figure 2, it shows that with negative residual income(RI) seems to have greater required rate of return to compensate the risk.
As in Fig 1,
g_term=sales revenue growth rate in terminal period; r_term= risk for terminal period; TCF= total cash flow; FCF= free cash flow.
In the first case, for stable growth of a firm (as shown in the slide), the denominator is r_term minus g_term.
May I know, if for the stable growth firm, is it a must case for TCF>0 ?
Also, what would be the meaning of r_term minus g_term, what would be the relations between r_term and g_term?
If I assume for stable growth firm, TCF>0 , then r_term should be greater than g_term. However, in Fig 2, it shows that highly leveraged firm has higher required rate of return, how could this equation reflects stable growth of the company? Also, why would r_term greater than g_term if my assumption is true to be the case.
Also, the final equation calculating V, the value of the company, may I know how the equation works? What is the meaning of FCF_t * 1(1+r)^t, why do we need to times 1/(1+r)^t ?
Thank you!!!!!!
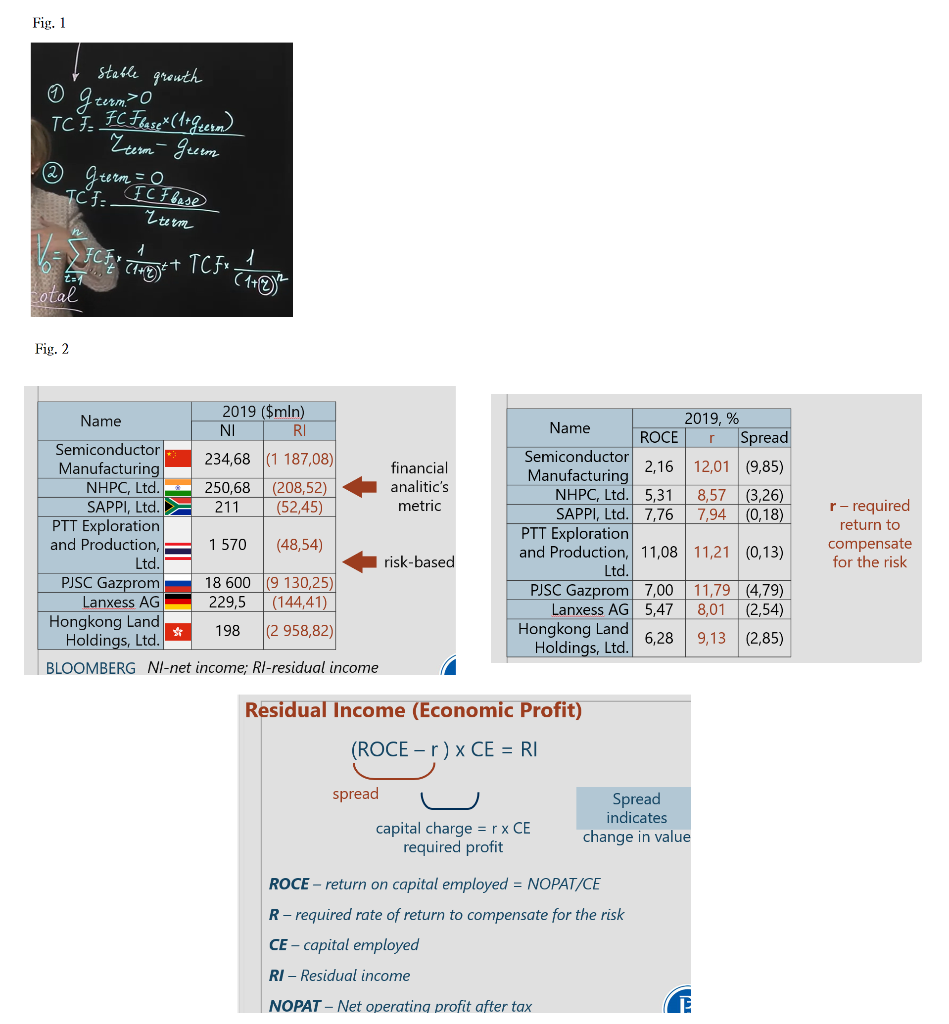
Fig. 1 stable growth I term? TCH: FC Fbase*(1+geern) Zerm Green = ICF: gterm ICF base Eterm Ir tient TCHu l (1+0) total Fig. 2 2019 ($mln) Name NI RI Semiconductor Manufacturing 234,68 (1 187,08) financial NHPC, Ltd. 250,68 (208,52) analitic's SAPPI, Ltd. 211 (52,45) metric PTT Exploration and Production, 1 570 (48,54) Ltd. risk-based PJSC Gazprom 18 600 (9 130,25) Lanxess AG 229,5 (144,41) Hongkong Land 198 (2 958,82) Holdings, Ltd. BLOOMBERG NI-net income; R/-residual income 2019, % Name ROCE Spread Semiconductor 2,16 12,01 (9,85) Manufacturing NHPC, Ltd. 5,31 8,57 (3,26) SAPPI, Ltd. 7,76 7,94 (0,18) PTT Exploration and Production, 11,08 11,21 (0,13) Ltd. PJSC Gazprom 7,00 11,79 (4,79) Lanxess AG 5,47 8,01 (2,54) Hongkong Land 6,28 9,13 (2,85) Holdings, Ltd. r-required return to compensate for the risk Residual Income (Economic Profit) (ROCE - r) x CE = RI spread capital charge = r x CE required profit Spread indicates change in value ROCE - return on capital employed = NOPAT/CE R-required rate of return to compensate for the risk CE - capital employed RI - Residual income NOPAT - Net operating profit after tax Fig. 1 stable growth I term? TCH: FC Fbase*(1+geern) Zerm Green = ICF: gterm ICF base Eterm Ir tient TCHu l (1+0) total Fig. 2 2019 ($mln) Name NI RI Semiconductor Manufacturing 234,68 (1 187,08) financial NHPC, Ltd. 250,68 (208,52) analitic's SAPPI, Ltd. 211 (52,45) metric PTT Exploration and Production, 1 570 (48,54) Ltd. risk-based PJSC Gazprom 18 600 (9 130,25) Lanxess AG 229,5 (144,41) Hongkong Land 198 (2 958,82) Holdings, Ltd. BLOOMBERG NI-net income; R/-residual income 2019, % Name ROCE Spread Semiconductor 2,16 12,01 (9,85) Manufacturing NHPC, Ltd. 5,31 8,57 (3,26) SAPPI, Ltd. 7,76 7,94 (0,18) PTT Exploration and Production, 11,08 11,21 (0,13) Ltd. PJSC Gazprom 7,00 11,79 (4,79) Lanxess AG 5,47 8,01 (2,54) Hongkong Land 6,28 9,13 (2,85) Holdings, Ltd. r-required return to compensate for the risk Residual Income (Economic Profit) (ROCE - r) x CE = RI spread capital charge = r x CE required profit Spread indicates change in value ROCE - return on capital employed = NOPAT/CE R-required rate of return to compensate for the risk CE - capital employed RI - Residual income NOPAT - Net operating profit after tax
Step by Step Solution
There are 3 Steps involved in it

Get step-by-step solutions from verified subject matter experts