

Question: Hello, the grey circle(K34) here has a cell value equals to the one of the red circle (K32), and the display show the formula of
Hello, the grey circle(K34) here has a cell value equals to the one of the red circle (K32), and the display show the formula of cell K32.
May I know what is the meaning of the formula, is there any equation for it? Why is it the calculation of covariance (grey circle ,cell K34) is using that formula?
As I know, equation of covariance : C o v ( X , Y ) = ( X i X ) ( Y i Y ) n , and there should be average of values x and y. But here there isn't any average values given in this set of data, how could covariance be calculated in the way expressed in the excel worksheet?
Thank you.
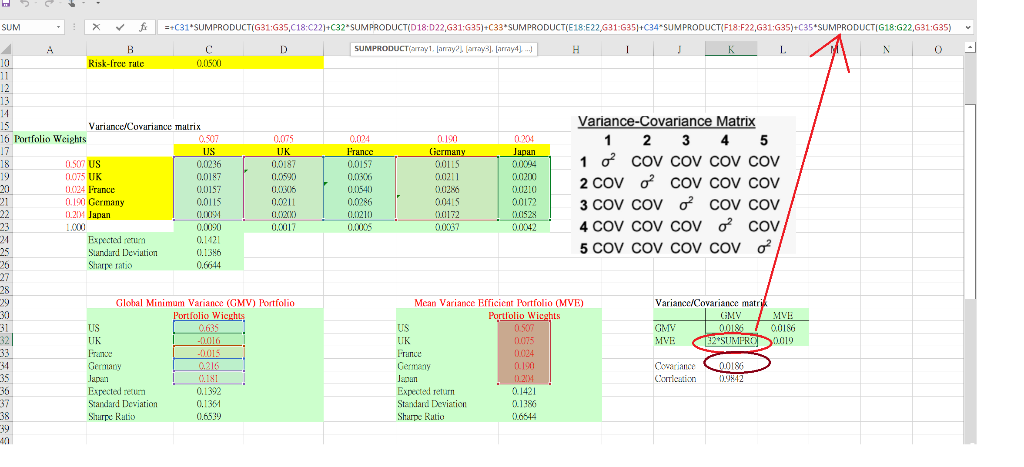
SUM - .fi =+C31 SUMPRODUCT(G31:435,C18:C22]+C32*SUM PRODUCT(D18:022,631:435)+C33 SUMPRODUCT(E18:E22,G31-G351+C34-SUMPRODUCT/F18:F22,G31:G35)+C35 SUMPRODUCT[G18:G22,631:35) SUMPRODUCT Aray(array(array) ... H 1 L 0 1204 Japan 0.004 France 0,0157 0.06% 0.0540 0.0286 0.01210 0.0005 0.190 Ciermany 00115 00211 00286 000415 0200172 0.0087 00200 00210 00172 0528 00042 B D 10 Risk-Tree Tule 0.00 11 12 13 14 15 Variancc/Covuriance mutrix 16 Portfolio Weights 0.507 0.005 17 US UK 18 OSOT US 0.0236 19 0.075 UK 0.0187 0.0590 20 0.024 France 0.0157 0.XXSC6 21 0.190 Germany 0.0115 0.0211 0.214 Japan 0.001 OLMAK) 23 1.000 0.0090 0.0012 24 Expectedre 0.1421 25 Standard Deviation 0.130 26 Sharpe ratio 0.6644 27 28 29 Global Minimum Variance (GMV) Portfolio 30 Portfolio Wicghts 31 US 32 UK -2016 33 France -0.015 34 Germany 0.216 35 Japan 0.181 36 Expected en 0.1392 37 Standard Deviation 0.1351 38 Sharpe Ratio 0.6539 19 41 Variance-Covariance Matrix 1 2 3 4 5 1 oCOV COV COV COV 2 COVO? COV COV COV 3 COV COVO?COV COV 4 COV COV COVCOV 5 COV COV COV COV? Variance/Covariance matri GMV MVE GMV 0019 00186 MVE 132 SUMPRC0019 Mean Variance Efficient Portfolio (MVE) Portfolio Wichts US 0.500 UK 0073 France 0024 Germany 0.190 Japan 0.2014 Expected return 0.1421 Standard Deviation 0.13 Shape Ratio 0.6544 Cowariance Carication 2018 09842 SUM - .fi =+C31 SUMPRODUCT(G31:435,C18:C22]+C32*SUM PRODUCT(D18:022,631:435)+C33 SUMPRODUCT(E18:E22,G31-G351+C34-SUMPRODUCT/F18:F22,G31:G35)+C35 SUMPRODUCT[G18:G22,631:35) SUMPRODUCT Aray(array(array) ... H 1 L 0 1204 Japan 0.004 France 0,0157 0.06% 0.0540 0.0286 0.01210 0.0005 0.190 Ciermany 00115 00211 00286 000415 0200172 0.0087 00200 00210 00172 0528 00042 B D 10 Risk-Tree Tule 0.00 11 12 13 14 15 Variancc/Covuriance mutrix 16 Portfolio Weights 0.507 0.005 17 US UK 18 OSOT US 0.0236 19 0.075 UK 0.0187 0.0590 20 0.024 France 0.0157 0.XXSC6 21 0.190 Germany 0.0115 0.0211 0.214 Japan 0.001 OLMAK) 23 1.000 0.0090 0.0012 24 Expectedre 0.1421 25 Standard Deviation 0.130 26 Sharpe ratio 0.6644 27 28 29 Global Minimum Variance (GMV) Portfolio 30 Portfolio Wicghts 31 US 32 UK -2016 33 France -0.015 34 Germany 0.216 35 Japan 0.181 36 Expected en 0.1392 37 Standard Deviation 0.1351 38 Sharpe Ratio 0.6539 19 41 Variance-Covariance Matrix 1 2 3 4 5 1 oCOV COV COV COV 2 COVO? COV COV COV 3 COV COVO?COV COV 4 COV COV COVCOV 5 COV COV COV COV? Variance/Covariance matri GMV MVE GMV 0019 00186 MVE 132 SUMPRC0019 Mean Variance Efficient Portfolio (MVE) Portfolio Wichts US 0.500 UK 0073 France 0024 Germany 0.190 Japan 0.2014 Expected return 0.1421 Standard Deviation 0.13 Shape Ratio 0.6544 Cowariance Carication 2018 09842
Step by Step Solution
There are 3 Steps involved in it

Get step-by-step solutions from verified subject matter experts