

Question: Hello! This is a Probability lesson 5.7b Homework Score: 2/44 1/9 answered 0 Question 2 v Two methods to screen women for possible breast cancer
Hello! This is a Probability lesson
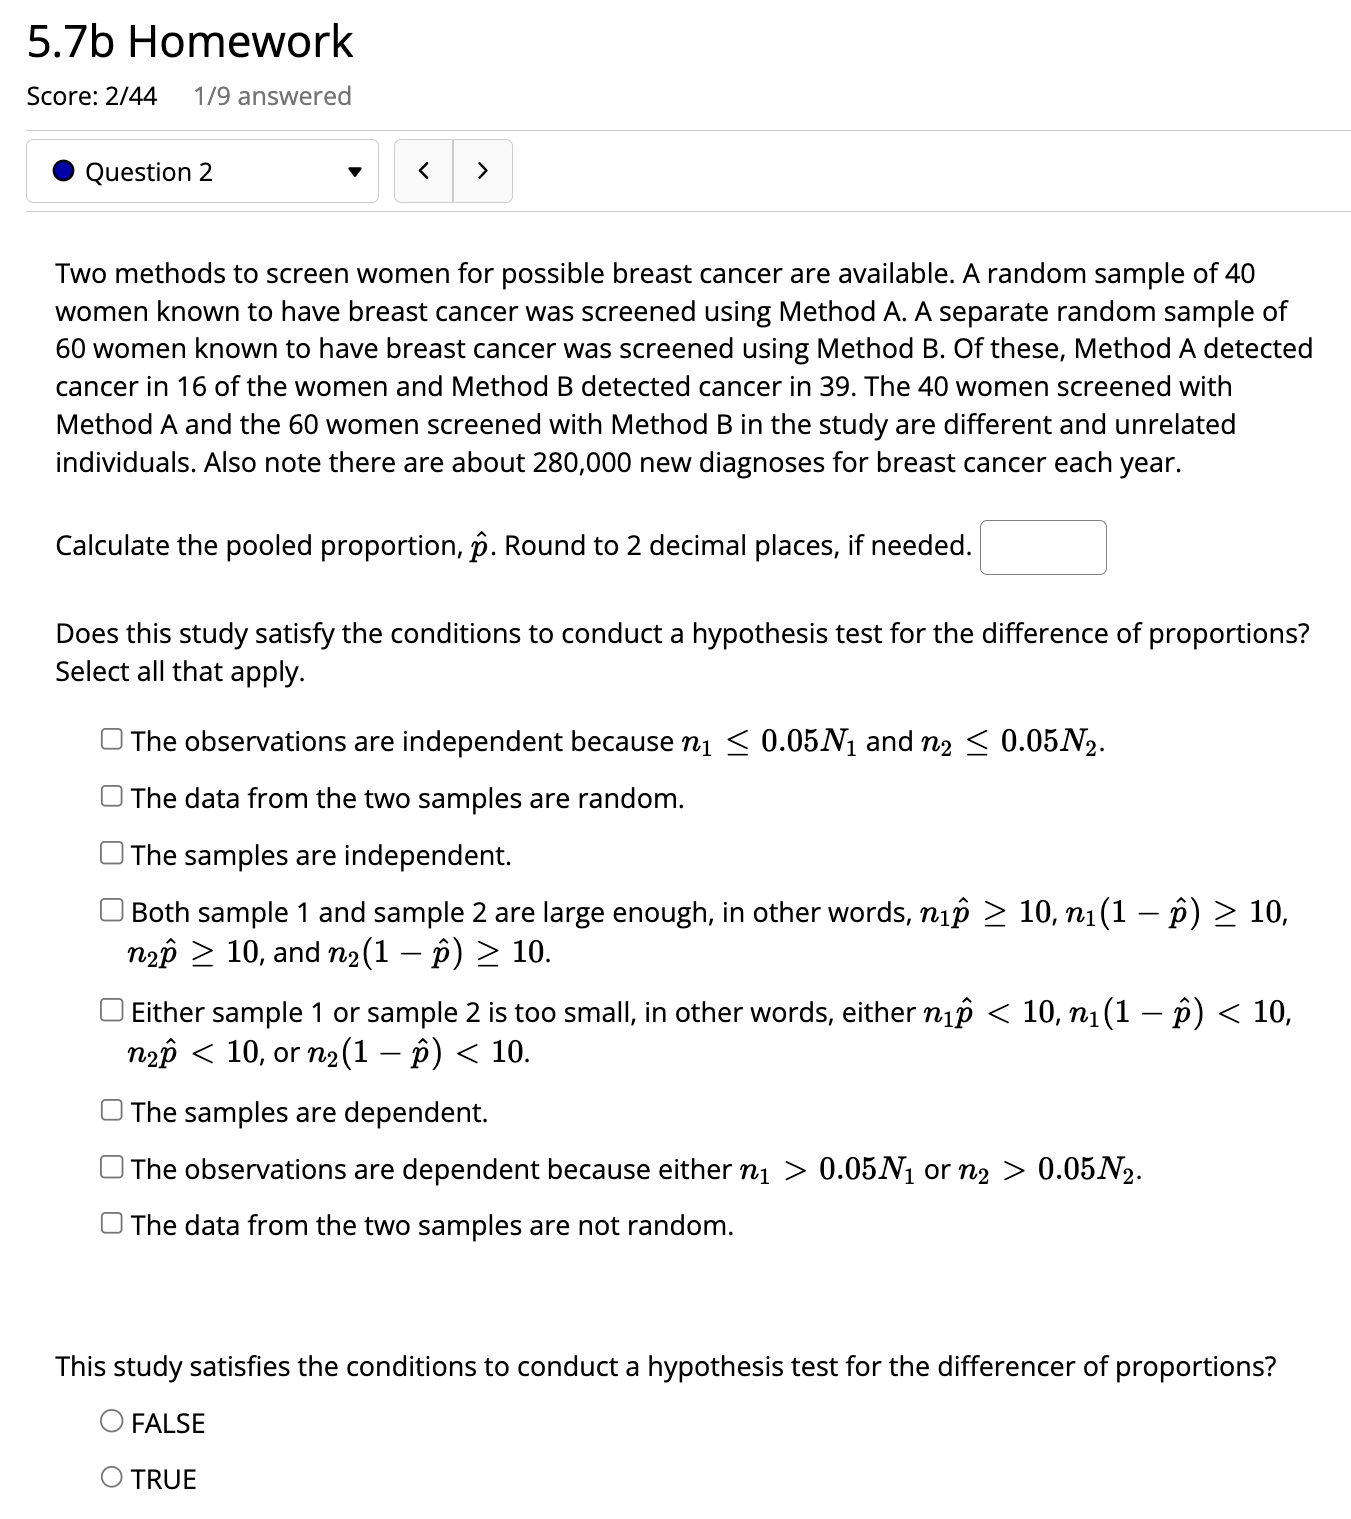
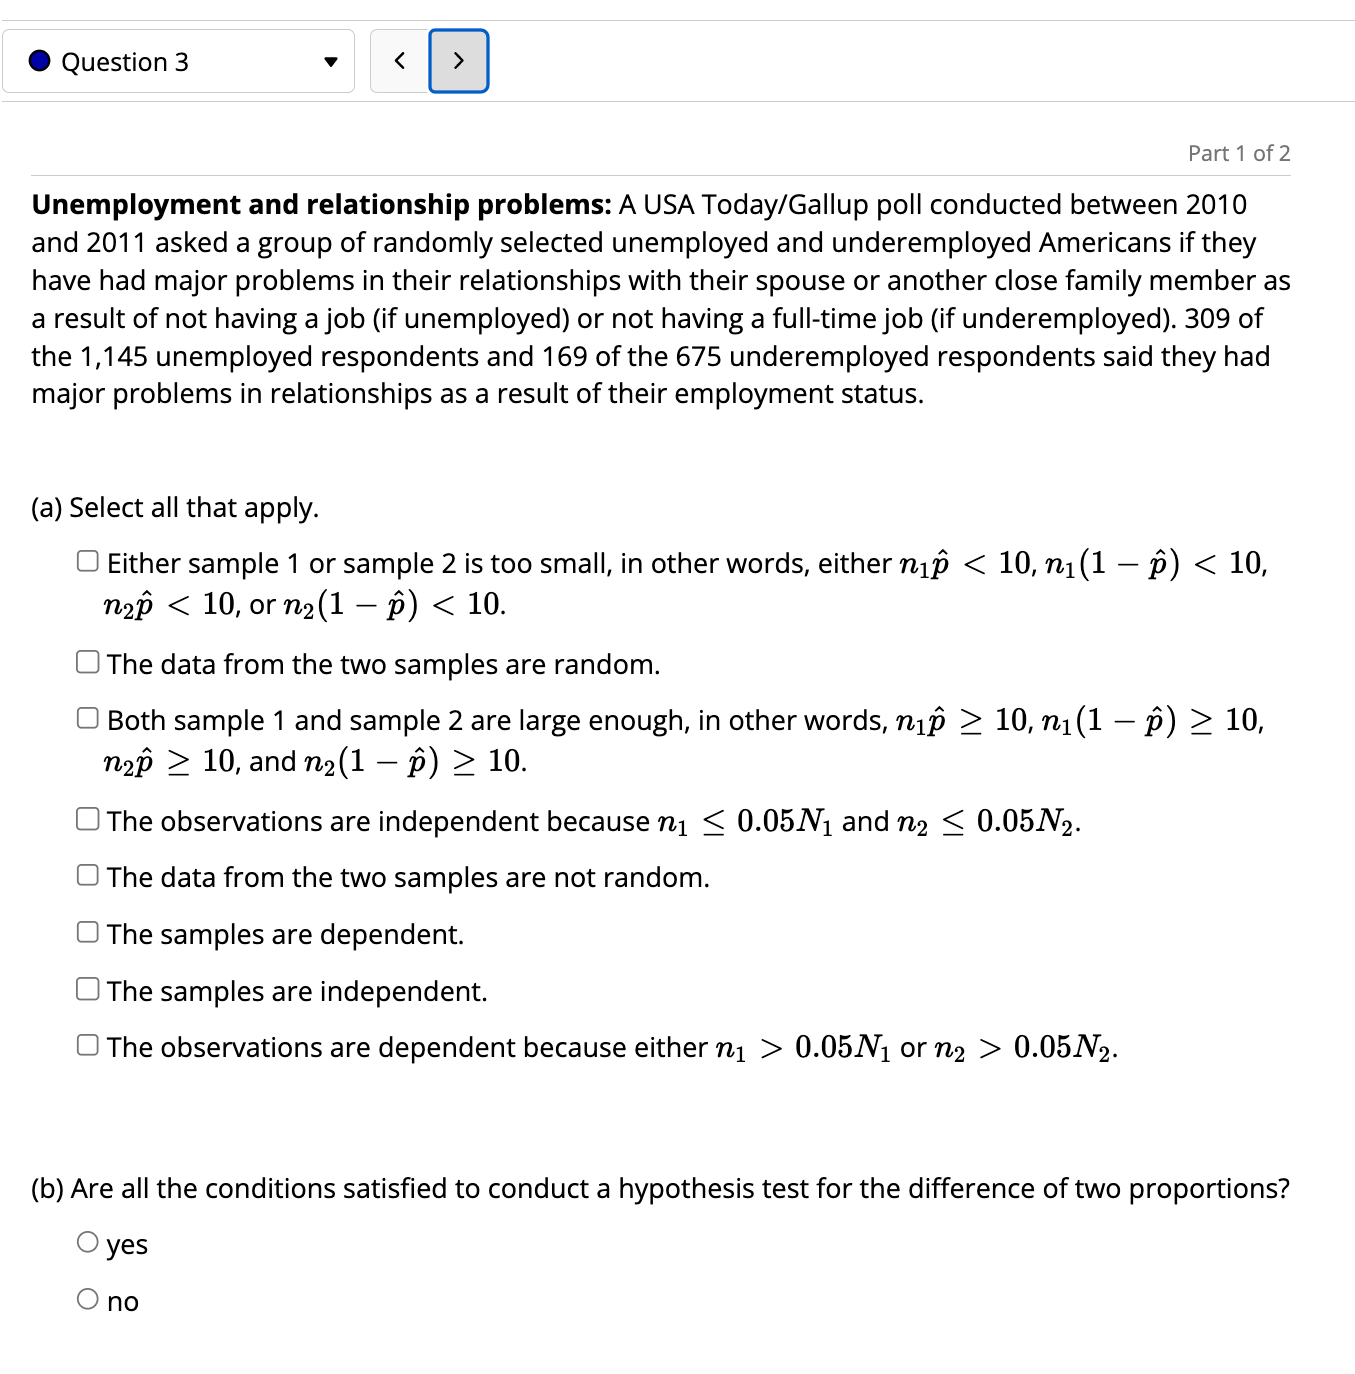
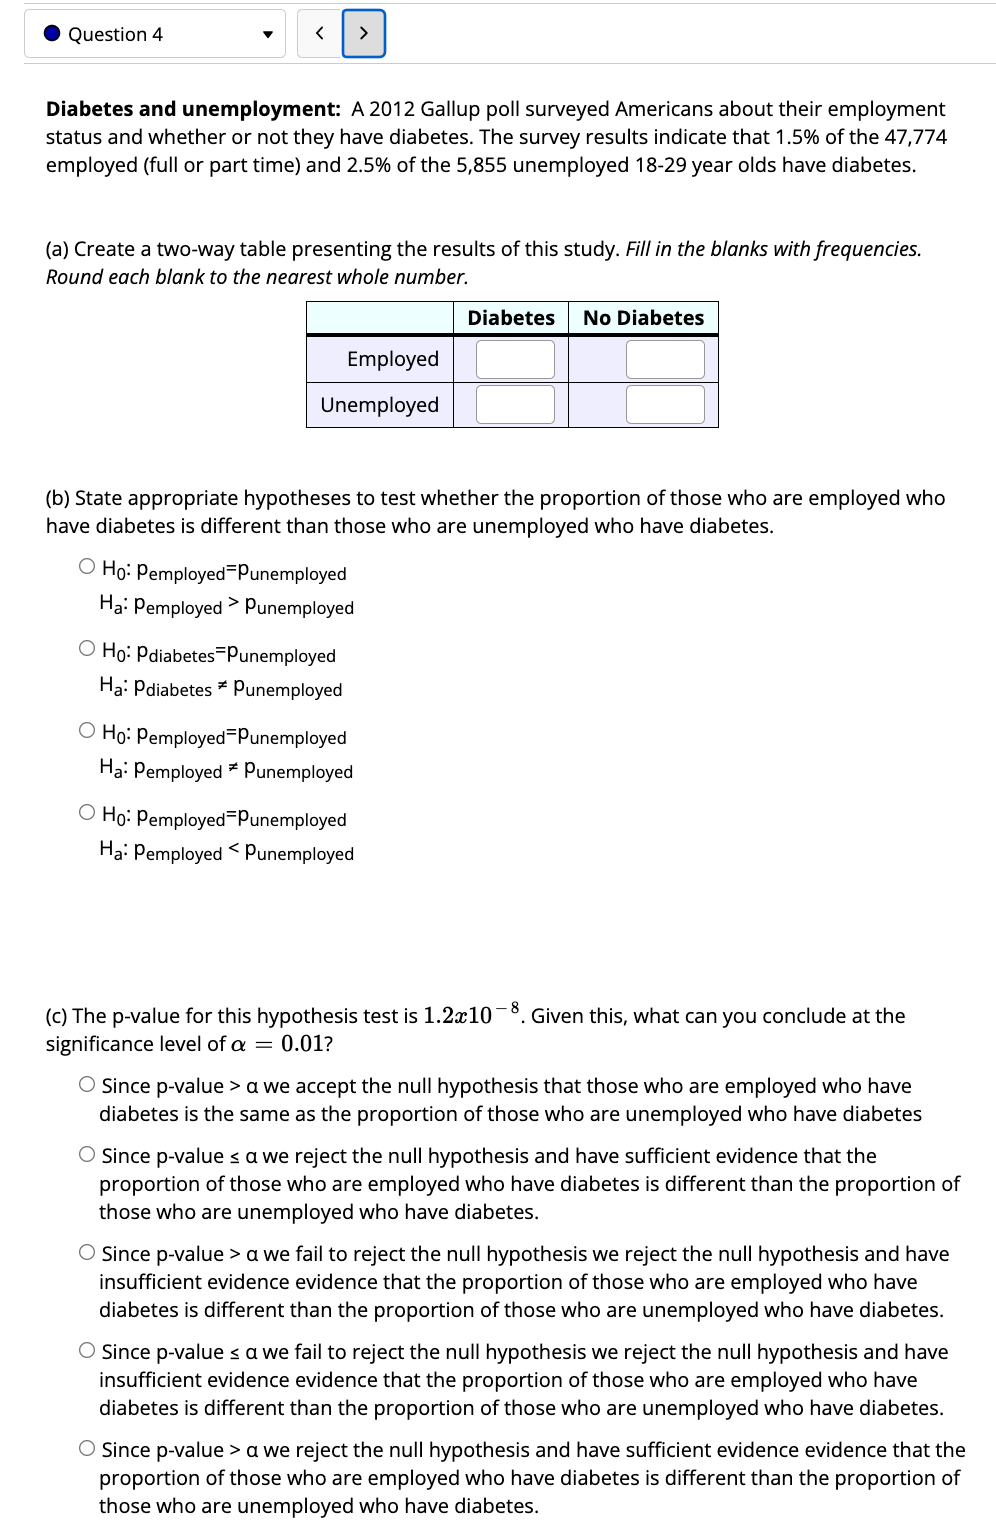
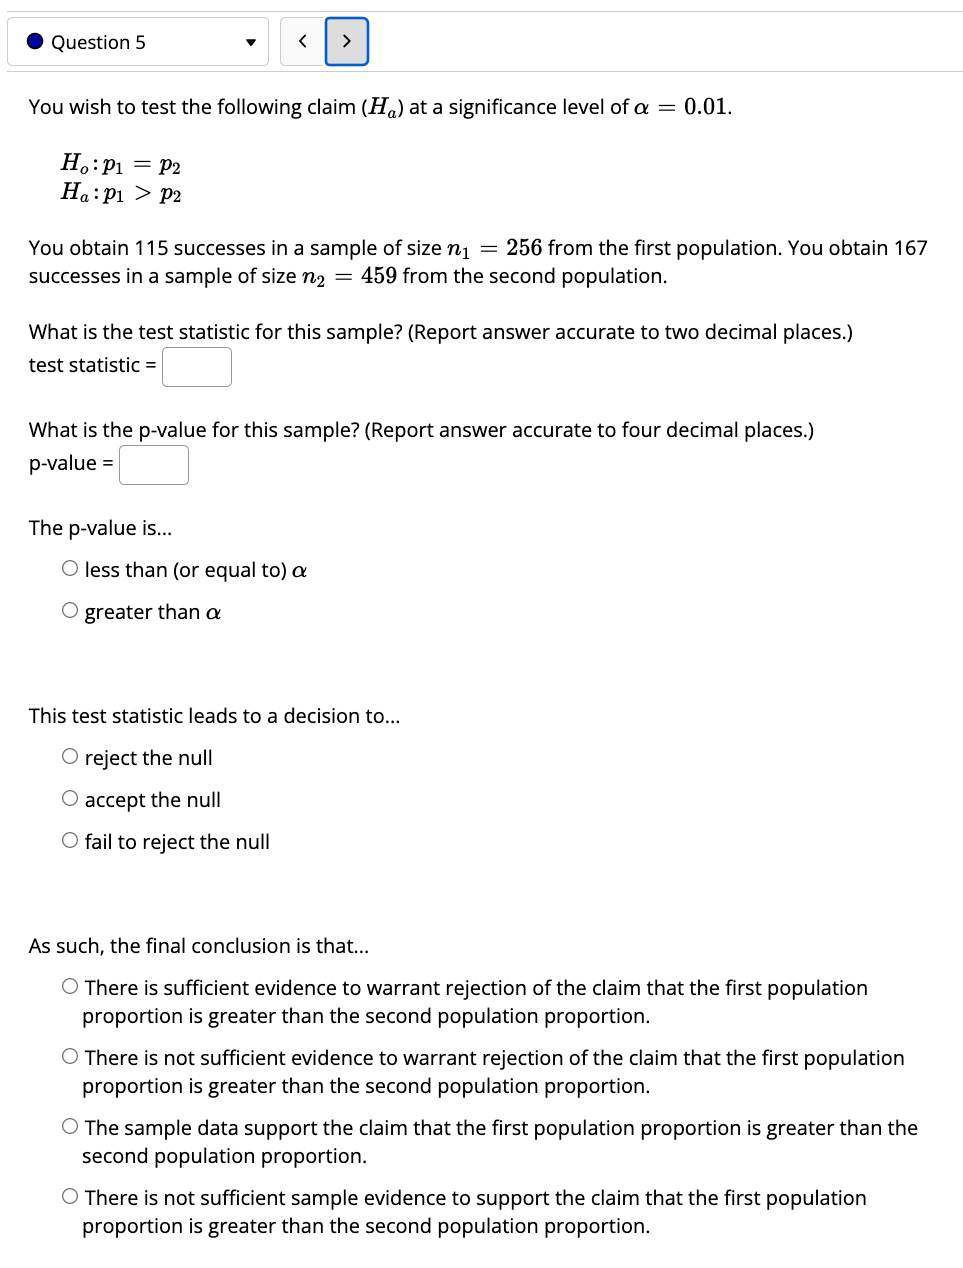
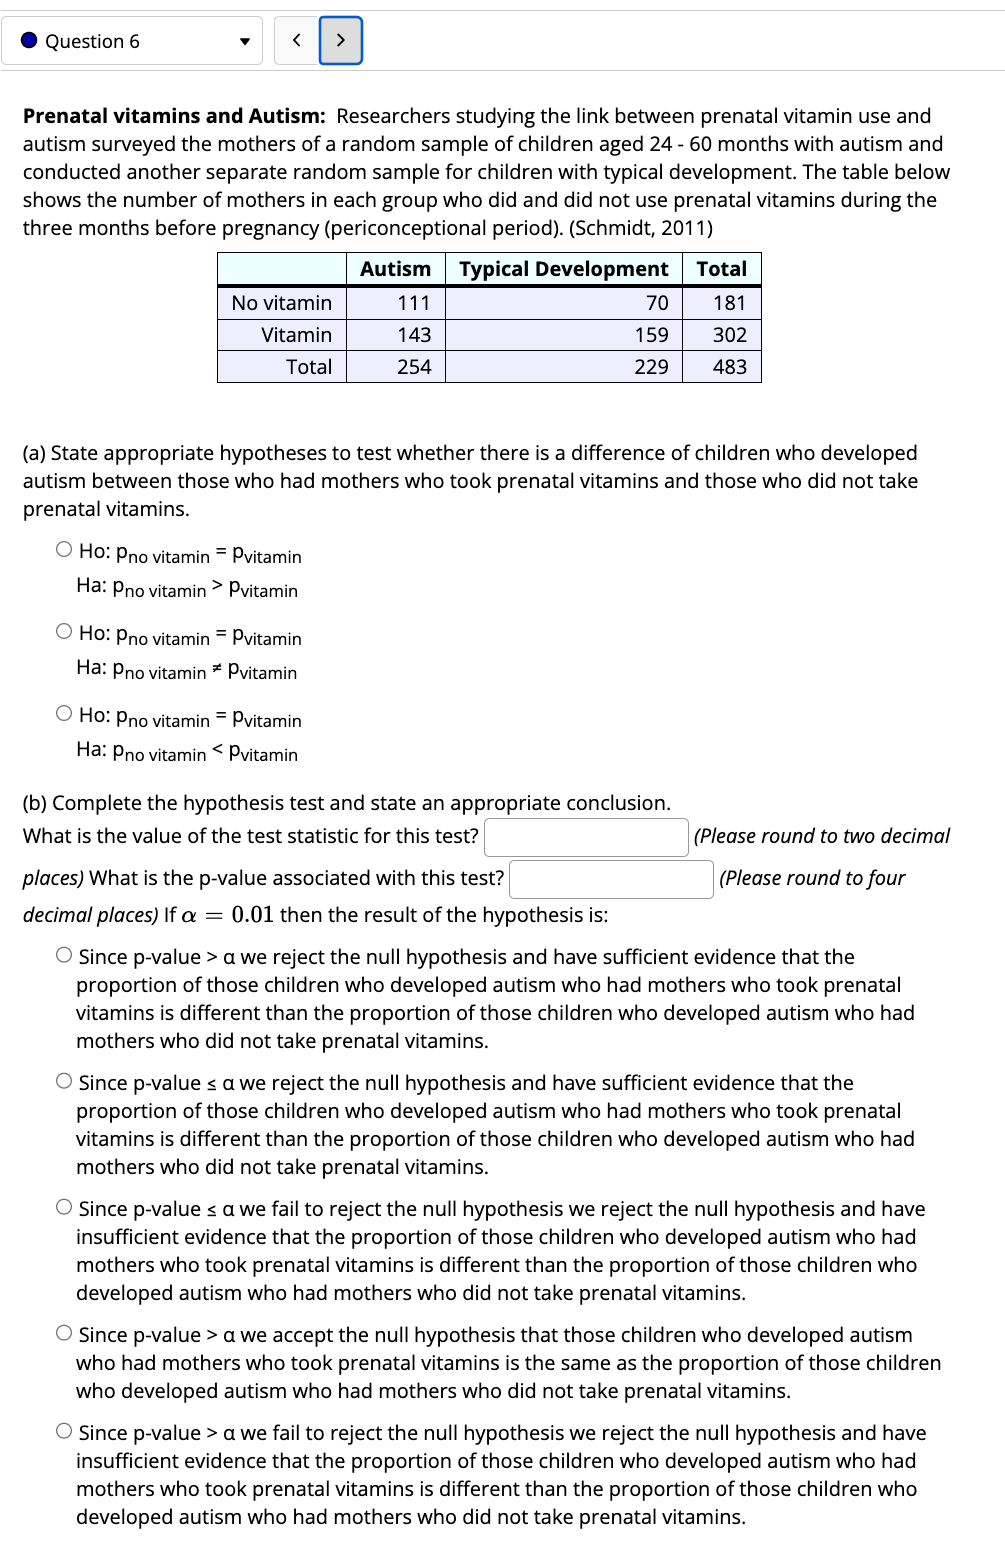
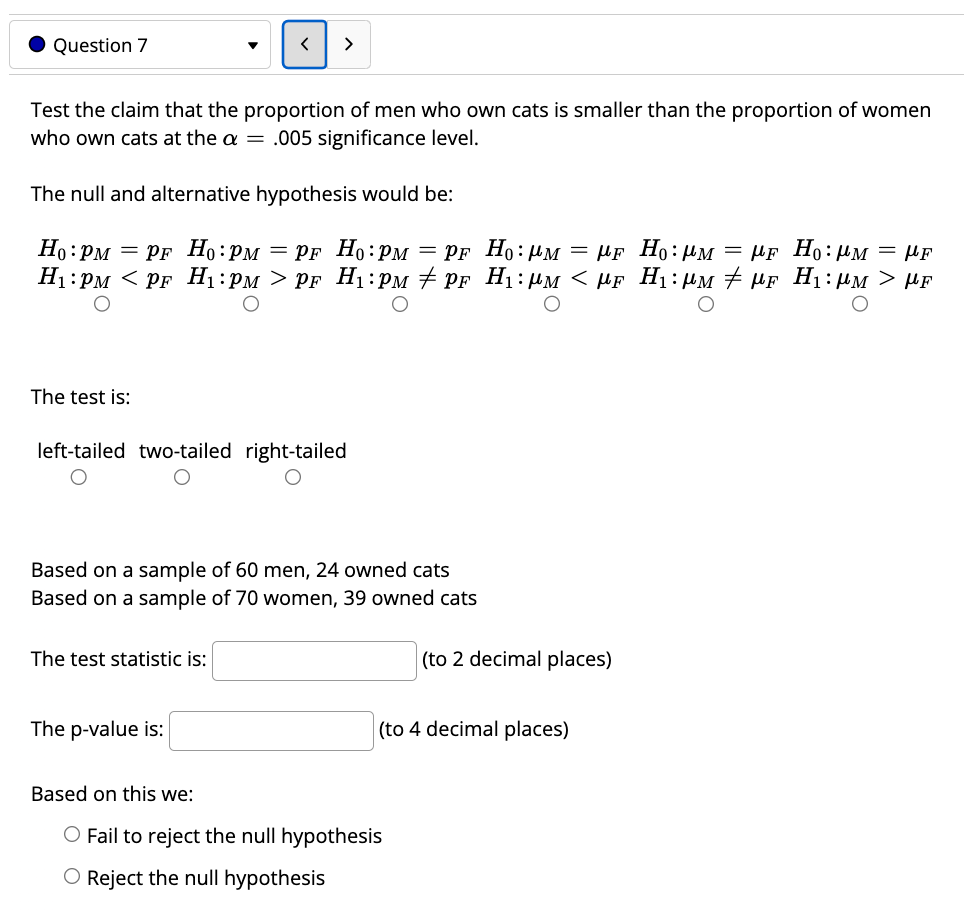
5.7b Homework Score: 2/44 1/9 answered 0 Question 2 v Two methods to screen women for possible breast cancer are available. A random sample of 40 women known to have breast cancer was screened using Method A. A separate random sample of 60 women known to have breast cancer was screened using Method B. Of these, Method A detected cancer in 16 of the women and Method B detected cancer in 39. The 40 women screened with Method A and the 60 women screened with Method B in the study are different and unrelated individuals. Also note there are about 280,000 new diagnoses for breast cancer each year. Calculate the pooled proportion,13. Round to 2 decimal places, if needed. ' ' Does this study satisfy the conditions to conduct a hypothesis test for the difference of proportions? Select all that apply. C] The observations are independent because n1 3 0.05N1 and n2 3 0.05N2. C] The data from the two samples are random. C] The samples are independent. A [:1 Both sample 1 and sample 2 are large enough, in other words, 71133 2 10, n1(1 p) 2 10, my? 2 10,and 122(1 ;6) 2 10. C] Either sample 1 or sample 2 is too small, in other words, either 11136 0.05N1 or 122 > 0.05N2. [3 The data from the two samples are not random. This study satisfies the conditions to conduct a hypothesis test for the differencer of proportions? O FALSE O TRUE 0 Question 3 v 0.05N1 or 17.2 > 0.05N2. (b) Are all the conditions satised to conduct a hypothesis test for the difference of two proportions? 0 yes 0 no 0 Question 4 v ( Diabetes and unemployment: A 2012 Gallup poll surveyed Americans about their employment status and whether or not they have diabetes. The survey results indicate that 1.5% of the 47,774 employed (full or part time) and 2.5% of the 5,855 unemployed 1829 year olds have diabetes. (a) Create a twoway table presenting the results of this study. Fillin the blanks with frequencies. Round each blank to the nearest whole number. Diabetes No Diabetes Employed Unemployed (b) State appropriate hypotheses to test whether the proportion of those who are employed who have diabetes is different than those who are unemployed who have diabetes. 0 H0: pemployed=punemployed Ha: Pemployed 3' Punemployed O HO: pdiabetes=Punemployed Ha: Pdiabetes \" Punemployed O HO: pemployed=punemployed Ha: Pemployed ' Punemployed O HO: pemployed=punemployed Ha: Pemployed C Punemployed (c) The pvalue for this hypothesis test is 1.2.310 _8. Given this, what can you conclude at the significance level ofo: = 0.01? 0 Since pvalue > a we accept the null hypothesis that those who are employed who have diabetes is the same as the proportion of those who are unemployed who have diabetes 0 Since pvalue 5 C: we reject the null hypothesis and have sufficient evidence that the proportion of those who are employed who have diabetes is different than the proportion of those who are unemployed who have diabetes. 0 Since pvalue > a we fail to reject the null hypothesis we reject the null hypothesis and have insufficient evidence evidence that the proportion of those who are employed who have diabetes is different than the proportion of those who are unemployed who have diabetes. 0 Since pvalue 5 C: we fail to reject the null hypothesis we reject the null hypothesis and have insufficient evidence evidence that the proportion of those who are employed who have diabetes is different than the proportion of those who are unemployed who have diabetes. 0 Since pvalue > a we reject the null hypothesis and have sufficient evidence evidence that the proportion of those who are employed who have diabetes is different than the proportion of those who are unemployed who have diabetes. . Question 5 v ( You wish to test the following claim (Ha) at a significance level ofo: = 0.01. H0491 =92 Ha:p1 >'p2 You obtain 1 15 successes in a sample of size n1 2 256 from the rst population. You obtain 167 successes in a sample of size n2 2 459 from the second population. What is the test statistic for this sample? (Report answer accurate to two decimal places.) test statistic = What is the pvalue for this sample? {Report answer accurate to four decimal places.) pvalue = The pvalue is... 0 less than (or equal to) o: O greater than a This test statistic leads to a decision to... O reject the null O accept the null O fail to reject the null As such, the final conclusion is that... Q There is sufcient evidence to warrant rejection of the claim that the rst population proportion is greater than the second population proportion. Q There is not sufficient evidence to warrant rejection of the claim that the first population proportion is greater than the second population proportion. O The sample data support the claim that the first population proportion is greater than the second population proportion. Q There is not sufficient sample evidence to support the claim that the rst population proportion is greater than the second population proportion. 0 Question 6 v ( Prenatal vitamins and Autism: Researchers studying the link between prenatal vitamin use and autism surveyed the mothers of a random sample of children aged 24 60 months with autism and conducted another separate random sample for children with typical development. The table below shows the number 0' mothers in each group who did and did not use prenatal vitamins during the three months before pregnancy (periconceptional period). (Schmidt, 2011) Autism Typical Development Total No vitamin 111 70 181 Vitamin 143 159 302 Total 254 229 483 (a) State appropriate hypotheses to test whether there is a difference of children who developed autism between those who had mothers who took prenatal vitamins and those who did not take prenatal vitamins. O HO: pno vitamin = pvitamin Ha: pno vitamin 3' Pvitamin O HO: pno vitamin = Pvitamin Ha: pno vitamin " Pvitamin O HO: pno vitamin = Pvitamin Ha: pno vitamin d we reject the null hypothesis and have sufcient evidence that the proportion of those children who developed autism who had mothers who took prenatal vitamins is different than the proportion ofthose children who developed autism who had mothers who did not take prenatal vitamins. '3' Since pvalue s :1 we reject the null hypothesis and have sufcient evidence that the proportion of those children who developed autism who had mothers who took prenatal vitamins is different than the proportion ofthose children who developed autism who had mothers who did not take prenatal vitamins. '3' Since pvalue s :1 we fail to reject the null hypothesis we reject the null hypothesis and have insufficient evidence that the proportion of those children who developed autism who had mothers who took prenatal vitamins is different than the proportion of those children who developed autism who had mothers who did not take prenatal vitamins. '3' Since pvalue > d we accept the null hypothesis that those children who developed autism who had mothers who took prenatal vitamins is the same as the proportion of those children who developed autism who had mothers who did not take prenatal vitamins. '3' Since pvalue > d we fail to reject the null hypothesis we reject the null hypothesis and have insufficient evidence that the proportion of those children who developed autism who had mothers who took prenatal vitamins is different than the proportion of those children who developed autism who had mothers who did not take prenatal vitamins. .Question? v ) Test the claim that the proportion of men who own cats is smaller than the proportion of women who own cats at the a = .005 significance level. The null and alternative hypothesis would be: H03PM:PF HMPM =pF Ho:pM =pF HMMZMF H03HM2#F Ho:.uM=uF H1=pM
Step by Step Solution
There are 3 Steps involved in it

Get step-by-step solutions from verified subject matter experts