

Question: Hello. This is my assignment. Please DON'T send me a handwritten answer, as often I can't understand the symbols when they are handwritten. This is
Hello. This is my assignment. Please DON'T send me a handwritten answer, as often I can't understand the symbols when they are handwritten.
This is the assignment.
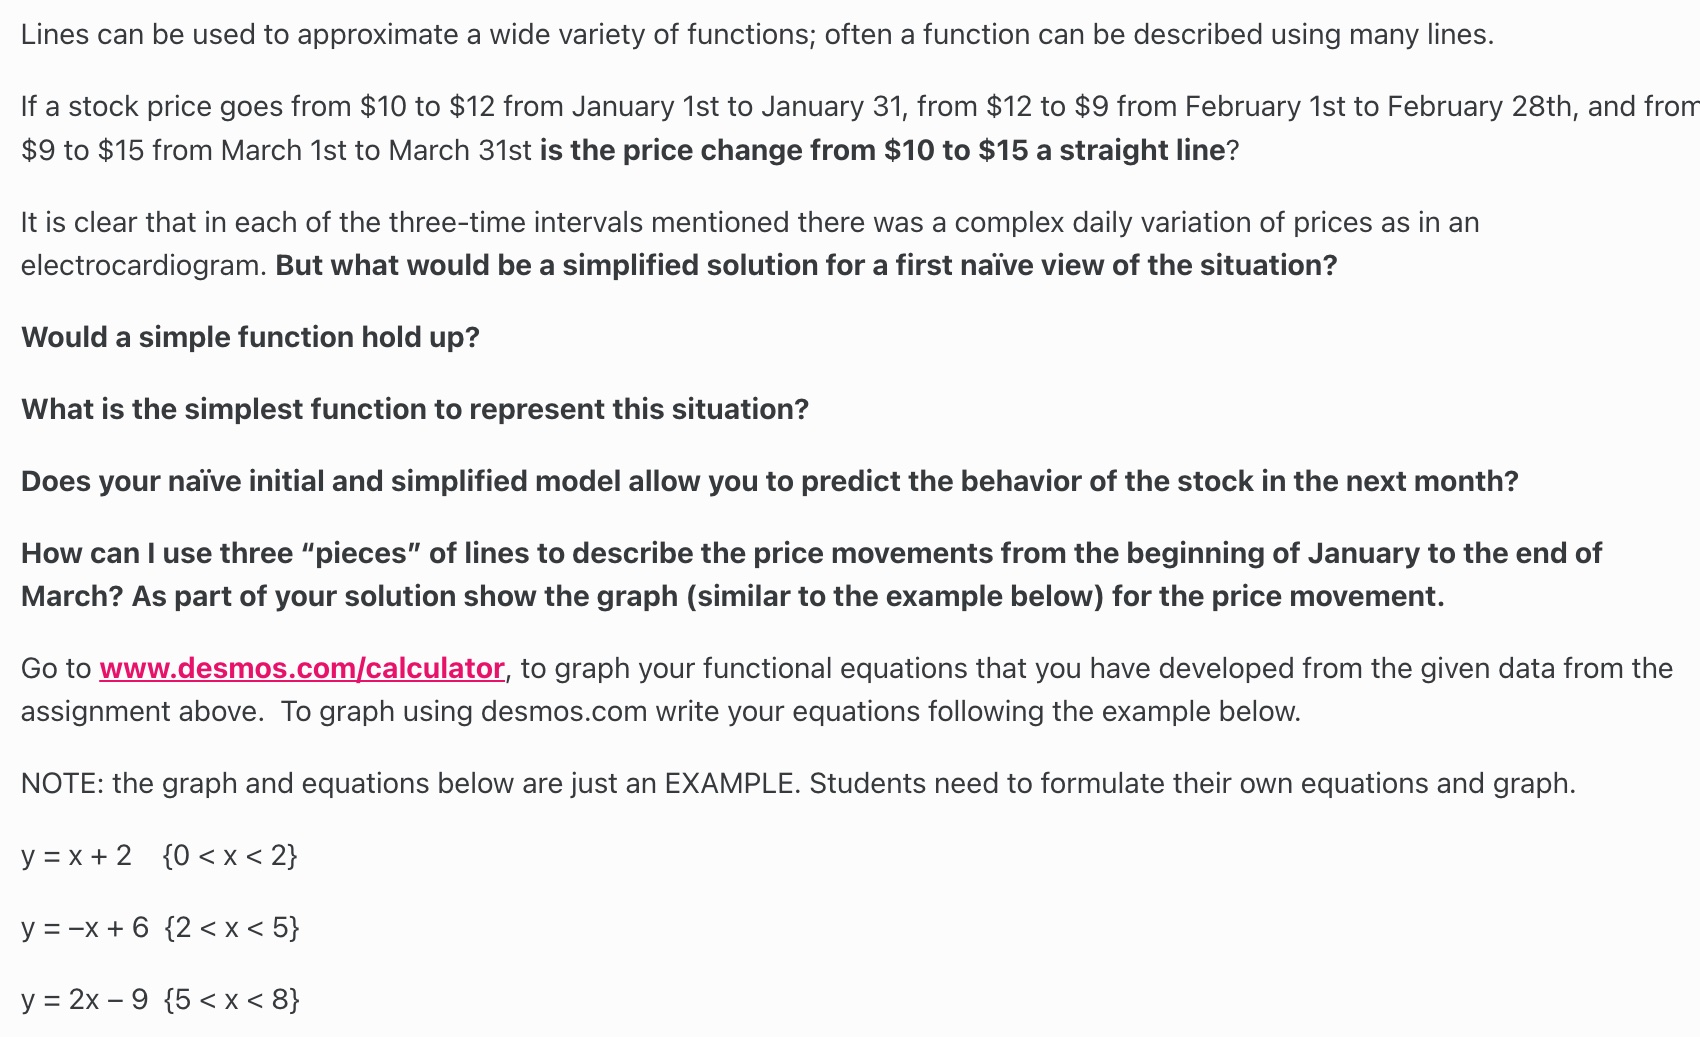
Lines can be used to approximate a wide variety of functions; often a function can be described using many lines. If a stock price goes from $10 to $12 from January 1st to January 31, from $12 to $9 from February 1st to February 28th, and frorr $9 to $15 from March 1st to March 31st is the price change from $10 to $15 a straight line? It is clear that in each of the threetime intervals mentioned there was a complex daily variation of prices as in an electrocardiogram. But what would be a simplified solution for a first na'l've view of the situation? Would a simple function hold up? What is the simplest function to represent this situation? Does your na'l've initial and simplified model allow you to predict the behavior of the stock in the next month? How can I use three "pieces" of lines to describe the price movements from the beginning of January to the end of March? As part of your solution show the graph (similar to the example below) for the price movement. Go to www.desmos.comlcalculator, to graph your functional equations that you have developed from the given data from the assignment above. To graph using desmos.com write your equations following the example below. NOTE: the graph and equations below are just an EXAMPLE. Students need to formulate their own equations and graph. y:x+2 {O
Step by Step Solution
There are 3 Steps involved in it

Get step-by-step solutions from verified subject matter experts