

Question: Hello, this is my research project for my stats class and towards the bottom I am having a hard time answering some of the required
Hello, this is my research project for my stats class and towards the bottom I am having a hard time answering some of the required elements. they have NEED HELP under them. I copied and pasted the rest of my document for reference. The data set is also attached for groups A and B at the bottom. Thank you!
Introduction: Scenario
There were 34 participants recruited for this study from a college campus and randomly divided into 2 groups. Both groups were shown a 58-second video of a crime scene scenario in which the suspect's facial characteristics were clearly visible at two separate points and occasionally visible at other times throughout the video. The 17 participants in Group A were shown a 5-individual lineup that contained the suspect in the video. The 17 participants in Group B were shown a 5-individual lineup that did not contain the suspect. All participants were asked to identify if and where the suspect was in the lineup and provide a rating of confidence on a scale from 1 to 10 that the selection was the same person as seen in the video committing the crime. Since this study would be an experiment, Group B would be the control group and Group A would be the experimental group because Group A was exposed to the actual suspect and the participants in Group B were not. The question that can be answered by the data, "Is there is a difference in confidence between group A, which was set up to be right and group B, which was set up to be wrong?"
Data Analysis: Sample
The sample size (n) is taken to be 34 students wherein 1 of those students is the suspect. Since the sample size affects the outcome of ones hypotheses, a smaller sample size gives a relatively higher confidence value for overall result.
Data Analysis: Statistical Procedures
The type of statistical procedure is Analysis of Variance wherein the factors are split into two. In this case, control group and experimental group. Using number 2 from the "Choose Your Test Document" (two sample t-test).
Data Analysis: What are the Chance Factors of this study
NEED HELP
Data Analysis: What is the Mean and Standard Deviation
NEED HELP
Data Analysis: Histogram
NEED HELP
Data Analysis: Shape of data presented.
NEED HELP
Hypothesis: Whether One Mean is Higher
There is no difference in groups A or B for null or alternative hypothesis.
Hypothesis: Null Hypothesis and Alternative Hypothesis (From milestone 3)
H0:?=0
Ha : ? ? 0
Results: Valid (are the results valid? why or why not?)
NEED HELP
Results: Statistically Significant(are the results statistically significant? why or why not?)
NEED HELP
Results: Graphsthat would be included
NEED HELP
Conclusion: (what do you interpret from this?)
NEED HELP
Conclusion: Interpretation of Data Analysis Procedures
NEED HELP
Conclusion: Are More Statistical Procedures Necessary?
NEED HELP
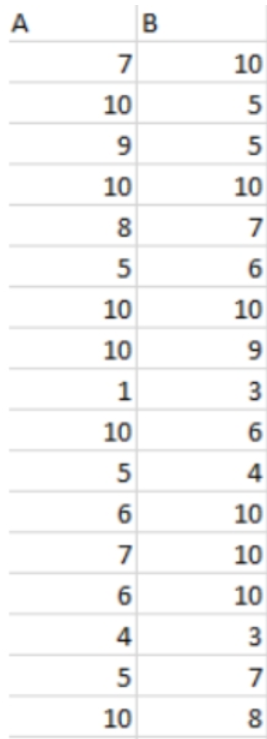
A B 7 10 10 5 9 5 10 10 7 6 10 10 10 9 1 3 10 6 4 10 10 UI A G V OUT 10 7 10 8
Step by Step Solution
There are 3 Steps involved in it

Get step-by-step solutions from verified subject matter experts