

Question: Hello tutor, pls help me to solve. need step by step for the question below, pls provide step by step.tq Each group must assist the
Hello tutor, pls help me to solve. need step by step for the question below, pls provide step by step.tq
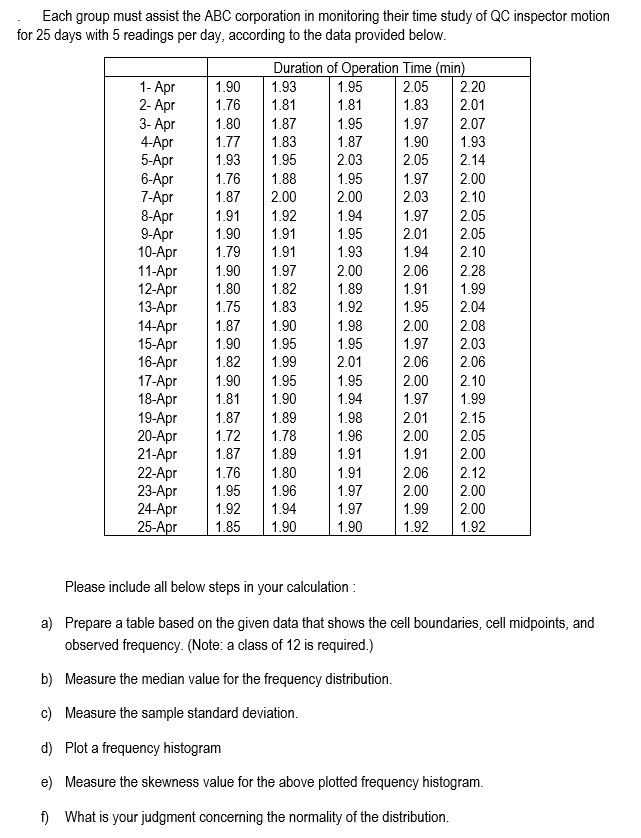
Each group must assist the ABC corporation in monitoring their time study of QC inspector motion for 25 days with 5 readings per day, according to the data provided below. Duration of Operation Time (min) 1- Apr 1.90 1.93 1.95 2.05 2.20 2- Apr 1.76 1.81 1.81 1.83 2.01 3- Apr 1.80 1.87 1.95 1.97 2.07 4-Apr 1.77 1.83 1.87 1.90 1.93 5-Apr 1.93 1.95 2.03 2.05 2.14 6-Apr 1.76 1.88 1.95 1.97 2.00 7-Apr 1.87 2.00 2.00 2.03 2.10 8-Apr 1.91 1.92 1.94 1.97 2.05 9-Apr 1.90 1.91 1.95 2.01 2.05 10-Apr 1.79 1.91 1.93 1.94 2.10 11-Apr 1.90 1.97 2.00 2.06 2.28 12-Apr 1.80 1.82 1.89 1.91 1.99 13-Apr 1.75 1.83 1.92 1.95 2.04 14-Apr 1.87 1.90 1.98 2.00 2.08 15-Apr 1.90 1.95 1.95 1.97 2.03 16-Apr 1.82 1.99 2.01 2.06 2.06 17-Apr 1.90 1.95 1.95 2.00 2.10 18-Apr 1.81 1.90 1.94 1.97 1.99 19-Apr 1.87 1.89 1.98 2.01 20-Apr 2.15 1.72 1.78 1.96 2.00 2.05 21-Apr 1.87 1.89 1.91 1.91 2.00 22-Apr 1.76 1.80 1.91 2.06 2.12 23-Apr 1.95 1.96 1.97 2.00 2.00 24-Apr 1.92 1.94 1.97 1.99 2.00 25-Apr 1.85 1.90 1.90 1.92 1.92 Please include all below steps in your calculation : a) Prepare a table based on the given data that shows the cell boundaries, cell midpoints, and observed frequency. (Note: a class of 12 is required.) b) Measure the median value for the frequency distribution. c) Measure the sample standard deviation. d) Plot a frequency histogram e) Measure the skewness value for the above plotted frequency histogram. f) What is your judgment concerning the normality of the distribution
Step by Step Solution
There are 3 Steps involved in it

Get step-by-step solutions from verified subject matter experts