

Question: Hello tutor, using the instructions/data set below could you assist me in answering question 9-16 . (scroll below and I've identified where to start) ONLY
Hello tutor, using the instructions/data set below could you assist me in answering question 9-16. (scroll below and I've identified where to start) ONLY Use questions 1-8, as a reference point if needed as I have answered them
Thank you
Instructions (Q1-8)
An experiment was conducted on randomly selected Fraser students: each student sees a photo of an object (visual) and then identifies the object, and each student hears a sound (auditory) and then identifies the sound.
The following are instructions to conduct two different hypothesis tests; the first (#s 1-8) is about the population mean difference (??) between visual and auditory response time, and the second (#s 9-16) is about the population proportion (?) of Student students who have jobs.
For Problems 1 - 8: A researcher claims that the response time for visual stimuli, in milliseconds, is greater than the response time for auditory stimuli, on average. Use the sample information to test if there is evidence, at ? = 0.1, that supports the researcher's claim.
1. Define the parameter
The parameter is the response time for visual stimuli and the response time for auditory stimuli both in milliseconds.
2. State the hypotheses for this test.
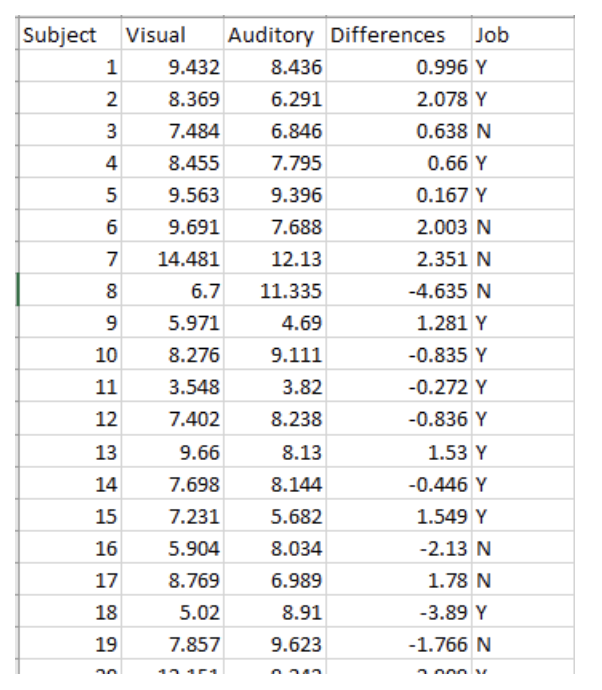
- In Column D, Revise a new data set for the differences in response times: Differences = Visual - Auditory In Cell D2 type: =B2-C2 to calculate the difference of Visual and Auditory response times for Subject 1. Use the fill handle to calculate the remaining differences for all n subjects.
H_0: There is no significant difference between the the response time for visual stimuli, in milliseconds band the response time for auditory stimuli. H_A: The response time for visual stimuli, in milliseconds, is greater than the response time for auditory stimuli.
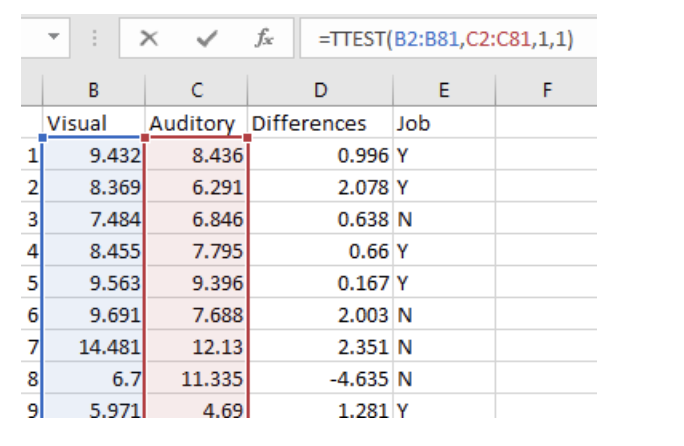
3. Compute the test statistic using Excel. To compute the test statistic, you need the following descriptive statistics for Column D (Difference = Visual - Auditory): n (sample size), ??, (the point estimate for the mean difference of Visual and Auditory), ?(?) (the sample standard deviation of the differences), and ?? (estimated standard error for the mean difference of Visual and Auditory).
- State the name of the test statistic and type the work (using values rounded to 3 decimals and parentheses to show order of operations); then give the computed value to 2 decimals.(2 points)
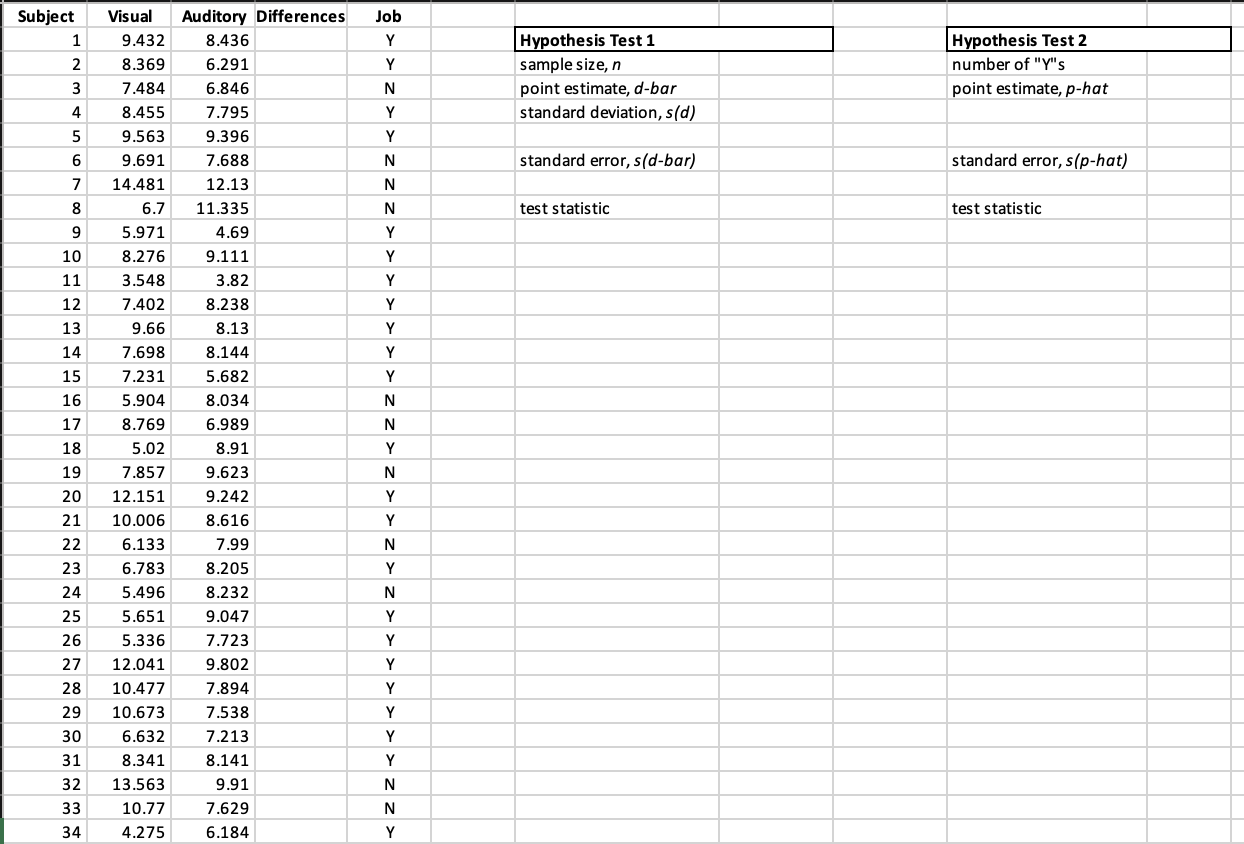

Subject Visual Auditory Differences Job 9.432 8.436 Y Hypothesis Test 1 Hypothesis Test 2 8.369 6.291 Y sample size, n number of "Y"'s W N 7.484 6.846 N point estimate, d-bar point estimate, p-hat 8.455 7.795 Y standard deviation, s(d) 9.563 9.396 Y 9.691 7.688 N standard error, s(d-bar) standard error, s(p-hat) 14.481 12.13 N 6.7 11.335 N test statistic test statistic 5.971 4.69 Y 10 8.276 9.111 Y 11 3.548 3.82 Y 12 7.402 8.238 Y 13 9.66 8.13 14 7.698 8.144 15 7.231 5.682 ZZ
Step by Step Solution
There are 3 Steps involved in it

Get step-by-step solutions from verified subject matter experts