

Question: Hello tutors please help with the following question: note* this isn't for an assignment but rather for my own comprehension and understanding! Thank you. fAn


![33:] B: al]s{2} 122 all\") -8l7} 9? \f60 50 40 30 20](https://s3.amazonaws.com/si.experts.images/answers/2024/06/666daa17d4d0a_999666daa17d10af.jpg)


Hello tutors please help with the following question:
note* this isn't for an assignment but rather for my own comprehension and understanding! Thank you.


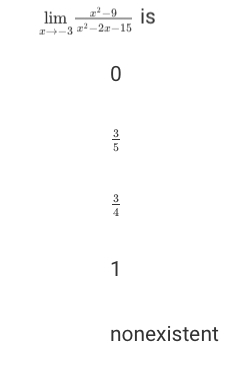

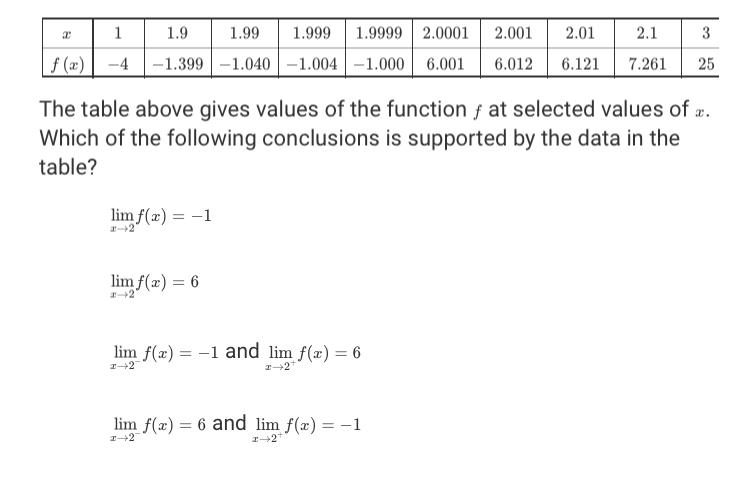


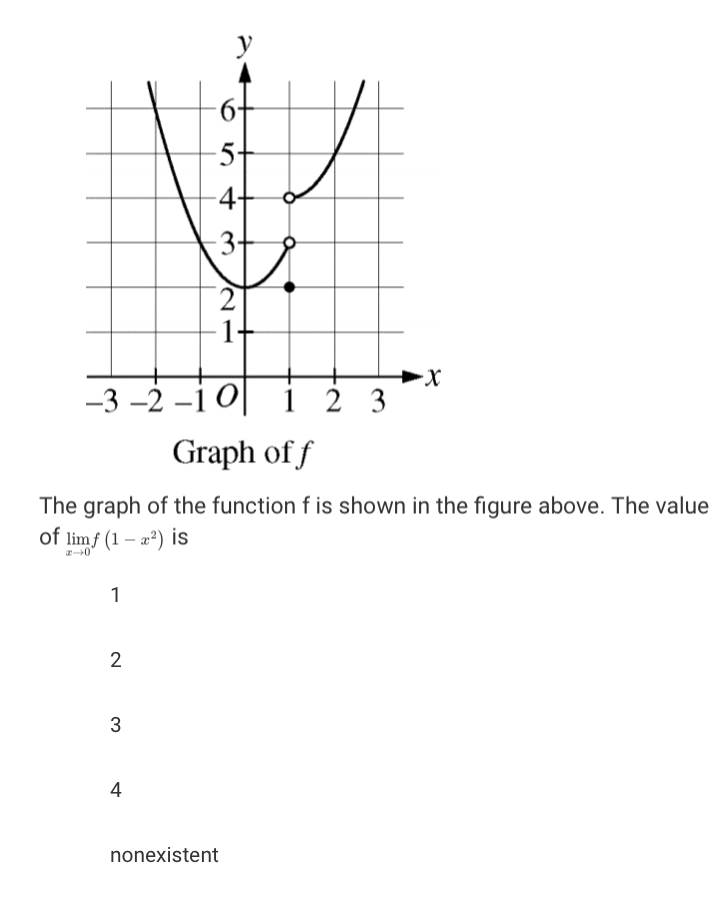
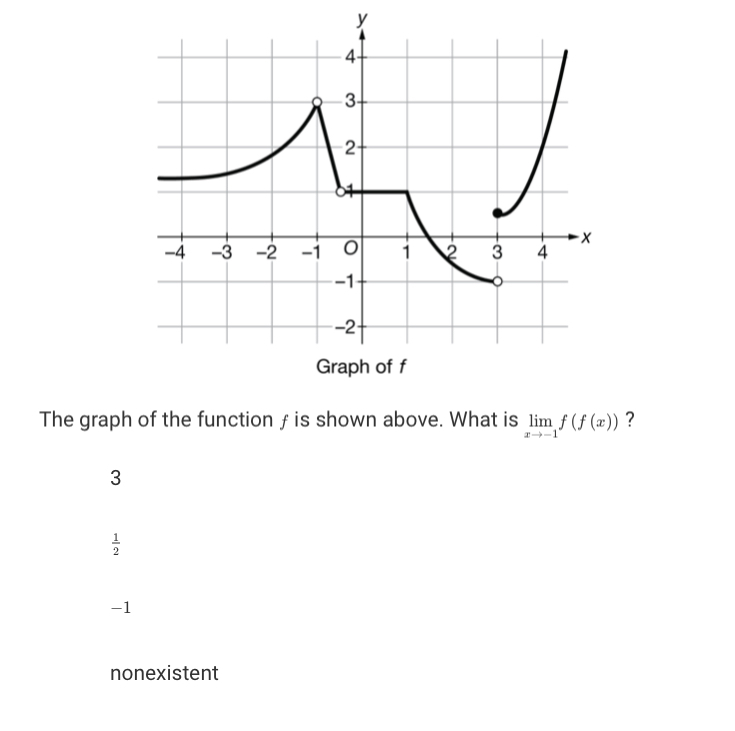

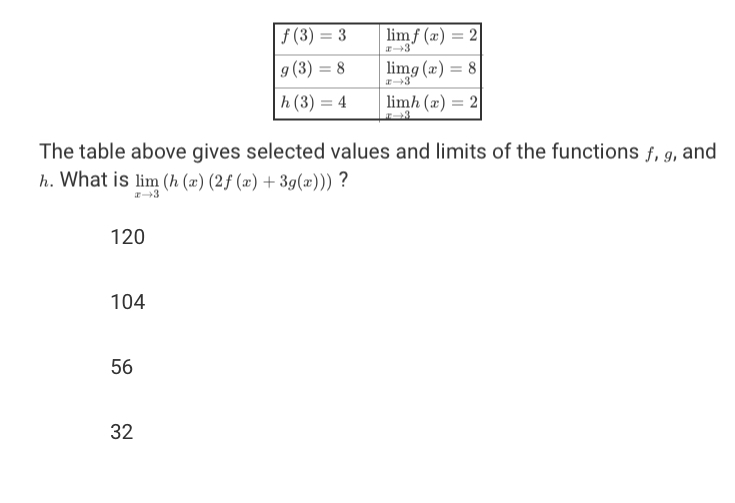


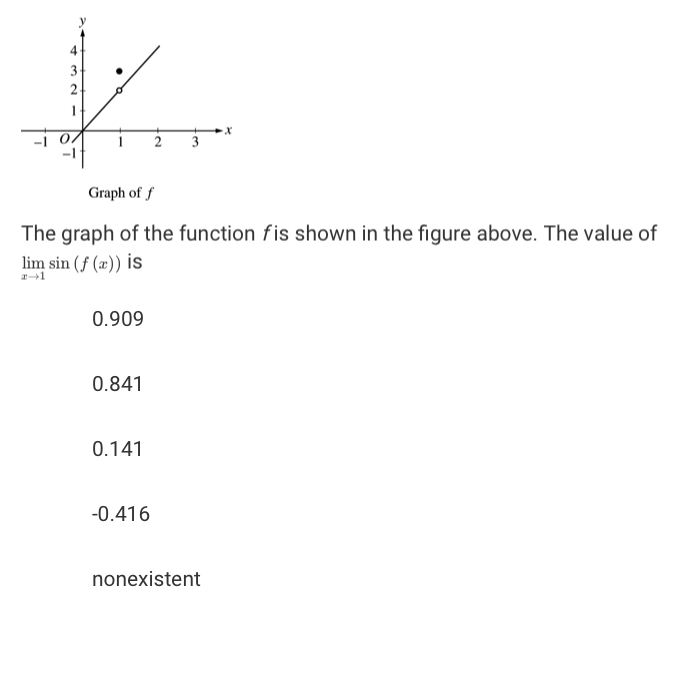
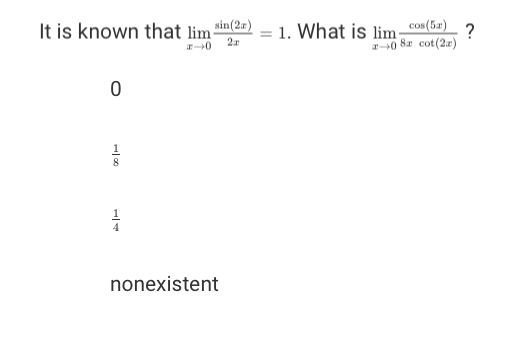
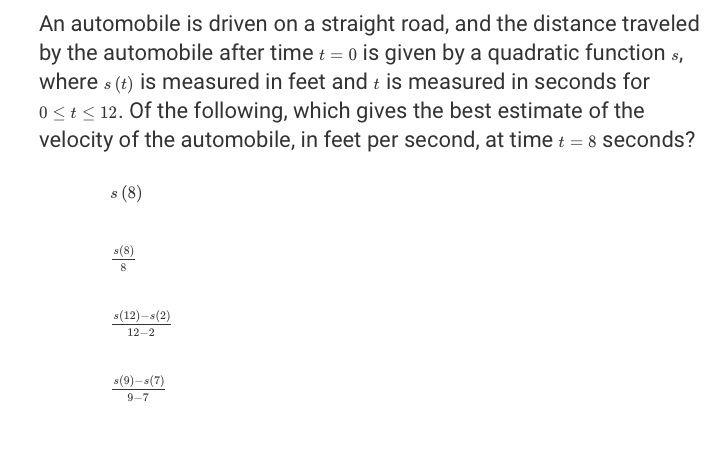
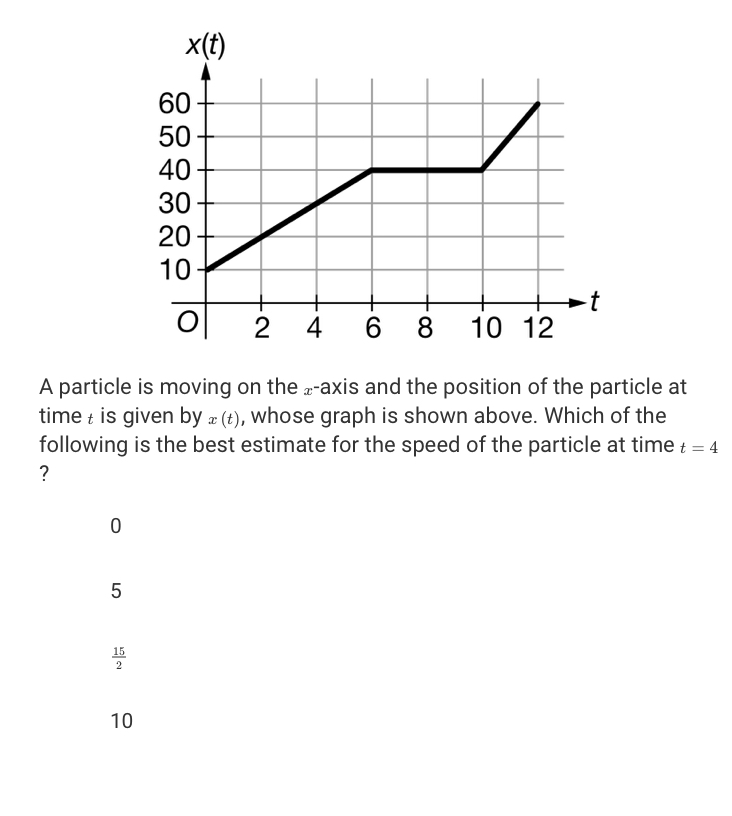
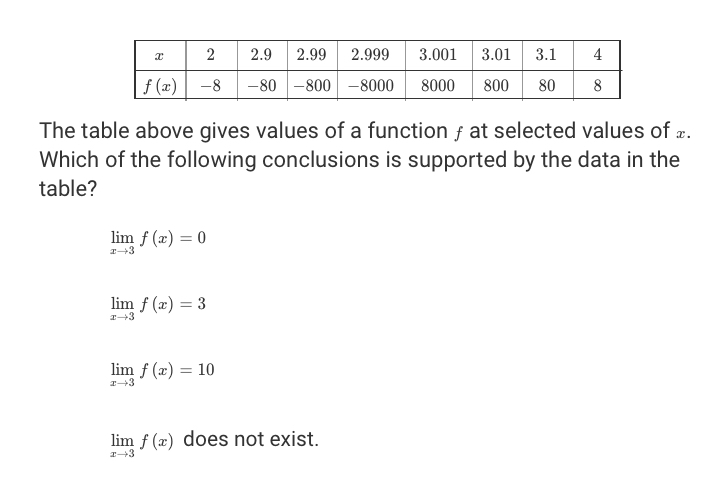
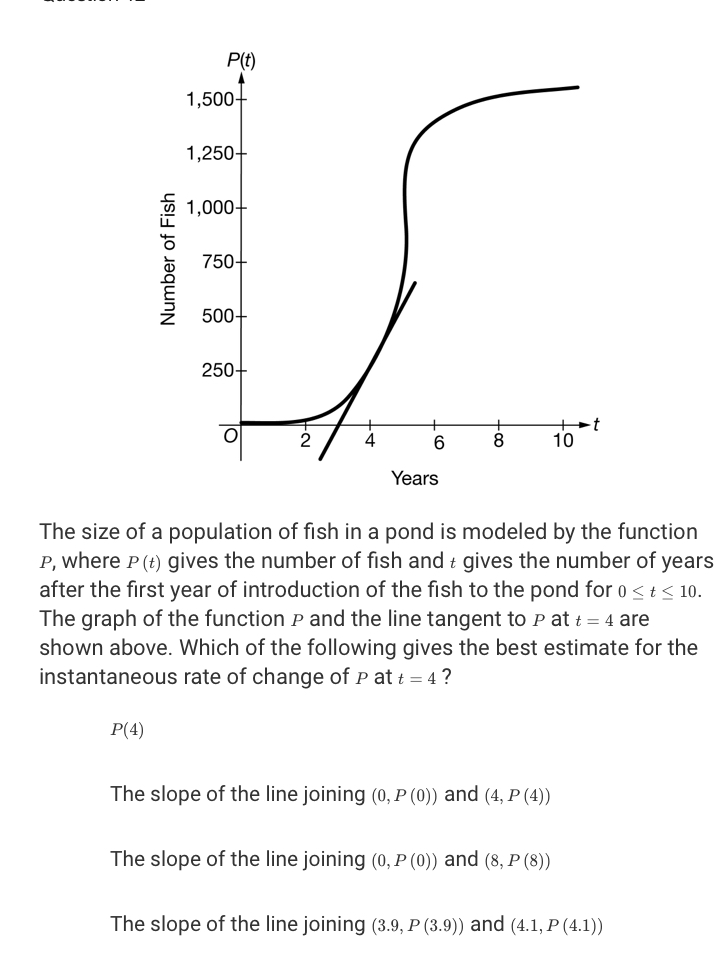
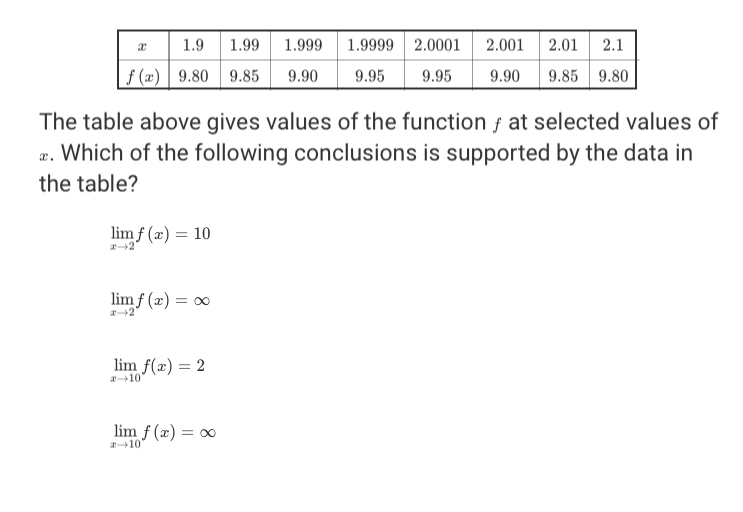
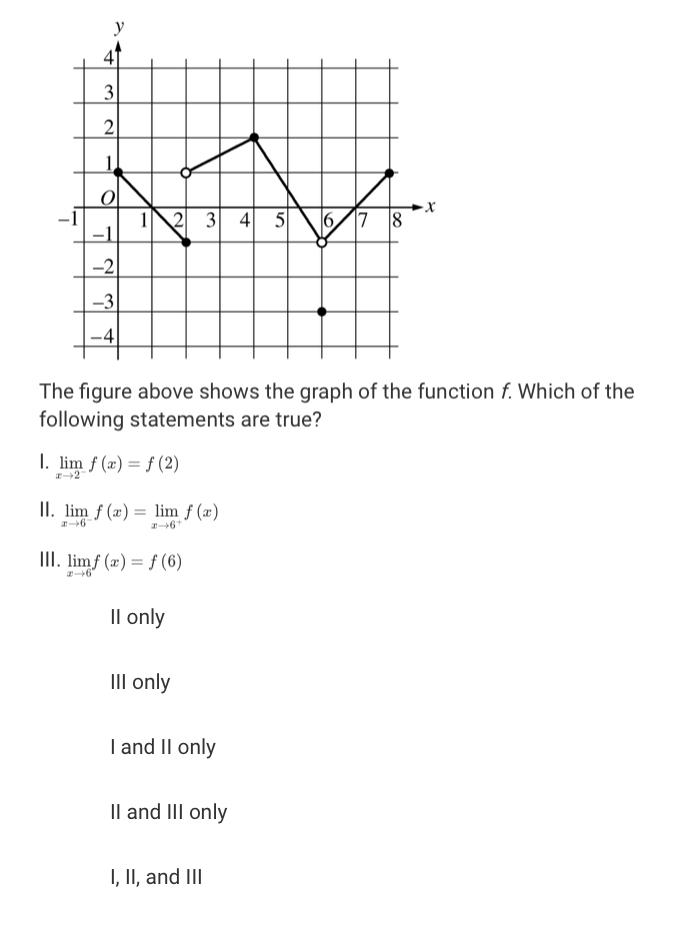
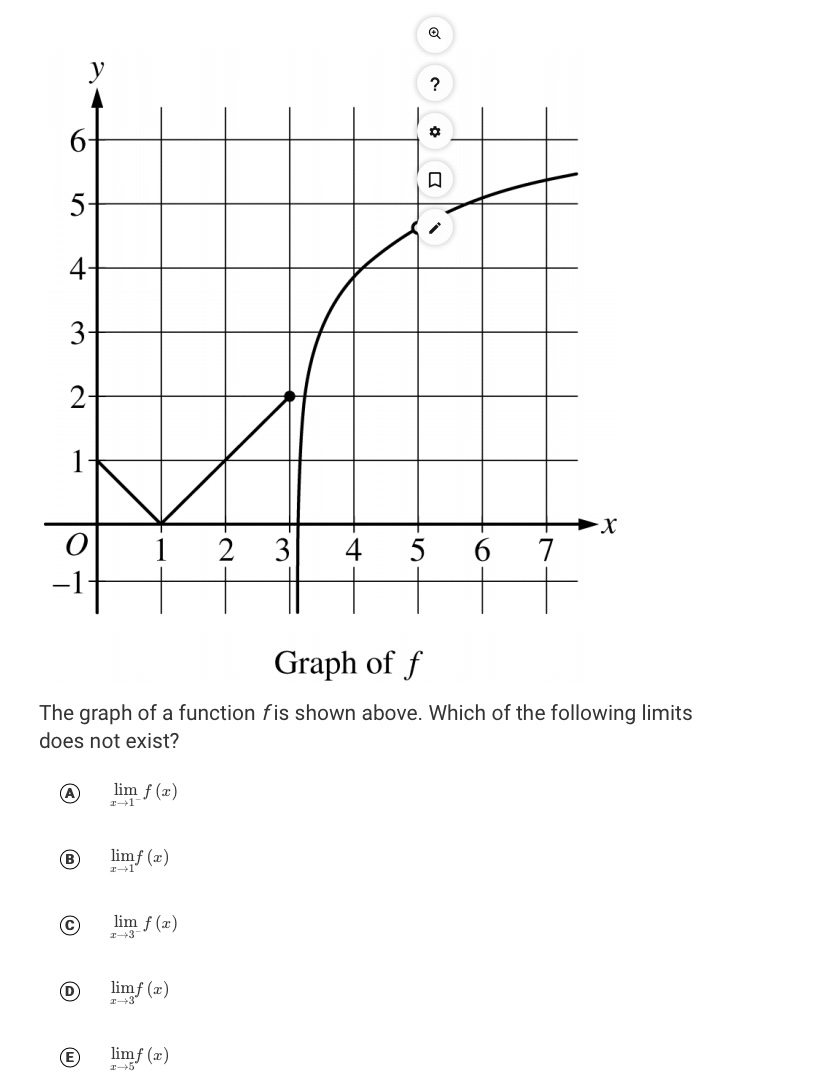
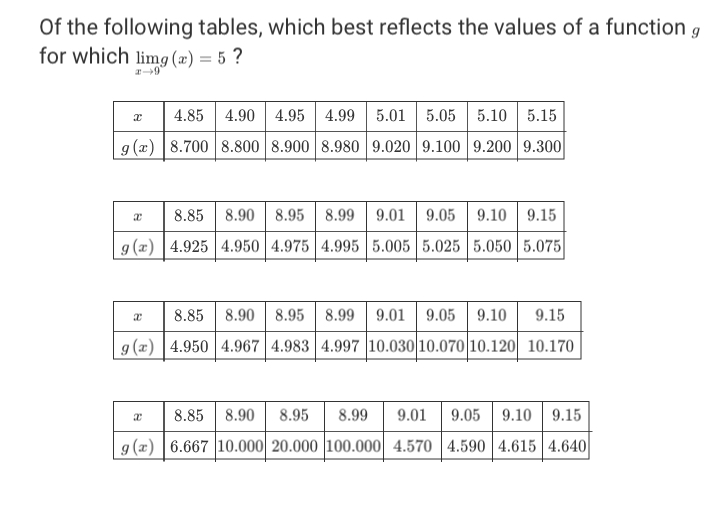
\fAn automobile is driven on a straight road, and the distance traveled by the automobile after time t = c is given by a quadratic function a, where s[f} is measured in feet and t is measured in seconds for c 5 t 1:: 12. 0f the following, which gives the best estimate of the velocity of the automobile, in feet per second, at time t = 3 seconds? 5 {3} 33:] B: al]s{2} 122 all\") -8l7} 9? \f60 50 40 30 20 10 O 2 4 10 12 A particle is moving on the r-axis and the position of the particle at time t is given by x (t), whose graph is shown above. Which of the following is the best estimate for the speed of the particle at time t = 4 ? 0 5 15 101 1.9 1.99 1.999 1.9999 2.0001 2.001 2.01 2.1 3 f(x) -4 -1.399 -1.040 -1.004 -1.000 6.001 6.012 6.121 7.261 25 The table above gives values of the function f at selected values of z. Which of the following conclusions is supported by the data in the table? lim f(x) = -1 lim f(x) = 6 lim f(x) = -1 and lim f(x) = 6 I-+2 lim f(x) = 6 and lim f(x) = -12 2.9 2.99 2.999 3.001 3.01 3.1 4 f (x) -80 -800 -8000 8000 800 80 8 The table above gives values of a function f at selected values of r. Which of the following conclusions is supported by the data in the table? lim f (x) = 0 T-+3 lim f (a) = 3 I-+3 lim f (x) = 10 I-+3 lim f (x) does not exist.P(t) 1,500 1,250- 1,000- Number of Fish 750+ 500- 250+ O t 6 10 Years The size of a population of fish in a pond is modeled by the function P, where P(t) gives the number of fish and t gives the number of years after the first year of introduction of the fish to the pond for o S ts 10. The graph of the function p and the line tangent to p at t = 4 are shown above. Which of the following gives the best estimate for the instantaneous rate of change of p at t = 4? P(4) The slope of the line joining (0, P (0)) and (4, P (4)) The slope of the line joining (0, P (0)) and (8, P (8)) The slope of the line joining (3.9, P (3.9)) and (4.1, P (4.1))nmmmm-m mmmm The table above gives values of the function f at selected values of 3. Which of the following conclusions is supported by the data in the table? limm) = 10 12+! Graph off The graph of the function f is shown in the gure above. The value of 11:33,:(1 33) is 1 2 3 4 nonexistent 3 2 -4 -3 -2 -1 O 2 3 4 -2 Graph of f The graph of the function f is shown above. What is lim f (f (x)) ? 3 -1 nonexistentLet f be a function that is defined for all real numbers c. Of the following, which is the best interpretation of the statement lim f(x) = 5 ? The value of the function f at x = 3 is 5. The value of the function f at x = 5 is 3. As * approaches 3, the values of f (x) approach 5. As * approaches 5, the values of f (x) approach 3.3 2 O 3 4 5 6 L 2 17 8 The figure above shows the graph of the function f. Which of the following statements are true? I. lim f (x) = f (2) Il. lim f (a) = lim f (x) -+6 Ill. limf (x) = f (6) 2-+6" Il only Ill only I and II only Il and Ill only I, II, and IllThe table above gives selected 1weluee and limits of the functions f, g; and h. What is lit}; [h {3] (2f [3) + 39(3) ? 120 104 56 32 ? 5 4 2 X O 2 3 4 5 6 Graph of f The graph of a function fis shown above. Which of the following limits does not exist? A lim f (x) B limf (x) 1-+1 C lim f (x) I-+3 D limf (x) E limf (x) E-+5"If fis a continuous function such that f(2) = 6, which of the following statements must be true? lim f (2x) = 3 lim f (2x) = 12 I-+2 lim f(x)-f(2) = 6 I-+2 I-2 lim f (x2) = 36 I-+2 lim (f (x))' = 36 -+2Of the following tables, which best reflects the values of a function g for which limg (x) = 5 ? 4.85 4.90 4.95 4.99 5.01 5.05 5.10 5.15 9 (x) 8.700 8.800 8.900 8.980 9.020 9.100 9.200 19.300 8.85 8.90 8.95 8.99 9.01 9.05 9.10 9.15 g (x) 4.925 4.950 4.975 4.995 5.005 5.025 5.050 5.075 8.85 8.90 8.95 8.99 9.01 9.05 9.10 9.15 4.950 4.967 4.983 4.997 10.030 10.070 10.120 10.170 8.85 8.90 8.95 8.99 9.01 9.05 9.10 9.15 6.667 10.000 20.000 100.000 4.570 4.590 4.615 4.640-NWA 2 Graph of f The graph of the function fis shown in the figure above. The value of lim sin (f (x) ) is 0.909 0.841 0.141 -0.416 nonexistent
Step by Step Solution
There are 3 Steps involved in it

Get step-by-step solutions from verified subject matter experts